EVOLUTION OF RUSSIAN GAS SUPPLY TO EUROPE: CONTRACTS AND PRICES - SERGEI KOMLEV HEAD OF CONTRACT STRUCTURING AND PRICE FORMATION DIRECTORATE
←
→
Page content transcription
If your browser does not render page correctly, please read the page content below
EVOLUTION OF RUSSIAN GAS SUPPLY TO EUROPE:
          CONTRACTS AND PRICES

                      SERGEI KOMLEV
   HEAD OF CONTRACT STRUCTURING AND PRICE FORMATION DIRECTORATE
                         GAZPROM EXPORT

                           34th WS2 GAC
                            April 23, 2021

                                                                  1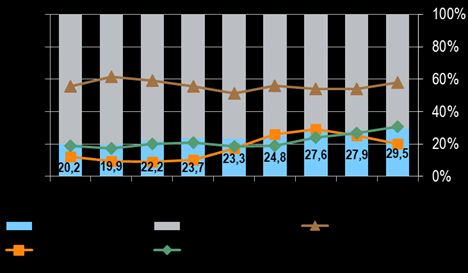
MAJOR TRENDS

    1. Competition on the European Gas Market
    LNG as Russian Pipeline Gas Main Competitor
    2. Role of the Long-Term Contracts
    Rational for Long-Term Contract: Security of Supply and Demand
    plus the Superior Trading Opportunities
    3. Evolution of Pricing Mechanisms
    From Oil Indexation to Hub Pricing
    Extreme Price Volatility

                                                                     2
EU GAS MARKET HEALTH METRICS (ACER*), 2019
Number of
550% 440% 330% 220% 110% 0% sources Over the last 10 years EU made the
Be-Lux NL NO QA OT 7 enormous progress in competition
- RSI, % enhancement on its natural gas market.
- HHI
- Threshold
Spain AL USA QA OT 11 Competition has strengthened both in terms
values France NO RU NL OT 12 of increased number of sources of supply
Netherlands NO D.P. RU OT 9 and the single supplier’s role reduction. Only
Italy RU AL QA OT 13 5 countries out of 22 surveyed by ACER
Greece RU TR AL OT 9 have less than three suppliers. Residual
United Kingdom D.P. NO QA OT 12
supplies index (RSI) is close to the EU Target
Poland RU D.P. DE OT 7
with the exception for several East and
Croatia RU D.P. AT 3
Germany RU NO NL OT 7
Central European countries. In 2018
Lithuania NO RU USA 3 Gazprom took legally binding commitments
Ireland UK D.P. 2 to address the EU Commission's concerns
Portugal NG USA AL OT 5 over its dominant position in these counties.
Hungary RU AT D.P. 4
Austria RU DE D.P. 3
ACER Gas Target Model
Slovenia AT RU D.P. 3
DK-SW D.P. DE 2 Metric Threshold values
Romania D.P. HU RU 4
Estonia RU LT 2 HHI HHI ≤ 2000
Bulgaria RU GR D.P. 4
RSI RSI ≥ 110%
Latvia RU LT 2
Finland RU 1 Number of sources Q≥3
10000 8000 6000 4000 2000 0 0% 20% 40% 60% 80% 100%
*The European Union Agency for the Cooperation of Energy Regulators 3
Source: ACER Annual Report on the Results of Monitoring the Internal Electricity and Gas Markets in 2019CONCENTRATION OF THE SUPPLIES TO EUROPE (HHI INDEX)
SUPPLIES TO EUROPE FROM THE THIRD COUNTIES SUPPLIES TO EUROPE INCLUDING INTERNAL PRODUCERS Herfindahl–Hirschman Index (HHI) is a
HHI i* 4241 4147 3335 3120 HHI t** 1919 1948 1745 1702 measure of the size of the suppliers and
100% 100% an indicator of the amount of competition
Others 6,9% 6,4% 5,7% Others
7,2% 14,6% 14,2% 14,9% 14,0%
2,2% 2,4% 3,6%
90% among them.
90% 2,7% Russia 6,1% 3,5% 3,4%
4,0% 4,0% 6,9%
Azerbaijan
2,1%
4,4% 4,5% 80%
4,2% 4,0% 5,1% 4,1%
4,7%
HHI points to ‘moderate concentration’ of
7,7%
7,2%
5,7% 5,6%
Netherlands 70% 8,6% 8,4%
5,4% 5,6% the European gas market when all the
Nigeria 80% 6,5% 6,6%
5,1% 7,8% 60% 7,9% 7,6% suppliers are taken into consideration.
USA 7,3% 7,9%
Russia 70% 15,9% 14,9% 8,9% 50% European gas market still remains in ‘high
9,2% 23,5% 22,7%
Qatar
40%
20,8% 22,0% concentration’ zone when domestic
USA 60% 10,8% supplier are taken out. However, HHI
10,9% Algeria (incl. LNG) 30%
index slashed nearly 1000 points over the
Qatar 20%
50% 62,4% 61,9% UK 33,9% 35,1% 33,4% 31,8% last 4 years and approaches ‘moderate
55,2% 52,8%
Algeria (incl. LNG)
10% concentration” terrain due to the LNG
Norway
40% 0% inflow.
2017 2018 2019 2020 2017 2018 2019 2020
Gazprom Gazprom With a declining indigenous production
LNG will become a main competitor to
HHI threshold values European Commission U.S. Department of Justice and FTC Gazprom.
Low concentration HHI < 1000 HHI < 1500
Introduction of carbon tax on the
imported gas puts LNG in a less
Moderate concentration 1000 < HHI < 2000 1500 < HHI < 2500 advantageous position in comparison
High concentration 2000 < HHILESSONS FROM 2020
• LNG spot deliveries are
extremely price sensitive.
20% When prices on the European
18%
gas market dropped to below
$2/mbtu most LNG suppliers
16%
14%
12% were unable to return their cash
10% costs.
8%
• Being a low-cost producer,
6%
4%
2% Gazprom was only moderately
0% affected by a prices meltdown
January February March April May June July August September October November December
and managed to uphold
deliveries when flows of flexible
LNG left Europe and created
gas deficit in H2 2020.
PJSC Gazprom LNG
Source: IHS, Gazprom 5LONG-TERM CONTRACTS RETAIN THEIR DOMINANT POSITION IN EUROPE
Term versus Spot Sales in LNG Trading
• Third Energy Package gave
suppliers a formal opportunity to
export the entire volume of gas on
a spot basis. However, this
opportunity remained unclaimed.
And this is not just a matter of the
“heritage” of the previously
concluded legacy LTCs, which, by
the way, could be terminated by
mutual agreement of the parties.
Parameters of the global portfolio of pipeline contracts
• LTCs facilitate development of the
50
Duration of entering into force contracts
30 European forward and futures
40 and weighted average contract length in world portfolio 28 markets by providing them with
backup physical liquidity.
30 26
Monetization of LTCs is a specific
years
bcm
20 24 feature of the European forward/
10 22
futures market that has a distinct
physical nature, not a financial
0
2010 2011 2012 2013 2014 2015 2016 2017 2018 2019 2020 2021 2022
20 nature like in the United States.
< 10 years 10 - 20 years 20 years and more Weighted average length (world portfolio)
Source: IHS Waterborne, Cedigaz 6LONG-TERM CONTRACTS RECEIVED ADDITIONAL SUPPORT FROM TRADING
Rational for long-term S&P contracts
Assumes long-term offtake obligations taking into account the
prospective market needs. Reselling significant gas volumes on the
Buyer/importer
domestic market only on a short-term basis is impossible. Contract
Security of demand duration affects the efficiency of trading operations.
Is interested in guaranteed sales for long-term planning and long-
Seller/exporter
term borrowing.
Choice between term and spot deliveries depends on the
Buyer/importer
availability of gas in the market.
Security of supply
The LTC reduces the risks of supply interruptions. The exporter
Seller/exporter assumes obligations taking into account the long-term capabilities of this
resource base.
Source: Compiled by the author
7FROM PRICING BASED ON GAS-ON-SUBSTITUTE TO GAS-ON-GAS COMPETITION
EUROPE PRICE FORMATION 2005 TO 2019 • Europe is the region where
the most significant changes
in price formation
mechanisms have taken
place.
• In the total consumption there
has been a broadly
continuous move from oil-
indexation to pricing based on
gas-on-gas competition since
2005.
• Share of oil-indexation in
Europe dropped from 78% in
2005 to 22% in 2019.
Source: Wholesale Gas Price Survey 2020 Edition/ A Global Review of Price Formation Mechanisms 2005 to 2019, June 2020
8PRICE FORMATION MECHANISMS IN GAS IMPORTS TO EUROPE
GAS IMPORTS TO GAS IMPORTS TO
THE EUROPEAN FAR ABROAD THE EU-27 + UK
4,1%
0,0% 100% 3,4% 0,0%
5,6% 4,3% 7,2%
9,0% 12,3% 10,1%
26,3% 80%
30,7%
44,4%
34,1% 58,9% 48,9%
54,3% 61,3%
55,9% 73,9%
60%
40%
68,1%
60,3%
53,6% 51,4%
46,8%
41,1% 20% 38,5%
34,1% 35,3%
26,1%
0%
2016 2017 2018 2019 2020 2016 2017 2018 2019 2020
Oil-indexed Hub-indexed** Fixed price
* Norway considered as internal supplier
** From 2020 г. includes quasi-oil indexation and fixed price based on year-ahead forwards
Sources: IEA, IHS Markit, Gazprom Export estimates 9GAZPROM EXPORT SALES PORTFOLIO COMPOSITION BY PRICING MECHANISMS
FOLLOWS THE EUROPEAN TRENDS
10CORRELATION OF GAS HUB PRICES WITH OIL PRICES IS STILL STRONG
Correlation between Year-Ahead Price on TTF and Oil indexes
Y-A Mid Price - Y-A Mid Price - Y-A Mid Price - Y-A Mid Price -
R-coefficient
Brent Brent 3-monthMA Brent 6-monthMA Brent 9-monthMA Why, despite significant shift
2010-2013 88% 90% 87% 86% away from oil indexation, natural
2014-2015 91% 89% 89% 93% gas prices retain strong
2016-2018 82% 89% 89% 84%
2019-2021 84% 77% 67% 56% correlation with oil prices?
2010-2021 91% 92% 91% 90%
Oil-indexation departed from the LTCs but inter-fuel competition cannot cease to exist Although oil-indexation has lost
its dominance, inter-fuel
competition still plays an
important role in pricing but
setting up a price corridor for
natural gas between oil products
and coal on an energy parity
basis*
*For discussion see: Komlev S. Foundations of Natural Gas Price Formation/ Misunderstandings Jeopardizing the Future of the Industry. Anthem Press. NY. 2020
11HYPER VOLATILITY OF DAY-AHEAD AND MONTH-AHEAD PRICES
Uncomfortable questions remain*.
Average Deviation of TTF Forward Prices from the TTF Day- Ahead Price Index
• Why integration of regional gas
market does not lead to the formation
of one price similar to global
benchmarks typical for other
commodities?
• What makes prompt prices so
volatile?
• What is behind the diversion of the
forward prices with different
longevity?
Source: Bloomberg
*For discussion see: Komlev S. Foundations of Natural Gas Price Formation. Misunderstandings Jeopardizing the Future of the Industry. Anthem Press. NY. 2020.
1213
You can also read