DOMESTIC MARKET REPORT | Q1 2021 REPORT FROM CANADA BEEF - Canadian Beef Performs
←
→
Page content transcription
If your browser does not render page correctly, please read the page content below
DOMESTIC MARKET REPORT | Q1 2021

REPORT FROM CANADA BEEF                                                                               Key Indicators for the Economy
                                                                                   Key Economic Indicators for China October 2011

Economic Outlook
Canadian GDP is forecast to increase 4.7% in 2021, based on
OECD projections. With a 5.4% decline from 2019 to 2020
the increase in 2021 would still be 0.7% shy of 2019 levels.
Major factors affecting the domestic beef markets will include
labour market recovery, disposable income, and retail growth.

Mining, manufacturing, air travel and arts and entertainment
were among the industries feeling the most significant
contraction in GDP contributions in 2020. The decreases point
to less special service demand, which was down $3 billion             Retail beef prices were up 6% from 2019 to $20.37/kg in
last year (15% of the food service total for 2020). The return        2020, up 4.6% from the five-year average, based on seven cut
of in-person conferences, international tourism, and concerts         national data. Retail beef prices were steady from June 2020
would bolster demand for special service. Until that happens,         through January 2021. Consumers however, experienced
more sales will be rooted in retail. Dine-in restaurant sales         varied price increases by province. A provincial four cut
have halved from usual, based on the latest available data            average shows that in the east (ON, QC, MT), beef prices were
from December, with full-service restaurants under heavy              up 8.4%; and in the west (AB, BC, SK and MB), prices were up
                                                                      9.9%. Price increases were the highest in British Columbia
regulations through public health orders.
                                                                      (+10.7%) and the lowest in Quebec (+6.7%).
Canadians are feeling more confident and the labour market
                                                                      Retail pork ($13.14/kg) and chicken ($7.43/kg) prices re-
looks up. Consumer confidence grew to 91.1 points in
                                                                      mained steady in 2020. The beef to pork price ratio was 1.52
February, the highest level since the pandemic started, up
                                                                      in January 2021, down from 1.53 in January 2020 and the
0.4% from January to February and up for the third straight
                                                                      five-year average for January, to the slight favour of beef. The
month. Unemployment swung to 8.2% in February 2021 from
                                                                      beef to chicken ratio was 2.76 in January 2021, up from 2.62
9.4% in January.
                                                                      in January 2020, favouring chicken, and up from the five-year
                                                                      average for January at 2.59.
Retail Sector
                                                                      In January 2021, retail beef prices were up 4.2% from January
Canadian beef markets may chart a new line following some
                                                                      2020. The price of high-end cuts such as prime rib (+9%) and
upending in 2020. While some familiar patterns re-emerge;
there are permanent changes since June 2020 coming into
focus. This raises the question: will the new trends become
normal, or are they just here for now?

The retail beef demand index is projected to be up 6.8% in
2020 at 120.5 (2000=100). This is the highest level since 2016
(122.88) and the second highest level in nearly twenty years.
The heightened demand bolstered gross revenues in process-
ing and retail segments of the supply chain, with the com-
bined gains penned at $563 million.

1
Final consumption numbers will be published at the end of May 2021.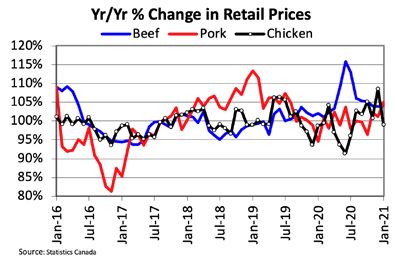
sirloin steak (+4%) increased substantially. Everyday prod- support to the wholesale market. With laissez-faire firmly
ucts like ground beef and blade roasts were up just 0.2% and in the rear-view, food service buying could have sporadic
holding relatively steady between October 2020 and January impacts on wholesale prices this spring.
2021. While some stability occurs as balance is restored to the
Recent data show that consumers chose high-grade cuts for
market, seen in the everyday cuts and the average retail beef
backyard grilling during the warm weather, which is consistent
price, the cut prices have been turbulent month to month
with seasonal trends. Ribs have been a top choice for small
when compared to 2019. The volatility for cuts comes from
special occasions. Choice round prices were strong, up 7% in
uncertainty triggering exaggerated price fluctuations at retail February 2021 from February 2020, but Choice brisket was
and wholesale. down 4%. Chuck and round pricing may indicate that families
are finding these everyday products valuable and convenient,
Wholesale Sector perhaps for lunches and dinners while they spend more time
Wholesale beef demand in Canada was up an estimated 10% working and schooling from home.
in 2020 at 102.1 (2003=100). This would be the largest year
over year increase since 2015 and the highest level of demand The 85% trim market moved above 2020 levels in late Feb-
in the last 20 years surpassing the previous high made in ruary, following a seasonal start and prices steady with the
2015 at 96.1. Demand was driven by both the domestic and three-year average in January. In February 2021, the price of
international consumer. The USDA Choice-Select composite 85%trim was CDN$252/cwt (US$198.87/cwt), 4.6% higher
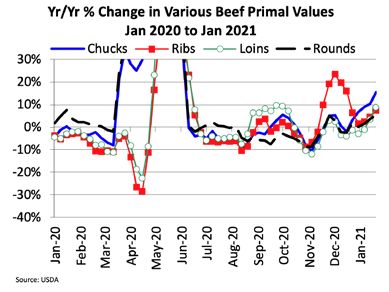
beef cutout was CDN$317/cwt in 2020, up 9% from 2019. than the three-year average for February. In contrast, the 50%
trim market is struggling from lower food service demand. At
The Choice-Select spread started the year 266% higher than CDN$61.38/cwt (US$48/cwt) in February 2021, 50% trim was
2020 at CDN$13.70/cwt (US$10.79/cwt), indicating strong priced 30% lower than the three-year average. The 50% trim
interest for quality beef. In February 2021, the Choice cutout market has been performing below average since June 2020.
was CDN$300/cwt, up 14% from February 2020 and up
3% from the five-year average. The Select cutout price was
CDN$285/cwt, up 10% from February 2020 and 9% from the
five-year average.
Counter seasonal price rallies among all the primals occurred
from January to February 2021; notably, Choice ribs (+19%),
Choice chuck (+20%), and Choice loin (+18%) moved to well
above 2020 levels. Prices softened into March, but spring
buying is just around the corner, a time that typically lends
.
Food Service
Total food service sales in 2020 (excluding drinking establish-
ments) were $54 billion, down 27% or $20.3 billion from 2019.
Food and beverage, grocery, and supermarket sales were
$26.1 billion higher in 2020 than 2019. The food service and
accommodation industry made up 0.82% of Gross Domestic
Product (GDP) in 2019. In 2020, that share fell to 0.57%. The
difference is just one quarter of a percent, but a $14.5 billion
shift in contribution to GDP.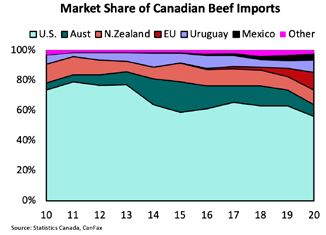
Limited-service eating places were less affected than full
                                                                 service restaurants. Limited-service sales were down 4.7%
                                                                 September to December, seeming to steady. Full-service
                                                                 restaurant sales were down 35.8% September to December,
                                                                 trending down. Neither industry has fully recovered to pre-
                                                                 pandemic sales levels: Limited-service sales in December
                                                                 2020 were down 11.9% from December 2019 and February
                                                                 2020, the start of the pandemic in North America; full-service
                                                                 sales were down 52.2%.

                                                                 Imports
                                                                 In 2020, Canadian beef imports were up 22% in volume at
                                                                 188,932 tonnes and 24% in value at $1.52 billion. Imports
                                                                 were up from all major suppliers except from Australia (
Both full and limited-service restaurant sales were trending     10.4%), where exports were impacted by reduced production.
up from April to September 2020, but moved down month            Imports were up from the U.S (+9.2%), New Zealand (+33.5%),
over month from September to December 2020, falling 18.3%        Mexico (+36.9%), Uruguay (+94.7%), and the EU (+153.3%).
nationally. From September to December 2020, sales in-           Imports from non-CUSMA countries were up 45.6%.
creased in Newfoundland and Labrador (+5.2%), and Nunavut
(+4.6%). Sales declined to varying degrees in Quebec ( 27%),     From 2019 to 2020, market share of imports declined from
Manitoba ( 25%), Alberta (-24%), Ontario ( 17%), Saskatche-      the U.S. (63% to 56.1%) and Australia (10.6% to 7.8%). The
wan ( 14.2%), Nova Scotia (-11.3%), British Columbia (-10.8%),   market share of imports increased from New Zealand (9% to
the Yukon (-7.3%), Northwest Territories ( 6.5%), New Bruns-     9.8%), the EU (5.6% to 11.5%), Uruguay (5.2% to 8.2%) and
wick (-4.6%), and Prince Edward Island (-4.5%). From Novem-      Mexico (3.9% to 4.3%).
ber to December, sales were starting to recoup in Manitoba       In January 2021, beef imports were up 20% in volume and
(+4.9%), Saskatchewan (+0.8%) and Newfoundland and               up 11% in value – with volumes steady with the five-year
Labrador (+0.2%).                                                average. Import volumes declined from the UK (-41%), Brazil
                                                                 (-36%), the EU (excluding UK) ( 6%), and Australia ( 6%), but
                                                                 increased from Uruguay (+494%), New Zealand (+110%),
                                                                 Mexico (+28%), Argentina (+26%), and the U.S. (+6%).
You can also read