Changements climatiques: Quelques remarques sur Bastin-Cassiers (2013)
←
→
Page content transcription
If your browser does not render page correctly, please read the page content below
Changements climatiques:
Quelques remarques sur
Bastin-Cassiers (2013)
Jean-Pascal van Ypersele,
avec Philippe Marbaix

UCL-TECLIM
(Université catholique de Louvain, Centre
de Recherches sur la Terre et le Climat
Georges Lemaître)

Toile:      www.climate.be
Courriel:   vanyp@climate.be

Journée de contact FNRS « Redéfinir la
prospérité », ULB, (20130913)
CO2 concentration measured
at Mauna Loa (3400 m)

  Source: Dr. Pieter Tans, NOAA/ESRL (www.esrl.noaa.gov/gmd/ccgg/trends/)
                          Jean-Pascal van Ypersele
                         (vanypersele@astr.ucl.ac.be)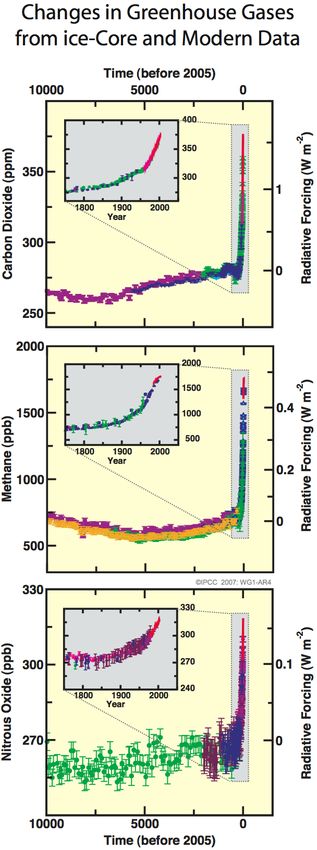
Human and
 Natural Drivers
   of Climate
    Change:
 Unprecedented
• Dramatic rise in the
industrial era
• Largest growth rate of
CO2 seen over the last
ten years (1995-2005)
than in any decade at
least since direct
measurements began
(1960).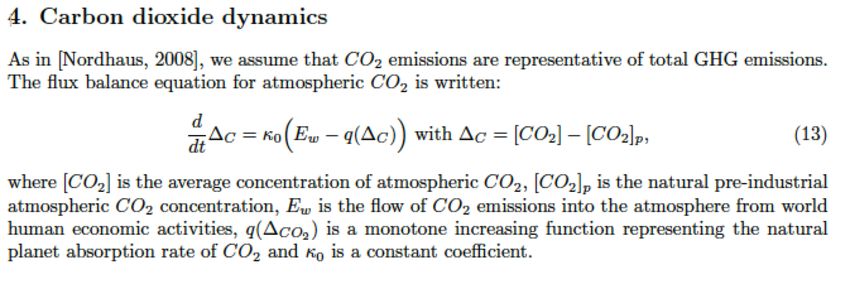
Some information about carbon dioxide changes through four past ice
     ages (from ice cores), and in the modern era (from global data)

                                                                              The past 100 years

                                        350

                                                                                 Last interglacial

                                                                                                           Last Ice Age
         Carbon Dioxide Amount (ppmv)

                                        300

                                        250
                                                                                                                                  Ice ages
                                                                                                                                  are
                                                                                                                                  'forced'
                                                                                                                                  by

                                        200
                                                                                                                                  earth’s
                                                                                                                                  orbital

                                                400x10
                                                         3

                                                              300               200

                                                                                                         100

                                                                                                                            0     clock….

                                                                      Years Before Present

It is well established that there is more carbon dioxide in the atmosphere today
than there has been in at least 650,000 years. (Figure by S. Solomon)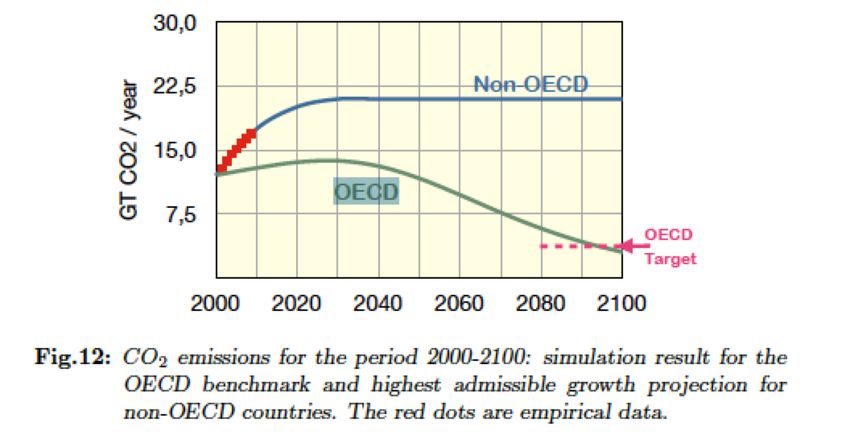
Carbon cycle: unperturbed, balanced fluxes
                                                        Atmosphere         280 ppmv          (1ppmv = 2.2 GtC)

                                                                pre-ind : 597 GtC

                                           Physical, 70.5
                                         Chemical, and
photosynthesis                            Biological
                   119.5                   processes
  120                               70
                 respiration

                                            Ocean
                                                    38000                                3700
          2300
                               Units: GtC (billions tons of carbon) or GtC/year (multiply by 3.7 to get GtCO2)
     vanyp@climate.be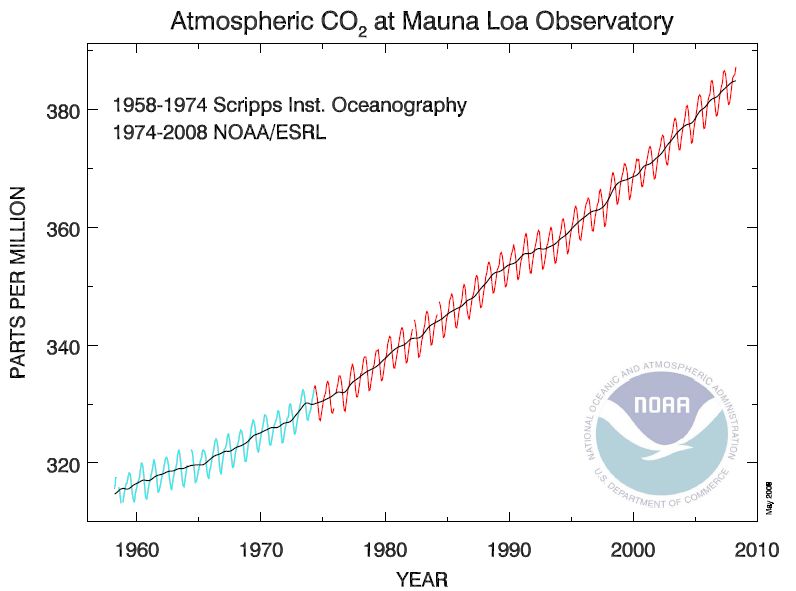
Carbon cycle: perturbed by human activities
           (numbers for the decade 1990-1999s, based on IPCC AR4)
                                                      Atmosphere          280 ppmv + 1.5 ppmv/yr (1ppmv = 2.2 GtC)

                                                                pre-ind : 597GtC + 3.2/yr

                                                    70.5
                                      Physical,
photosynthesis                      Chemical, and
                      119.5          Biological
  120                                 processes
         2.6     respiration   70
        sinks
                                                                    1.6                         6.4
                                                               déforestation
                                    2.2                    (& land use changes)            Fossil fuels

                                          Ocean
                                                  38000 +120                               3700 -244
           2300 -40
                                          Units: GtC (billions tons of carbon) or GtC/year
                                                                                                      Stocks!
   vanyp@climate.be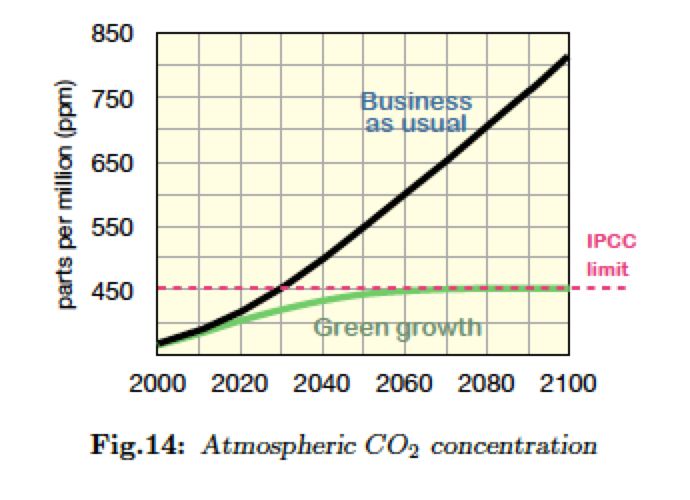
Jean-Pascal van Ypersele
(vanypersele@astr.ucl.ac.be)
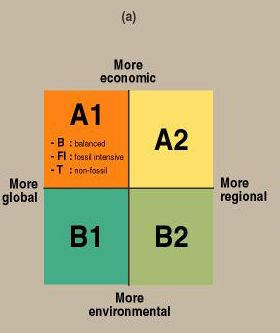
Scenarios SRES
       (Special Report on Emission Scenarios, IPCC 2000)
A1: A world of rapid economic growth and
rapid introductions of new and more efficient
technologies

A2: A very heterogenous world with an
emphasis on familiy values and local traditions

B1: A world of „dematerialization“ and
introduction of clean technologies

B2: A world with an emphasis on local
solutions to economic and environmental
sustainability

IS92a „business as usual“ scenario (1992)
Augmentation de la température globale à
ES (max)
l’équilibre en fonction de la concentration
stabilisée
Equilibrium global mean temperature
increase over preindustrial (°C)
2070 2080 2090 2100
GHG concentration stabilization level (ppmv CO2-eq)
Figure SPM 8: Stabilization scenario categories as reported in Figure SPM.7 (coloured bands) and their
relationship to equilibrium global mean temperature change above pre-industrial, using (i) “best estimate” climate
sensitivity of 3°C (black line in middle of shaded area), (ii) upper bound of likely range of climate sensitivity of
4.5°C (red line at top of shaded area) (iii) lower bound of likely range of climate sensitivity of 2°C (blue line at
bottom of shaded area). Coloured shading shows the concentration bands for stabilization of greenhouse gases in
the atmosphere corresponding to the stabilization scenario categories. The data are drawn from AR4 WGI, Chapter
10.8.
IPCCThe lower the stabilisation level the
earlier global emissions have to go
down
Post-SRES (max)
35
Stabilization targets:
E: 850-1130 ppm CO2-eq
30 D: 710-850 ppm CO2-eq
Equilibrium global mean temperature
C: 590-710 ppm CO2-eq
increase over preindustrial (°C)
25 B: 535-590 ppm CO2-eq
Wold CO2 Emissions (GtC)
A2: 490-535 ppm CO2-eq
A1: 445-490 ppm CO2-eq
20
15
10
5
Post-SRES (min)
0
-5
2000 2010 2020 2030 2040 2050 2060 2070 2080 2090 2100
Multigas and CO2 only studies combined GHG concentration stabilization level (
IPCCLong term mitigation (after 2030)
•The lower the stabilization level, the more quickly emissions would
need to peak and to decline thereafter
•Mitigation efforts over the next two to three decades will have a large
impact on opportunities to achieve lower stabilization levels
Stab level Reduction in 2050
Year CO2 needs to peak
(ppm CO2-eq) Global Mean temp. increase compared to 200
at equilibrium (ºC)
445 – 490 2.0 – 2.4 2000 - 2015 -85 to -50
490 – 535 2.4 – 2.8 2000 - 2020 -60 to -30
535 – 590 2.8 – 3.2 2010 - 2030 -30 to +5
590 – 710 3.2 – 4.0 2020 - 2060 +10 to +60
710 – 855 4.0 – 4.9 2050 - 2080 +25 to +85
855 – 1130 4.9 – 6.1 2060 - 2090 +90 to +140
IPCCBastin & Cassiers (2013) Discussion Paper 2013-14, IRES, UCL.
Page 6, début de section 4, il est fait référence à Nordhaus
2008. Cela se rapporte à la phrase : "CO2 emissions are
representative of total GHG emissions". Ce que Nordhaus fait,
c'est qu'il ne simule que le CO2 et prend le reste de façon
"exogène". Cette phrase ne dit rien de tel.

Plus ennuyeux: il n'y a aucune référence pour le "modèle du
carbone" qui suit immédiatement cette phrase !!!
Le modèle du cycle du carbone au cœur de Bastin & Cassiers
2013 tient en fait en une seule équation, la (13). Cette équation
vient sans doute de Nordhaus 1991, qui n'est pas cité en fin
d'article. Nordhaus a cessé d'utiliser cette équation en 1999.
  Commentaire sur Bastin & Cassiers (2013) Discussion Paper 2013-14, IRES, UCL.
A key aspect that required improvement is the
representation of the carbon cycle. The original
version of DICE/RICE [Nordhaus, 1991] has
been repeatedly criticized in this regard [Price,
1995, Joos et al., 1999], in particular because it
involved an equation that assumes that a (fixed)
fraction of the emited carbon is instantaneously
absorbed and “disappears” and that all carbon
would ultimately end up destroyed.

   Marbaix & Gerard, 2008 (Climneg Paper, CORE, UCL)
This criticism was partly addressed in the subsequent
versions of RICE [Nordhaus and Boyer, 1999b] which
includes a “three reservoir” carbon representation
that is still used in the current version [Nordhaus,
2007]. (…) However, even these updated models do
not fully address the criticism presented in Joos et al.
[1999]: the penetration of carbon in the ocean, which
is a key process, is still represented by a linear system
in spite of the highly non-linear effects that are taking
place in the actual carbon cycle.
  Marbaix & Gerard, 2008 (Climneg Paper, CORE, UCL)
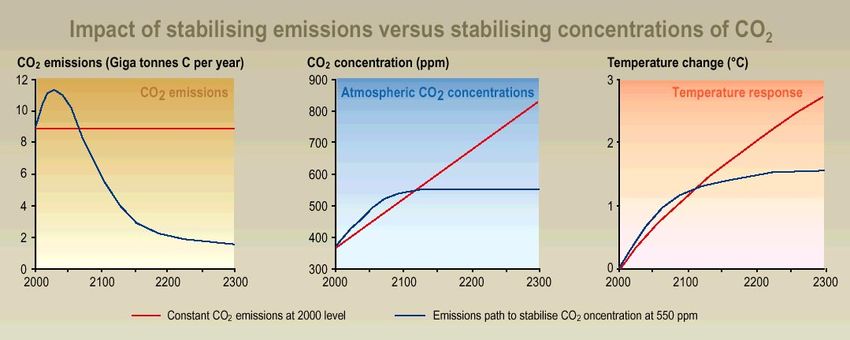
Bastin et Cassiers ont donc un cycle du carbone
     obsolète depuis plus de 15 ans, et complètement
     faux, comme on peut s'en apercevoir en regardant les
     résultats :
     il est en effet totalement impossible de stabiliser les
     concentrations de CO2 à 450 ppm avec les émissions
     de la figure 12.

Commentaire sur: Bastin & Cassiers (2013) Discussion Paper 2013-14, IRES, UCL.
Source: Bastin & Cassiers (2013) Discussion Paper 2013-14, IRES, UCL.
Source: Bastin & Cassiers (2013) Discussion Paper 2013-14, IRES, UCL.
Autre bizarrerie dans ce papier: le fait de considérer
     que la « limite » de 450 ppm aurait été définie par le
     GIEC (introduction, figure 14).

     Le mandat du GIEC est d’être « politiquement
     pertinent » (policy-relevant), sans être « prescriptif »

     La Conférence de Copenhague (2009) a estimé que
     l’objectif devait être de ne pas dépasser une
     augmentation de la température globale de plus de
     2°C (voire 1.5°C: à revisiter en 2015). Ce fut une
     décision polotique, prise au plus haut niveau, et non
     une décision du GIEC.
Commentaire sur: Bastin & Cassiers (2013) Discussion Paper 2013-14, IRES, UCL.
Pour en savoir plus...
www.climate.be : UCL-TECLIM
www.ipcc.ch : IPCC ou GIEC
www.belspo.be (projet CLIMNEG)
www.skepticalscience.com: answers to
« skeptics »
Jean-Pascal van Ypersele
(vanypersele@astr.ucl.ac.be)You can also read