Annual Press Conference - FY2019 March 10th, 2020
←
→
Page content transcription
If your browser does not render page correctly, please read the page content below

Annual Press Conference
FY2019
March 10th, 2020
Andreas
Schierenbeck
CEO
Uniper’s evolutionary steps
Tightening the ship: Setting the sails: Going to open seas:
2015 - 2017 2018 - 2019 2020 onwards
TSR
+200%
CO2 reduction
CO2
>36%
Cash optimized Operations improved Vision 2035+
Portfolio streamlined Growth in Security of Supply initiated Long-term Carbon targets
Rating secured Legacy projects put on home stretch Transition Agenda
Transparency increased Track record of delivery established
* Unipers total generation Scope 1 emissions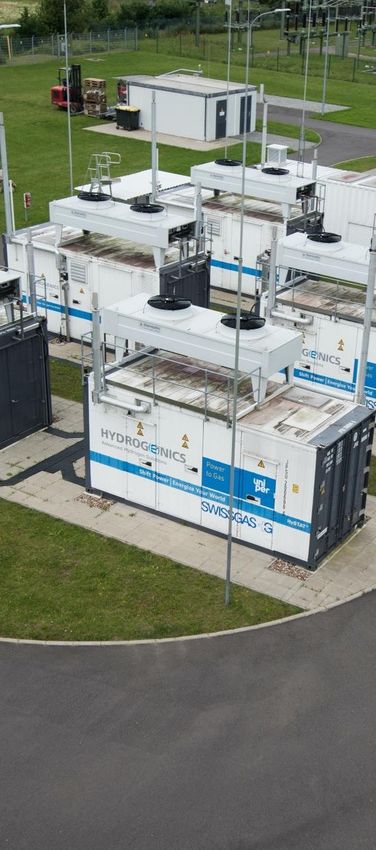
Major developments 2019
Performance Portfolio & Strategy Team Shareholders
Adj. EBIT FY 2019 Clearly committed Executive Management team Continuous dialogue
of €863m in line with timetable for exiting hard complete
increased guidance coal in Germany Fortum supports Uniper’s
on back of strong Q4 Several initiatives launched strategy and financial
Agreement for sale to accelerate transition of policy
Dividend proposal of Schkopau will end company
for FY 2019 raised Uniper’s lignite exposure
to €421m by Oct 2021
Credit rating headroom Significant progress in
improved business (e.g. Irsching 6,
Scholven)
Businesses performed well

European         Global        International
Generation       Commodities   Power
Sascha
Bibert
CFO

Results FY 2019 – Fully in line with increased outlook

 Adj. EBIT in €m         Net Income in €m         Operating Cash Flow in €m

                                        644           1.241
                                                                 931
     865           863

                             -442

   FY 2018     FY 2019      FY 2018     FY 2019      FY 2018    FY 2019
Economic Net Debt impacted by decreasing interest rate

 Economic Net Debt in €m             S&P Global Ratings

                                     BBB
                            2.650
          2.509

                                     Watch negative

        FY 2018            FY 2019
Outlook: Earnings and dividend expected to increase

 Adj. EBIT expectations in €m   Adj. Net Income expectations   Dividend outlook in €m
                                in €m

              750 – 1.000

      863                                    550 - 800
                                   614
                                                                             ~500
                                                                   421

    FY 2019      FY 2020E          FY 2019    FY 2020E              2019     2020E
    Actuals       Target           Actuals     Target             Proposal   Target
Energy sector reducing CO2

                      Global Greenhouse Gas Emissions                              CO2 reduction energy sector: 34,58%
                      by Economic Sector
                                                                         163,3

                                    Other
                                                                         209,7
                                    10%                                             159,9
                                                                                              153,0
                                                                                                        165,6
                                                  Electricity and                                                 167,9
European                                         Heat Production
                                                                         283,8
                                                                                    153,9
                                                                                              148,5
                                                                                                                            162,3       166,5

                        Industry                      25%                                               130,0     123,4
Green Deal:              21%                                                        191,6
                                                                                              188,5     188,2
                                                                                                                            116,6       125,1

                                                                                                                  197,7     194,9       176,2
Economy with                                        Agriculture,
                                                 Forestry and Other      466,4
net-zero greenhouse       Transportation             Land Use                      397,4      369,4     343,4     322,5     305,1       300,7
                             14%                      24%
gas emissions
by 2050                                                                  1990      2005      2010      2016     2017*     2018*        2020
                                     Buildings                                                                                      Mio. t CO2 e
                                       6%
                                                                                 Energy sector                      Industry

                                                                                 Buildings                          Transportation

                      Source: Intergovernmental Panel on              Source: Calculations of the Öko-Institut, Fraunhofer and IREES
                      Climate Change (IPCC)                           *Data for 2017 and 2018 from current inventory data (UBA 2020)
The world needs more energy
Global Sector demand Global primary Global gas Global electricity
population for electricity energy demand demand generation
+21% +61% +23% +37% +55%
+434%
+45%
Source: World Energy Outlook 2019 (2018-2040)CO2
CO2
Uniper production capacity
in GW

                                                    Gas 17.4 GW
                                                    Coal 9.2 GW
                                                    Nuclear 1.4 GW
                                                    Hydro 3.6 GW
                                                    Others 2.8 GW*

* Other includes Biomass, Renewables and Fuel Oil
Uniper production capacity
in GW
Gas 17.4 GW
Coal 9.2 GW
Nuclear 1.4 GW
Hydro 3.6 GW
Others 2.8 GW*
Hydro and nuclear CO2 freeUniper‘s energy generation by fuel type
today in the futureDriving decarbonization actively
European Generation Global Commodities International Power
22.2
mt CO2
With our
measures
0
2019 2025 2030 2035
Carbon neutral by 2035 Actively reduce carbon emissionsUniper‘s new strategy – Clear transition agenda
Coal generation Gas generation & mid-stream Carbon-free generation
Clear exit path for Europe, Expand & decarbonize Maintain & expand
site conversion and/or
optimization
Proactive transformation Leverage current portfolio New BusinessUniper‘s new strategy – Clear transition agenda
Coal generation Gas generation & mid-stream Carbon-free generation
Clear exit path for Europe, Expand & decarbonize Maintain & expand
site conversion and/or
optimization
Proactive transformation Leverage current portfolio New BusinessUniper coal exit plans per country
Germany Netherlands UK
> -40%
4.9 GW** CO2 emissions
2.0 GW
1.1 GW 1.1 GW
2020 2025 2038* 2020 2029* 2020 2025*
*According to current legislative status and energy supply requirements
** Including Datteln 4New investment opportunities for our brownfield sites
Uniper‘s power plant sites
Masterplan for
Scholven
follow-up solutions,
e.g. Maasvlakte 3, Ratcliffe
Wilhelmshaven
Heyden
Maasvlakte
Datteln
Site conversion
Scholven to industrial hubs,
Ratcliffe Staudinger e.g. Staudinger
Site conversion to gas-fired
Coal power plant sites plants, e.g. Scholven
Other brownfield sitesUniper‘s new strategy – Clear transition agenda
Coal generation Gas generation & mid-stream Carbon-free generation
Clear exit path for Europe, Expand & decarbonize Maintain & expand
site conversion and/or
optimization
Proactive transformation Leverage current portfolio New BusinessEurope natural gas supply and demand
Billion cubic meters
Imports
Long-term pipeline
contracts
European production
2020
532 bcm
43.6% 38.3%
18.1%
Source: World Energy Outlook 2019Europe natural gas supply and demand
Billion cubic meters
Imports
Long-term pipeline
contracts
European production
2040
538 bcm
37.4% 30.3%
32.3%
Source: World Energy Outlook 2019
14.2pp
+With LTC for~400 TWh one of the biggest gas importers in Europe With ~8 bcm biggest gas storage operator in Germany Pioneer in Power-to-Gas technology
Gas as key enabler of the energy transition

                       Sales business                       Gas fleet,
                         ~300 TWh                      contracts with TSOs

       Industrial                                                                 Power-2-Gas
       Customer                                                                    Power-2-X
     Solutions, CHP

                                                                       Gas LTCs
         Gas Storage                                                   ~400 TWh
           ~8 bcm                       LNG Supply
                                        ~35 TWh p.a.
Uniper ready to scale up hydrogen and for sector coupling
WindGas WindGas Reallabor Uniper installed
Falkenhagen Hamburg Bad Lauchstädt gas turbines
2013 2015 2019 H2
Start of operation Start of operation Start of planning compatible
2018
Addition of methanization
plant
PRODUCTION TRANSPORT INDUSTRY POWER
H2 injection into H2 injection into Shaping a (green) GENERATION
gas distribution gas distribution H2 economy in the Gas turbines
pipeline pipeline Central German hydrogen
Chemical Triangle compatibleH2
Industry partners Customers
Strictly
confidential
Governments / Investors
SocietyUniper‘s new strategy – Clear transition agenda
Coal generation Gas generation & mid-stream Carbon-free generation
Clear exit path for Europe Expand & decarbonize Maintain & expand
and conversion as well as
optimization
Proactive transformation Leverage current portfolio New BusinessBusiness areas for CO2 free production
Maintain Expand
Subsidy-free market in Europe offers Developers
growth opportunities for Uniper in area of PPA & Producers
GW 2020 2025 2030
30
1.4 GW
20
10
Customers
3.6 GW 0
Subsidy-free solar Subsidy-free Subsidy-free
onshore offshore
Source: Aurora Energy ResearchKeeping dividends – shift towards new growth
Dividends
2017-2019 2020
Legacy growth
& maintenance
New GrowthInvestment policy revised – Focused growth
Investment plan FY 2020 - 2022: €2.7bn Growth capex: >€1.5bn with clear focus
M€
1200
900
~25% ~75%
€0.3bn: Legacy €1.2bn: New growth
600 growth projects projects
Datteln 4 Irsching 6
Berezovskaya 3 Scholven
300 Russian modernization
UK grid stability project
Brownfield development
0 Green power & gas
2018 2019 2020E 2021E 2022E
Maintenance capex Legacy growth capex New growth capex
Financial Update 33Future investment criteria
Fit with our expertise/
core business/ markets
Business case/ revenue/
earnings contribution
CO2
Contribution to our
decarboniziation targetIt’s all about our people
Ratcliffe academy alone approx. per year:

600          4000                 80 new
courses      people trained       apprentices
Creating value   Reducing CO2   Providing
                                more energy

                        CO2
Thank you
Q&A
You can also read


