HALCYON TECHNOLOGY PLC. 'HTECH' - OPPORTUNITY DAY Q1/2021 - IR Plus

 
CONTINUE READING
HALCYON TECHNOLOGY PLC. 'HTECH' - OPPORTUNITY DAY Q1/2021 - IR Plus
HALCYON TECHNOLOGY PLC.
'HTECH'
OPPORTUNITY DAY Q1/2021
HALCYON TECHNOLOGY PLC. 'HTECH' - OPPORTUNITY DAY Q1/2021 - IR Plus
PART 1
           Halcyon Company Background

Table of
           PART 2
           Halcyon Group Performance
           Q1/2021

Contents   PART 3
           Market & Outlook
HALCYON TECHNOLOGY PLC. 'HTECH' - OPPORTUNITY DAY Q1/2021 - IR Plus
Part 1

Halcyon
Company
Background
HALCYON TECHNOLOGY PLC. 'HTECH' - OPPORTUNITY DAY Q1/2021 - IR Plus
Our Business
                                     New items
Halcyon is a cutting tool solution
                                                   Customer
provider. We are a companion to                  Requirements        Product
                                                                     Design
  our customers to help them
achieve highest productivity with           Trouble-
                                                          One-Stop
                                                           Service
        great efficiency.                   Shooting
                                                                      Manufacture

                                                         Test &
                                                       Application
HALCYON TECHNOLOGY PLC. 'HTECH' - OPPORTUNITY DAY Q1/2021 - IR Plus
Our History
 Since 1993 - Present

  1993                      2002                    2009            2010           2015              2017                    2020

Halcyon Metal Co.,         Halcyon Technology                       Expanded across Southeast   2nd factory building at   Acquired
Ltd. first established     Co., Ltd. established                    Asia in Philippines,        headquarter               manufacturing
as a manufacturing         for new segment of                       Singapore, Malaysia,        (Bangkok) and new         company in USA to
shop for jigs & fixtures   PCD cutting tools at    IPO under        Vietnam, Indonesia          factory in Hanoi;         expand distribution
and other metal            current location in     symbol “HTECH”                               consolidated revenue      and servicing network,
fabricated products        Minburi, Bangkok, TH                                                 reached 1 billion THB     as well as gain
                                                                                                                          exposure to new
                                                                                                                          technologies

                                                                                                         1BN
HALCYON TECHNOLOGY PLC. 'HTECH' - OPPORTUNITY DAY Q1/2021 - IR Plus
Our Global Network
                                           Manufacturing
                                           Distributing

• 3 manufacturing plants
• Sales and service offices in
  7 countries across the world
• Customers in 16 countries
HALCYON TECHNOLOGY PLC. 'HTECH' - OPPORTUNITY DAY Q1/2021 - IR Plus
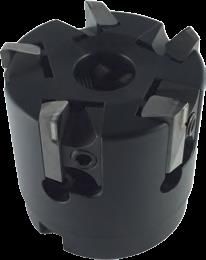
Our Products

PCD                                           MCD                                           PCBN                                          CARBIDE
Polycrystalline Diamond                       Monocrystalline Diamond                       Polycrystalline-Cubic Boron Nitride           Tungsten Carbide

Applications: Cutting non-ferrous materials   Applications: Super-finishing and critical    Applications: cutting super-hard materials    Applications: General purpose cutting

Materials: aluminum, brass, copper, CFRP,     applications                                  Materials: cast iron, hardened steels         Materials: Steel, aluminum, plastic,
abrasive materials, wood, plastics, etc.      Materials: brass, copper, aluminum, acrylic   (>50 HRc), sintered powder, etc.              wood, etc.
Industry: HDD, Automotive, Aerospace,         Industry: Lens, Jewelry, Watch, Automotive    Industry: Automotive, Heavy machinery, etc.   Industry: Used in most industries
Medical, Jewelry, Oil & Gas, etc.
HALCYON TECHNOLOGY PLC. 'HTECH' - OPPORTUNITY DAY Q1/2021 - IR Plus
Our Customer Sector in 2020
                                     Other
• More than 2/3 of our                24%
  demand comes from HDD
  and Automotive sectors                         HDD
• 1/4 is from other sectors                      40%
  such as Aerospace, Heavy
  machinery, Oil & Gas, Lens,   Trading
  etc.                            5%

                                    Automotive
                                        31%
HALCYON TECHNOLOGY PLC. 'HTECH' - OPPORTUNITY DAY Q1/2021 - IR Plus
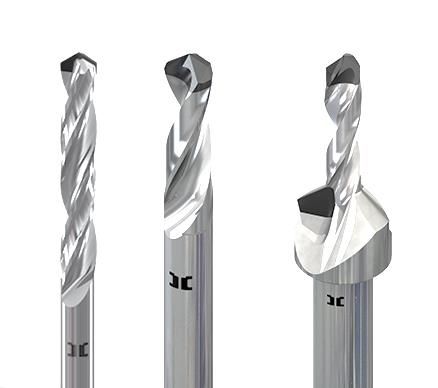
Part 2

Our
Performance
Q1/2021
HALCYON TECHNOLOGY PLC. 'HTECH' - OPPORTUNITY DAY Q1/2021 - IR Plus
Yearly Performance
         Decent outcome in 2020 despite COVID-19 with growing overseas sales

                              Sales Revenue                                    Gross Profit & Margin                                           Thailand vs. Overseas Sales
               1,200                                                   800                                                        50%   100%
THB Millions

                                                        THB Millions
                                                                       700                                                        45%
               1,000                 ▼1.4%                                                                                                       33%
                                                                                                                         38.4%          80%                        39%               44%
                                                                       600                                                        40%
                800                                                                                 33.2%
                                                                       500   30.8%                                                35%   60%
                600                                                    400                                                        30%
                                                                                                    ▲6.2%
                        962           949                              300                                                        25%   40%
                400                                                                                                                              67%
                                                                                                                                                                   61%               56%
                                                                       200                                                        20%
                                                                              297                    315                                20%
                200
                                                252                    100                                                        15%
                                                                                                                           97
                  0                                                      0                                                        10%    0%
                       Y2019         Y2020    Q1/2021                        Y2019                  Y2020              Q1/2021                  Y2019          Y2020                Q1/2021
                                                                                     Gross Profit           Gross Profit Margin                         Thailand         Overseas

          • -1.4% YoY in 2020                                  • Continuously improving                                                  • Larger portion of overseas
          • Q1/2021 pro-rata sees ~6%                            margins due to cost-reducing                                              sales from new subsidiary
            growth from Y2020                                    measures from first outbreak of                                           MDP (USA)
                                                                 COVID-19 in Thailand
Quarterly Performance
        Continuously improving margins from Q2/20 onwards

                             Sales Revenue                                                 Gross Profit & Margin                                                              Net Profit & Margin
               300                                                           160                                                            45%                  100                                           17.0%    20%
                                                                                                                                    38.4%

                                                                                                                                                  THB Millions
                                                                                                                      37.9%
THB Millions

                                                              THB Millions
                                                                                                                                                                 90
                                                                             140                           35.1%                            40%                                                                         15%
               250
                                                                                                                                                                 80    9.3%                 9.4%     9.1%
                                                                             120   29.9%                                                    35%                                                                         10%
                                                                                              28.4%                                                              70
               200                                                                                                                          30%                                  3.2%
                                                                             100                                                                                 60                                                     5%
                                                                                                                                            25%
               150                                                           80                                                                                  50                                                     0%
                                               275
                                       239             252                                                                                  20%
                      230                                                                                                                                        40
               100             203                                           60
                                                                                                                       104                  15%
                                                                                                                                                                                                                        -5%
                                                                                                                                     97                          30
                                                                                                            84
                                                                             40
                                                                                    69                                                      10%                                                                    45   -10%
               50                                                                                58                                                              20
                                                                             20                                                             5%                   10     22                   22       25                -15%
                 0                                                                                                                                                                 6
                                                                              0                                                             0%                    0                                                     -20%
                     Q1/20    Q2/20   Q3/20   Q4/20   Q1/21                        Q1/20       Q2/20       Q3/20      Q4/20         Q1/21                              Q1/20     Q2/20      Q3/20   Q4/20      Q1/21
                                                                                            Gross Profit      Gross Profit Margin                                              Net Profit      Net Profit Margin

         • Overall declined in Q2/20 from                               • Continuously improving gross                                               • NPM jumped to 17% in Q1/21
           COVID-19, but had additional                                   margins                                                                      mainly due to MDP’s loan
           sales from MDP to support                                       • New subsidiary MDP (USA)                                                  forgiveness of THB 8.2 million
         • Sales picked up in Q3-4/20                                        since Q2/20                                                               (without this effect, NPM ~13%)
           due to higher demand from                                       • Closing of Philippines
           HDD sector                                                        factory - reduction in labor
                                                                             and overhead costs
Performance by Segment (Q1 YoY)
            Special Cutting Tools segment shows high growth from previous year, while other
            segments are still recovering

                                              Special Cutting Tools                           Standard Cutting Tools                             Metal Fabrication
                                                    (HT, HP, HV, MDP)                            (FDM, HENG, HS, HY, HI)                               (HM)
                               160                                      ▲41.3%
Sales Revenue
                THB Millions

                               120
                                                                                                                           ▼9.6%
                                80                                       152.7
                                            108.0                                      101.7                                91.9                                     ▼62.5%
                                40                                                                                                       20.7
                                                                                                                                                                      7.8
                                    0
                                            Q1/20                        Q1/21         Q1/20                                Q1/21        Q1/20                        Q1/21

                                                                        ▲224%
                               40
Net Profit
                THB Millions

                               20                                                                                          ▼14.2%
                                                                        37.1                                                                                         ▼54.1%
                                                                                        7.3                                 6.3
                                            11.5                                                                                          3.3                         1.5
                                0
                                            Q1/20                       Q1/21          Q1/20                               Q1/21         Q1/20                        Q1/21

                                    • Additional revenue/profit from             • Revenue from 5 trading                           • Revenue from Halcyon Metal only
                                      MDP (USA) in Q1/21                           companies (customers mainly                      • Major overseas customer in
                                    • Without MDP, this segment still              in automotive sector)                              aerospace sector – heavily
                                      had +5% sales growth and                                                                        affected by COVID-19
                                      +112% NP                                                                                      • Starting to pick up in March’21
Part 3

Market &
Outlook
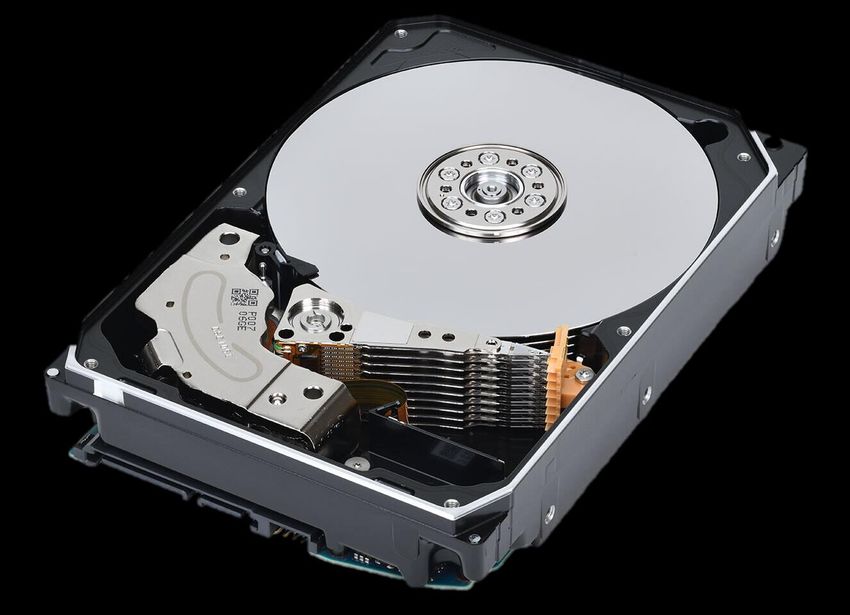
HDD Market in Thailand
Thailand is the leading exporter of HDD

  • HDD is an essential part of the global computer supply chain
    due to continuous foreign investments in the country
     • Requires technology and skilled workers
     • 90-95% HDD produced in Thailand are for exports
     • Almost 30% of Thailand’s electronics export value

Source: Krungsri Research
Data Storage Demand
Data storage demand is increasing exponentially due to cloud technology and IoT

                     World Capacity Shipments
                           (2020-2025 Projection)
Exabytes shipped

                                                    • Demand for data storage continues to increase
                                                      at 32.2% CAGR from 2021-2026
                                                    • High adoption rate of cloud technology and IoT
                                                       ⚬ Consumer Electronics: smartphone, laptops,
                                                          PCs, video games, VR/AR, AI
                                                       ⚬ Enterprise: nearline storage, and data centers

Source: Coughlin (Forbes, 29 May 2020)
HDD Demand
High-capacity HDD leads the demand growth

             • Number of pieces of HDD shipped will        • “Consumer” HHD will decrease and switch to
               increase at a slower rate due to advances     SSD for smaller units
               in technology for data storage density      • “Enterprise” HDD will increase from nearline
             • 9.3% CAGR for server application              data storage
               (2019-2026)                                 • Cryptocurrency farming?
Source: Coughlin (Forbes, 29 May 2020)
Automotive & EV Market Overview
Automotive sector is steadily recovering. EV disruption will not be significant in the
next 5 years

                                                   • New projects and improvement trials are
                                                     being implemented for mass production
                                                   • New projects for EV parts are starting to
                                                     emerge in Thailand
                                                   • EV brings more demand for materials with
                                                     high strength-to-weight ratio; usually
                                                     requires PCD cutting tools
                                                   • Automotive industry in Thailand will persist
                                                     in the next 5 years as infrastructure and
                                                     costs must be advantageous for the
                                                     feasibility of EV

Source: ING Economics Department
+7% Target sales
                 growth in 2021

                                          Recovery after the
                                          pandemic
                                          In all manufacturing industries

Operating
                                          in ASEAN and North America
             Increase capacity in

 Plans for
                Halcyon Vietnam
             HV has potentials for high

2021-2022
             growth and opportunities
              but currently has limited
                  production capacity
                                          New production line
                                          in USA (MDP)
                                          Synergies allow for increased
                                          competitiveness in the North
                                          American market
Thank you!
Q&A
You can also read