Getting stronger, ECONOMIC OUTLOOK - but tensions are rising - Aran
←
→
Page content transcription
If your browser does not render page correctly, please read the page content below
OECD INTERIM
                          ECONOMIC OUTLOOK

                   Getting stronger,
                 but tensions are rising
                                       13 March 2018

                                  Álvaro Pereira
                         OECD Acting Chief Economist

http://www.oecd.org/eco/outlook/economic-outlook/
ECOSCOPE blog: oecdecoscope.wordpress.com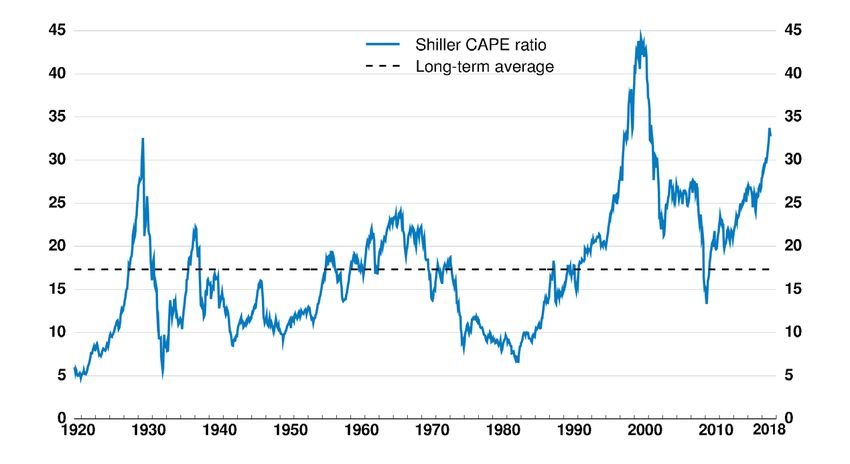
Key messages

• The expansion is set to continue and strengthen
• Trade and private investment are bouncing back
• New fiscal stimulus in the United States and Germany will
  further boost short-term growth
• Inflation is set to rise slowly
• Interest rate normalisation may create tensions, with high
  debt and asset prices key vulnerabilities
• An escalation of trade tensions would be damaging for
  growth and jobs
• Structural and fiscal policies should focus on improving
  medium-term inclusive growth
                                                               2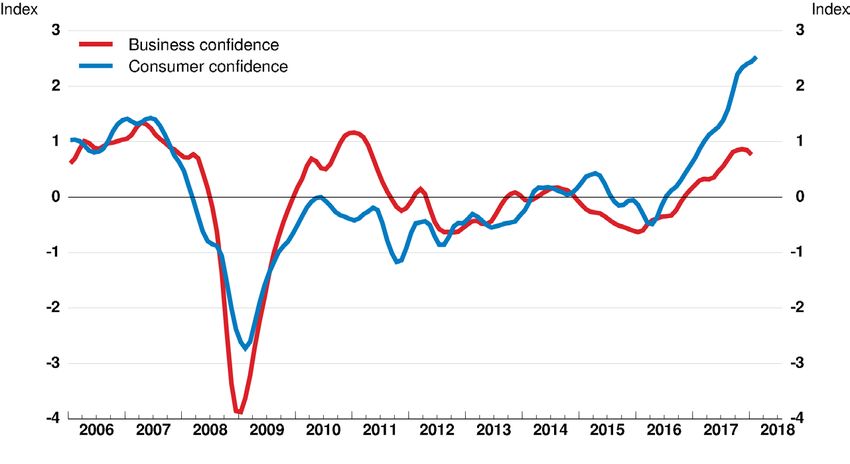
The expansion is set to continue

                                                        GDP growth
                      Advanced economies                                    Emerging market economies

Note: GDP in volume. Fiscal years starting in April for India. The G20 aggregate does not include EU countries that are not
G20 members in own right. G20 emerging includes Argentina, Brazil, China, India, Indonesia, Mexico, Russia, Saudi Arabia,
Turkey and South Africa, and G20 advanced included other G20 economies. 2017 is actual data or latest estimates.              3
Source: OECD Economic Outlook database.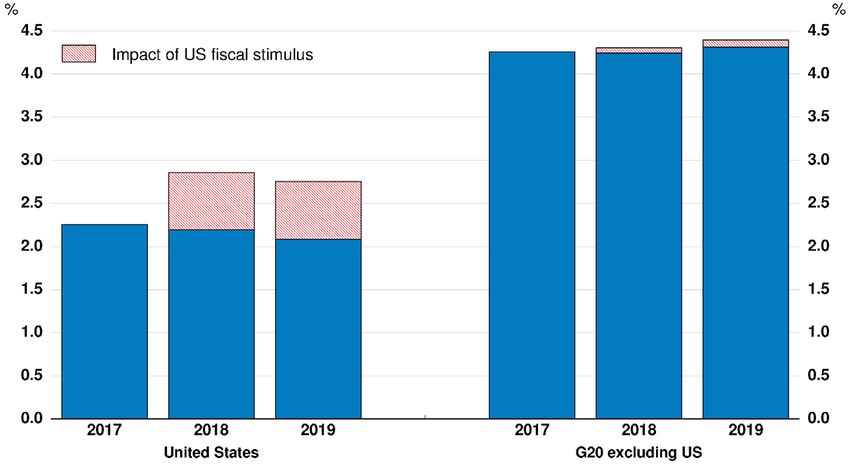
OECD Interim Economic Outlook projections

                                                        GDP growth
                    Year-on-year, %. Arrows indicate the direction of revisions since November 2017
                          2017           2018           2019                              2017           2018           2019

World                      3.7            3.9           3.9            G20                 3.8            4.1           4.0

Australia                  2.3            3.0           3.0            Argentina           2.9            3.2 =         3.2    =
Canada                     3.0            2.2           2.0            Brazil              1.0            2.2           2.4
Euro area                  2.5            2.3           2.1            China               6.9            6.7           6.4    =
   Germany                 2.5            2.4           2.2            India1              6.6            7.2           7.5
   France                  2.0            2.2           1.9            Indonesia           5.1            5.3           5.4    =
   Italy                   1.5            1.5 =         1.3 =          Mexico              2.3            2.5           2.8
Japan                      1.7            1.5           1.1            Russia              1.5            1.8           1.5    =
Korea                      3.1            3.0 =         3.0 =          Saudi Arabia        -0.8           1.6 =         1.7    =
United Kingdom             1.7            1.3           1.1 =          South Africa        1.2            1.9           2.1
United States              2.3            2.9           2.8            Turkey              6.9            5.3           5.1

Note: GDP in volume. Difference in percentage points based on rounded figures. Dark green for upwards revision of 0.2
percentage points and more. The G20 aggregate does not include EU countries that are not G20 members in own right.             4
1. Fiscal years starting in April.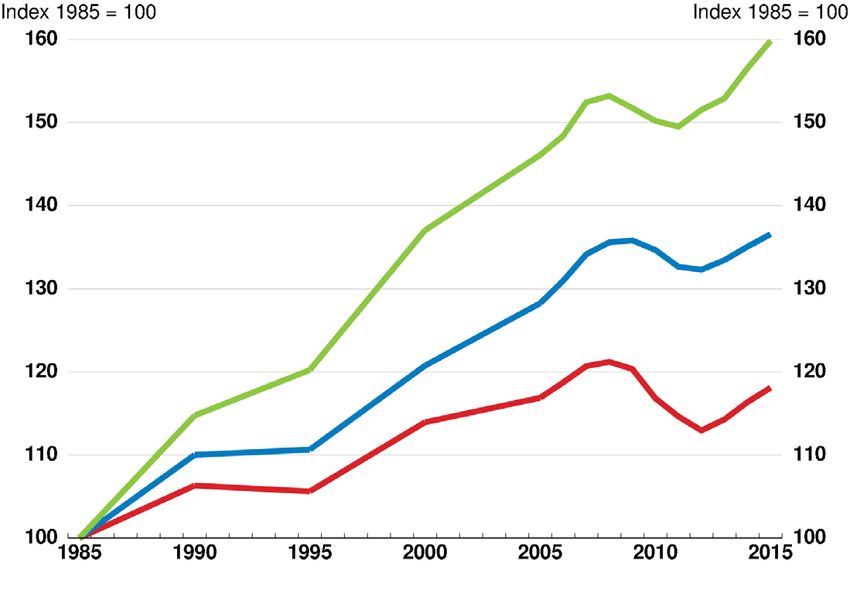
Confidence is buoyant

                    Consumer and business confidence, OECD and BRIICS

Note: Normalised values over the period 2006-2018, expressed in standard deviations.   5
Source: OECD Main Economic Indicators database; and OECD calculations.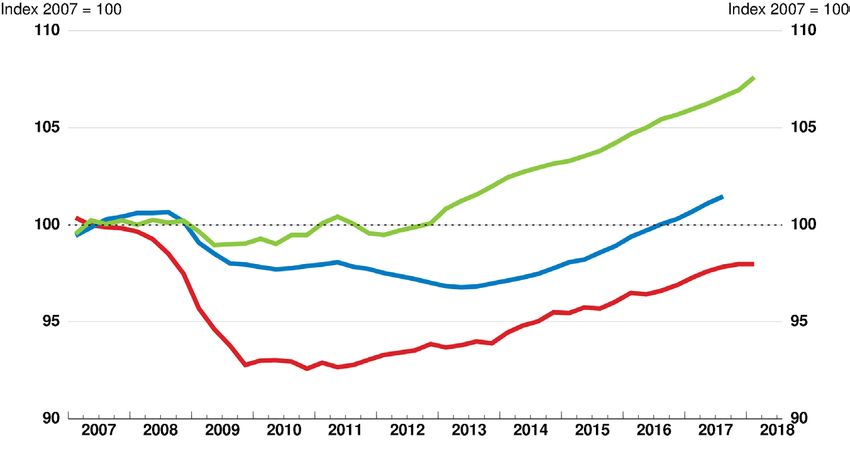
Trade growth bounced back in 2017

                                        Growth in global trade volumes

                                                                                                     2017: 5.2

Note: World trade is measured as goods and services trade volumes measured at market exchange rates in US dollars.   6
Source: OECD Economic Outlook database; and OECD calculations.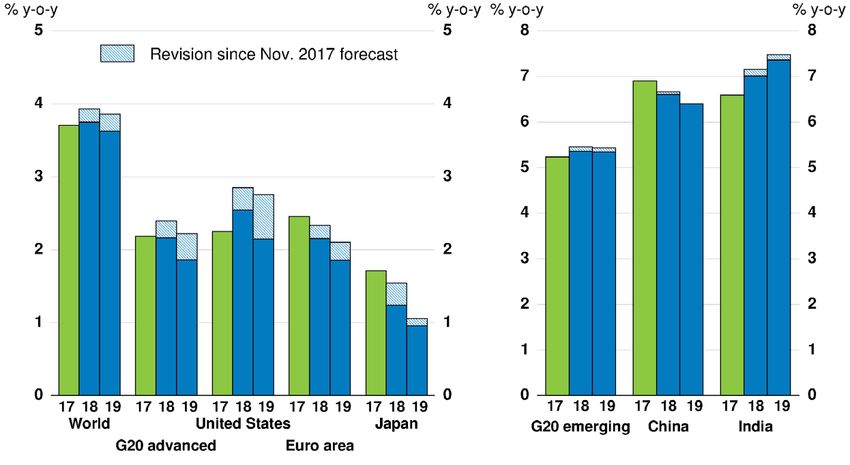
Investment is coming back

                                                  G20 investment growth
                                                Contributions by region, volume

Note: China and Saudi Arabia not included due to data unavailability. The euro area aggregate includes only Germany,
France and Italy.                                                                                                      7
Source: OECD Economic Outlook database; and OECD calculations.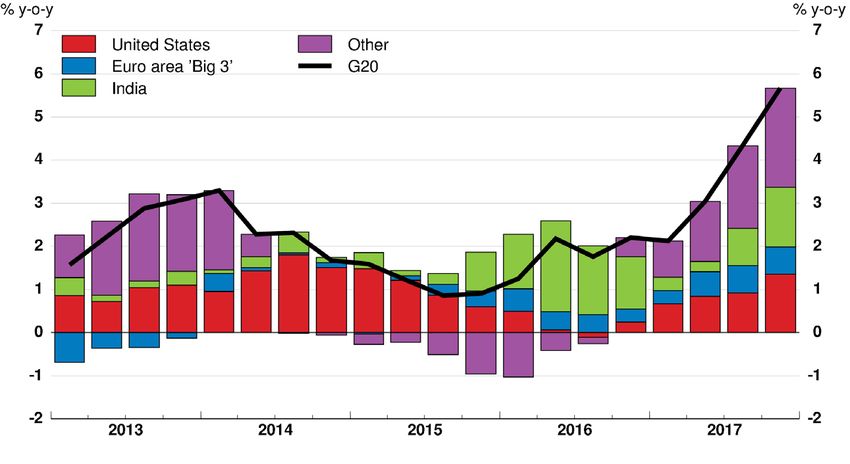
Labour markets are getting tighter

                                                 Employment rate

                                                                                          Japan

                                                                                         Euro area
                                                                  2007 employment rate

                                                                                         United States

Note: All persons aged 15-64 years.                                                                      8
Source: OECD Short-Term Labour Market statistics; and OECD calculations.
Income gains have been limited,
particularly for low-income households
Household real disposable income
OECD average
Top 10%
Median
Bottom 10%
Note: The OECD average is a simple average composed of the17 OECD member countries for which data is available
for the whole period. 9
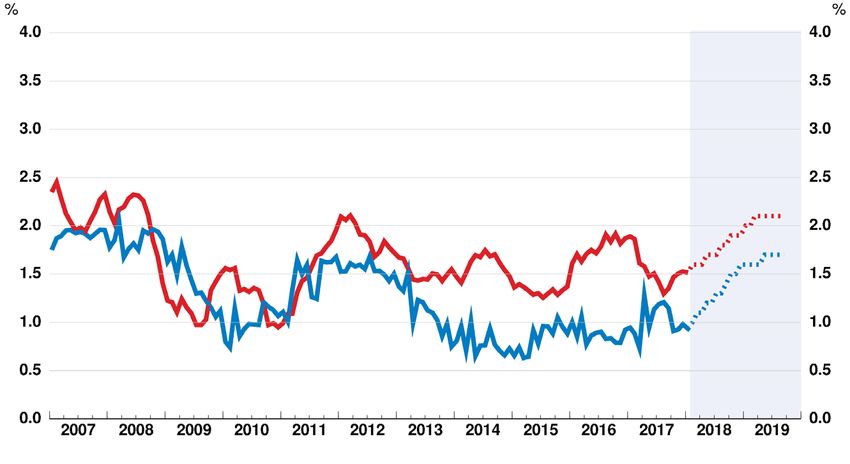
Source: OECD Income Distribution database; and OECD calculations.Inflation is likely to rise
Core inflation in advanced economies
Year-on-year
United States
Euro area
Note: Core inflation excludes energy and food products and refers to harmonised data for the euro area. 10
Source: OECD Economic Outlook database; Eurostat; and OECD calculations based on November 2017 EO projections.Fiscal policy has eased in major
advanced economies
Change in the fiscal stance in G7 countries
Note: Loosening and tightening indicate respectively a negative and a positive change in the underlying government
primary balance in % of GDP. 11
Source: OECD Economic Outlook database; and OECD calculations.US tax cuts and new spending
will stimulate short-term growth
Growth effect of US fiscal stimulus
GDP growth, year-on-year
Note: GDP growth in volume.
Source: OECD simulation using the NiGEM global macroeconomic model, UK National Institute of Economic and Social 12
Research; and OECD Economic Outlook database.Monetary policy will gradually tighten,
albeit at different speeds
Yield curve for government bonds
United States Euro area Japan
Note: Yield curves on benchmark government debt as of 9 March 2018. 13
Source: Thomson Reuters and ECB.An escalation of trade tensions
would hurt growth and jobs
Global export volume
Avoid escalation and rely on
global solutions to solve steel
excess capacity
Safeguarding the rules-based
international trading system is
key
Note: Goods and services exports measured at
market exchange rates, at 2010 prices. 14
Source: OECD Economic Outlook database.High public and private debt
create risks
G20 total debt
Public and private non-financial sector
Note: Debt of general government and the non-financial private sector expressed as per cent of GDP weighted by nominal
GDP at PPP exchange rates. G20 Advanced comprises Australia, Canada, France, Germany, Italy, Japan, Korea, the United
Kingdom and the United States. G20 Emerging comprises Argentina, Brazil, India, Indonesia, Mexico, Russia, Saudi Arabia,
South Africa and Turkey. Data as of Q2 2017. 15
Source: BIS; OECD Economic Outlook database; and OECD calculations.Stock valuations remain high
despite recent turbulence
S&P 500 Price-Earnings ratio
Cyclically adjusted
Note: The Cyclically Adjusted Price-to-Earnings ratio (CAPE) is obtained by dividing the S&P 500 index by a 10-year
moving average of earnings, adjusted for inflation. The long-term average is calculated over the 1920-2018 period.
CAPE ratio data as of March 2018. 16
Source: Robert J. Shiller; and OECD calculations.The pace of structural reform is slow,
with some exceptions
Responsiveness rates to Going for Growth recommendations
Fully coloured bars refer to the share of fully implemented reforms
In process of In process of
implementation implementation
Note: The estimated take-up of reforms is captured by the Going for Growth indicator of reform responsiveness. For 2017, reforms
in the process of implementation are shown to ensure comparability with previous two-year periods. Emerging market economies
include Argentina, Brazil, Chile, China, Colombia, Costa Rica, Indonesia, India, Mexico, Russia, Turkey and South Africa.
Advanced economies include all non-emerging OECD member countries and Lithuania. 17
Source: OECD Going for Growth 2018 (forthcoming).Reform progress is slow on tax and skills
Take-up of reforms by area
Share of Going for Growth recommendations implemented
% Higher reform
intensity
Lower reform
% intensity
Note: Selection of the reform areas with the largest number of recommendations. Infrastructure includes physical and legal
infrastructure. Job specific education includes higher education, vocational education and training. General education
includes primary and secondary education. 18
Source: OECD Going for Growth 2018 (forthcoming).Key messages
The expansion continues
• Growth is improving or steady in most G20 economies
• Trade and private investment are bouncing back
• New fiscal stimulus in the United States and Germany will further boost short-term growth
• Inflation is set to rise slowly
Tensions are rising
• Monetary policy in advanced economies will gradually tighten, albeit at different speeds
• High debt and high asset valuations are key vulnerabilities
• An escalation of trade tensions would be damaging for growth and jobs
Structural and fiscal policies should focus on medium-term prospects
• The pace of structural reform is slow, including to improve skills
• The fiscal stance should support but not overstimulate demand
• Changes in the tax and spending mix would boost long-term inclusive growth
19You can also read