FY 2018 Results - De'Longhi Group
←
→
Page content transcription
If your browser does not render page correctly, please read the page content below
FY 2018 Results
FY 2018 RESULTS (“continuing operations”)

Definitions & assumptions

In this presentation:
• Continuing Operations identify the consolidated perimeter excluding NPE s.r.l.;
• ForEx or FX stand for Foreign Exchange Rates;
• Organic stands for effect net of ForEx and hedging derivatives;
• Adjusted stands for “before non recurring items and inputed costs of the stock option plan”
• Q4 stands for fourth quarter (October1st – December 31st), FY stands for full year
  (January 1st – December 31st);
• “M” stands for million and “bn” stands for billion.

                                                                                           2
CONTENTS

•   FY 2018 Results

•   Outlook FY 2019

•   Appendix
FY 2018 RESULTS (“continuing operations”)
HIGHLIGHTS
In the FY 2018:
Revenues up 5.4% to € 2,078.4 million (+ 8.4% organic), driven by coffee makers
(+13.8% organic);
Adjusted EBITDA up to € 312,8 million equal to 15.1% of revenues , but in organic
terms at 15,2% as in 2017;
Net Financial Position positive to € 228.1 M, after dividends paid of € 149.5 M and
capex of € 66.4 million;
as expected, profitability impacted by some headwinds like the increase of cost of
raw materials, pressure on prices and currencies’ volatility.
In Q4:
at constant exchange rates, adjusted EBITDA margin stood to 20,1% in line with
the previous year.
4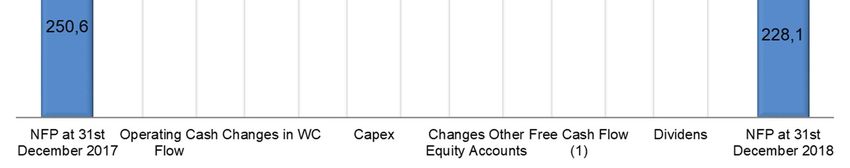
FY 2018 RESULTS (“continuing operations”)
SALES AND NET INDUSTRIAL MARGIN
FY 18 FY 17 Change Change %
Revenues 2,078.4 1,972.8 105.6 5.4%
net industrial margin 990.7 967.3 23.4 2.4%
% of revenues 47.7% 49.0% bps -136.7
+8,4% organic FY,
+7,4% organic 4Q
The FY18 revenues grew by 5.4%, but in organic terms the expansion has been +8.4%;
the growth dynamics of the last quarter were confirming the previous trends, with coffee
makers sustaining the overall growth;
the net industrial margin was under pressure due to higher raw material prices (as
expected), currency headwinds and pressure on prices due to a tough competitive
scenario.
5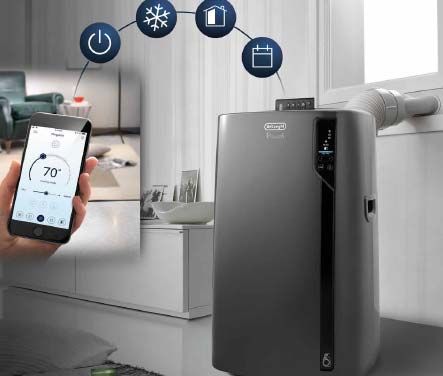
FY 2018 RESULTS (“continuing operations”)
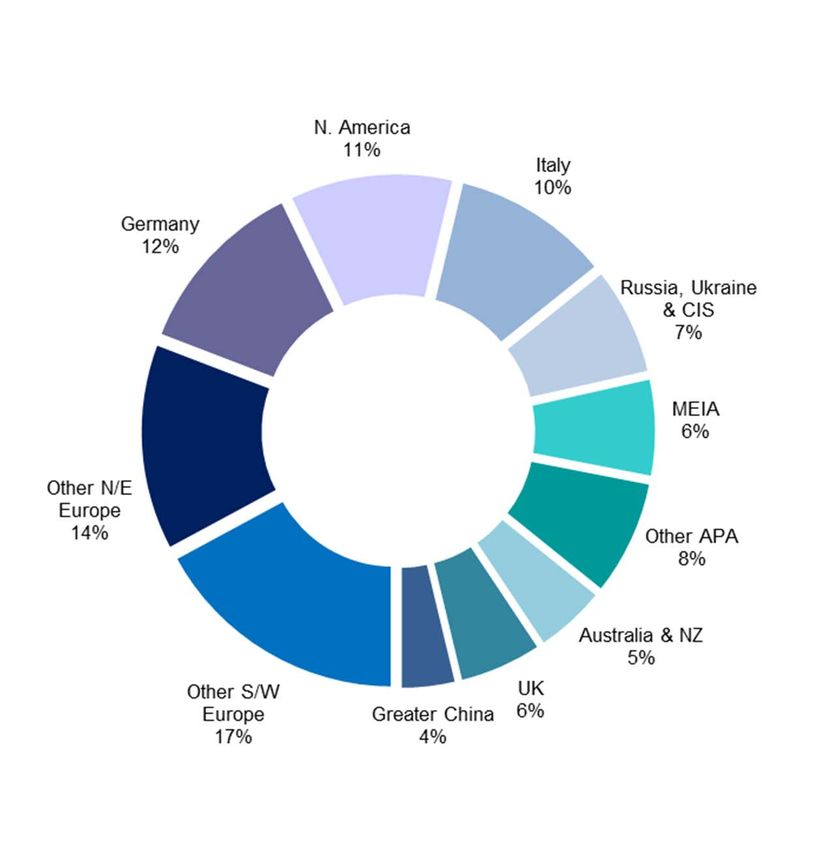
REVENUES BREAKDOWN BY MARKET
FY 2018 FY 2018:
MAIN ORGANIC UPS & DOWNS
• US & Canada
GROWING
• Russia, Ukr. & CIS
DOUBLE DIGIT
• Poland
• Germany
GROWING
• Greater China
SINGLE DIGIT
• Japan
• Italy
• Spain & Portugal
DOWN
• South Africa
• Brazil
6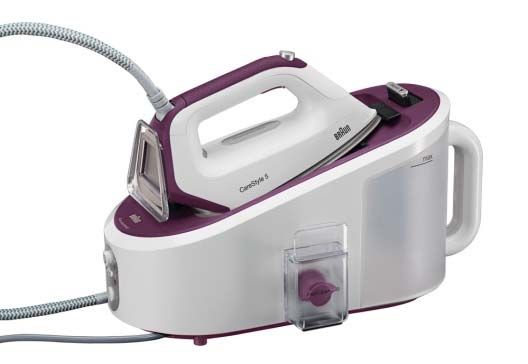
FY 2018 RESULTS (“continuing operations”)
REVENUES BREAKDOWN BY MARKET
Revenues of the "continuing operations"
12 months organic chg. 4th Quarter organic chg.
E UR million chg. % chg. %
2018 % 2018 %
S outh Wes t E urope 824.1 1.7% 2.4% 303.5 0.3% 0.8%
North E as t E urope 552.3 7.5% 12.4% 225.1 5.7% 9.7%
E UR OP E 1,376.4 3.9% 6.3% 528.6 2.5% 4.5%
AP A (Asia/P acific/Americas) 566.0 8.7% 13.0% 208.1 12.6% 13.2%
ME IA (MiddleE ast/India/Africa) 136.0 6.3% 10.9% 41.5 21.3% 19.6%
T OT AL R E VE NUE S 2,078.4 5.4% 8.4% 778.1 5.9% 7.4%
South-West Europe: Germany and Austria have sustained the growth, while the trend in
some of Mediterranean countries showed some weakness;
North-East Europe: up double digit at an organic level, with strong Russia, Poland and
eastern Europe countries; in the Q4 we highlight a recovery in UK and some weakness of
Nordics;
APA: double digit growth in organic terms, remarkable increase of sales in US & Canada
(now second market of the Group), jointly with a good expansion in Asia;
MEIA: continuous recovery in Q4 , thanks to the recovery in UAE.
7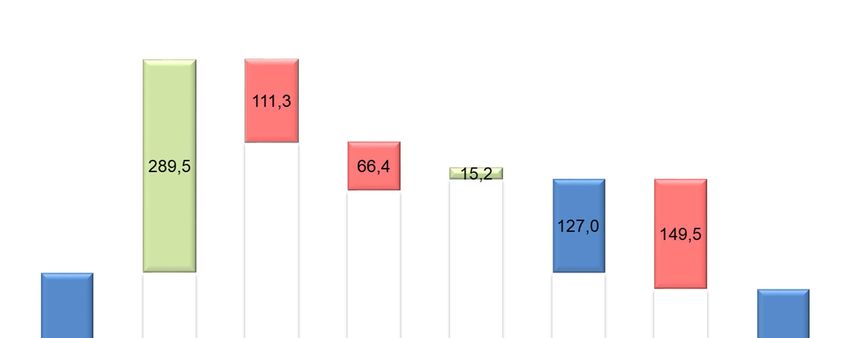
FY 2018 RESULTS (“continuing operations”)
REVENUES BREAKDOWN BY PRODUCT

              FY 2018 sales breakdown by product                 FY 2018:
                                                         MAIN ORGANIC UPS & DOWNS

  Coffee
  Makers                                  Cooking &
   47%                                    Food Prep.
                                                                      • Full Auto coffe maker
                                             30%       GROWING
                                                                      • Lattissima
                                                       DOUBLE DIGIT
                                                                      • Comfort products

                                                                      • Kitchen machines
                                                       GROWING
                                                                      • Hand blenders
                                                       SINGLE DIGIT
                                                                      • Pump coffee makers

                                                                      • Water kettles
                                                       DOWN           • Spin juicers
                                         Comfort &                    • Toasters
                                         Home care
                                           17%
                                Others
                                 6%

 Based on management accounts

                                                                                          8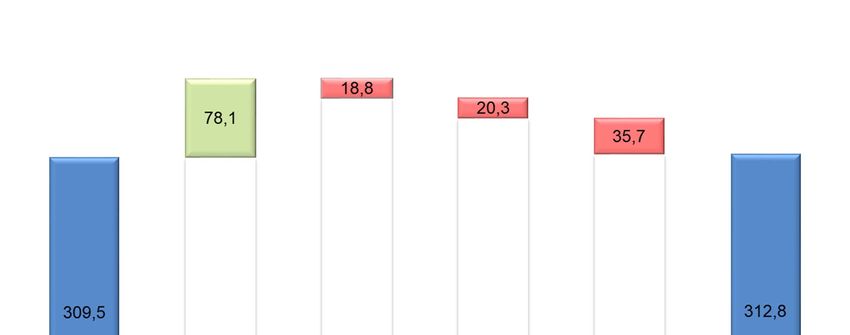
FY 2018 RESULTS (“continuing operations”)
REVENUES BREAKDOWN BY PRODUCT

                                                                       COFFEE MAKERS
                                                                     Others
                                                                     coffee
                                                                      2%
                                                          Capsules
         o   In the coffee segment, all categories        machines
                                                            14%
             have grown, except for Dolce Gusto
             (down double digit):
         in organic terms:                             Pump
                                                      Machines
         o   full auto up double digit, both in the     6%
             Q4 and over 12months;
         o   traditional pump up high single digit;
         o   Lattissima Nespresso up double
             digit in the FY18.
                                                         FullAuto
                                                          26%

 Based on management accounts

                                                                                       9
FY 2018 RESULTS (“continuing operations”)
REVENUES BREAKDOWN BY PRODUCT

                                                   COOKING & FOOD PREPARATION
                                                               Kitchen
                                                              Machines   Food
                                                                10%    Processor
                                                                          2%      Hand
                                                                               Blenders &
                                                                                  Blen.
                                                                                   7%
         In organic terms:                                                            Others
         o   the whole segment was only slightly                                     Kitchen
                                                                                    appliances
             negative yoy, but with a persistent
                                                                                       11%
             weakness of the foodpreparation
             global market (GFK data);
         o   Kitchen machines branded Kenwood
             have shown signs of improvement in
             the last quarters.

 Based on management accounts

                                                                                     10
FY 2018 RESULTS (“continuing operations”)
REVENUES BREAKDOWN BY PRODUCT
COMFORT & HOME CARE
o The comfort segment (portable
heating, air conditiong and air
treatment) grew strongly over the
12months, helped by favorable
climate conditions;
o Braun’s irons were up, thanks to the
launch of the new steam generators
which grew double digit in Q4.
Comfort
12%
Home care
5%
Based on management accounts
11FY 2018 RESULTS (“continuing operations”)
EBITDA MARGINS AND NET PROFIT
FY 18 FY 17 Change Change %
adjusted EBITDA 312.8 309.5 3.3 1.1%
% of revenues 15.1% 15.7% bps -63.8
EBITDA 304.5 303.7 0.8 0.3%
% of revenues 14.7% 15.4% bps -74.3
Net profit 183.9 179.7 4.2 2.3%
% of revenues 8.8% 9.1% bps -26.3
adjusted Net profit 190.3 173.2 17.1 9.9%
% of revenues 9.2% 8.8% bps 37.7
The 2018 adjusted Ebitda was slightly up, but in organic terms the Group had a stable
margin vs last year both in the 4th quarter (20,1%) and in the full year (15,2%);
De’Longhi has increased promotional and support activities with the goal of ensuring
adequate visibility to our products;
the adjusted net profit (net of non recurring operating, financial items and tax effect)
accounted to € 190.3 million, up by 9.9% compared to 2017.
12FY 2018 RESULTS (“continuing operations”)
ADJUSTED EBITDA BRIDGE
13FY 2018 RESULTS (“continuing operations”)
NET FINANCIAL POSITION AND WORKING CAPITAL
FY 18 FY 17 Change
Net Working Capital 322.5 257.8 64.7
Net equity 1,065.9 1,023.3 42.6
Net debt / (Net cash) -228.1 -250.6 22.5
Net Deb / Ebitda (leverage) -0.7 -0.8
NWC / Revenues 15.5% 13.1% 245 bps
The net financial position as at December 31st was positive by 228.1 million €;
the cash flow from investments is equal to 66.4 million € lower than 2017;
the higher level of inventories, compared to the previous year, was due to an
anticipation of supplies to the North American market (in light of the expected rise in
duties on goods imported from China) as well as greater stocks of coffee makers to
meet the growth dynamics budgeted for the first quarters of the new year.
14FY 2018 RESULTS (“continuing operations”)
THE CASH FLOW PERFORMANCE
(1) Free Cash Flow before Dividends
15CONTENTS • FY 2018 Results • Outlook FY 2019 • Appendix
OUTLOOK FY19
COFFEE MAKERS: NEW PRODUCTS

       MAESTOSA                LA SPECIALISTA                 MULTISERVE

  Full auto coffee machine    Pump coffee machine          Drip coffee maker
   Key features: double      The “barista” experience    Preparation of multiple
   grinder, double boiler,            at home           coffee sizes, from single
        connectivity.                                     cup to full carafe, tea
                                                               preparation

                                                                             17
OUTLOOK FY19
COOKING & FOOD PREPARATION: NEW PRODUCTS
COOKEASY + CHEF XL SENSE IDEALFRY
Special Edition
Cooking food processor Kitchen machine Air Fryer
New connected all-in- Best performance with Great tasting fried food
one cooker enhanced design / Excellent cooking
finishing performance
18OUTLOOK FY19
COMFORT & HOME CARE: NEW PRODUCTS
PAC EL Wi-Fi NEW CARESTYLE 5 TASCIUGO ARIA
DRY PURE WiFi
Portable Air Condition. Steam Generator Irons Dehumidifier
First ever Pinguino wi-fi Excellent ergonomic 21l/d dehumidification
Working Smart Speakers design Certified
FastClean System Asthma&Allergy
Braun´s lightest iron Friendly
19OUTLOOK FY19
GUIDANCE
REVENUES ADJUSTED EBITDA
MID single digit Increase in absolute
organic growth terms
(1) Free Cash Flow before Dividends
20CONTENTS • FY 2018 Results • Outlook FY 2019 • Appendix
APPENDIX
KEY P&L FIGURES 2017-2018 («continuing operations»)

                            (Euro million)                       2017                                               2018
                                                                                        FULL                                               FULL
                                             Q1-17   Q2-17     H1      Q3-17   Q4-17             Q1-18   Q2-18    H1      Q3-18   Q4-18
                                                                                        YEAR                                               YEAR
                          Revenues 385.1             431.6    816.7    421.7   734.4 1,972.8 402.6       452.1   854.7    445.6   778.1 2,078.4
                       % change y-o-y        6.3%    4.2%     5.1%     8.7%    7.7%     6.8%     4.5%    4.7%    4.6%     5.7%    5.9%     5.4%
               net industrial margin 192.3           208.8    401.1    206.6   359.6    967.3    198.0   209.0   407.1    210.5   373.1    990.7
                                       %     49.9%   48.4%    49.1%    49.0%   49.0%    49.0%    49.2%   46.2%   47.6%    47.2%   48.0%    47.7%
                adjusted EBITDA              52.5    54.0     106.5    53.0    150.0    309.5    53.4    55.7    109.1    53.1    150.7    312.8
                                       %     13.6%   12.5%    13.0%    12.6%   20.4%    15.7%    13.3%   12.3%   12.8%    11.9%   19.4%    15.1%
                              EBITDA         51.6    53.0     104.7    50.5    148.5    303.7    52.4    52.6    105.0    52.1    147.4    304.5
                                       %     13.4%   12.3%    12.8%    12.0%   20.2%    15.4%    13.0%   11.6%   12.3%    11.7%   18.9%    14.7%
                                  EBIT       38.9    38.9     77.9     35.3    132.2    245.4    39.3    38.6    77.9     35.0    130.0    242.9
                                       %     10.1%   9.0%     9.5%     8.4%    18.0%    12.4%    9.7%    8.5%    9.1%     7.9%    16.7%    11.7%
                Profit before Taxes          32.9     43.7     76.6    32.9    119.7    229.2    32.2    36.6     68.8    30.0    125.0    223.9
                              Taxes          (7.4)   (11.7)   (19.1)   0.4     (30.8)   (49.5)   (5.8)   (7.1)   (12.9)   (4.0)   (23.1)   (40.0)
  Profit / (Loss) pertaining to the Group    25.5     32.0     57.5    33.3     88.9    179.7    26.4    29.5     55.9    26.0    101.9    183.9
                                       %     6.6%    7.4%     7.0%     7.9%    12.1%    9.1%     6.6%    6.5%    6.5%     5.8%    13.1%    8.8%

                                                                                                                                           22
THANK YOU Contacts: Investor Relations: Fabrizio Micheli / Samuele Chiodetto T: +39 0422 4131 investor.relations@delonghigroup.com
You can also read