Presentation Results Q3 2019 - Tadawul
←
→
Page content transcription
If your browser does not render page correctly, please read the page content below

Presentation Results Q3 2019

Disclaimer

Information contained in this presentation is subject to change without further notice.
Its accuracy is not guaranteed and it may not contain all material information
concerning the company. Neither we nor our advisors make any representation
regarding, and assume no responsibility or liability for, the accuracy or completeness
of, or any errors or omissions in, to any information contained herein.

In addition, the information may contain projections and forward-looking statements
that reflect the company’s current views with respect to future events and financial
performance. These views are based on current assumptions which are subject to
various risks and may change over time. No assurance can be given that future events
will occur, that projections will be achieved, or that the company’s assumptions are
correct. Actual results may differ materially from those projected.

This presentation is strictly not to be distributed without the explicit consent of L’azurde
for Jewelry Company management under any circumstances.

                                                                                          2
Agenda

                                Pages

1. Executive Summary               4

2. Business Model                 5-7

3. Group Key Initiatives         8-12

4. Results                      13-20

                                        3
Executive Summary

•   Q3 Operating Revenues were 11% higher than same quarter of LY. In KSA, Retail channel
    revenues increased by 78% mainly due to the recently acquired TOUS franchisee.
    Wholesale KSA revenues decreased by 44% compared to the same quarter last year
    due to high volatility in the gold price during this period which led to a temporary delay
    in buying decisions by our retailers and a very long summer break.
•   Egypt’s revenues continued to perform strongly, for the eighth quarter in a row, with a
    growth of 19% in the wholesale channel due to successful advertising campaigns and
    strong customer uptake of new collections. The retail channel revenues grew by 24.5%
    compared to the same quarter of last year due to the sales increase in existing shops
    and the successful opening of four new outlets.
•   This is the sixth quarter in a row with operating revenues exceeding the same quarter of
    last year.
•   Net income for Q3 2019 came at SAR 0.2 Million, 93% lower than same quarter LY due to
    due to lower revenues in KSA wholesale. YTD net income is at SAR24.4 Million, up +38.6%
    versus same period last year.
•   The Company has a major growth initiative with the new Miss L’ line offering affordable
    Gold fashion jewelry at high Gross Margin and low Working Capital sold through 3rd party
    retailers in Malls.
•   We undertake a significant repositioning in Q4 where we will restructure the core Gold
    wholesale business at much lower costs and Working Capital while securing the right
    resources on growing more efficient businesses like TOUS, Miss L’ and E-commerce.

                                                                                            4
L’azurde Business Model Evolution

                                               L’azurde House of
                                                   Key Brands
                                               Gold Wholesale Business
                           L’azurde
                           Jewelry                      TOUS
                         Gold Wholesale
                            Business                L’azurde retail
L’azurde    Jewelry
                       L’azurde Mono Brand             Miss L’
   Gold Wholesale     diamond jewelry retail
      Business
                                                Kenaz Value Diamonds
                                                   jewelry (Kiosks)

                                                                         5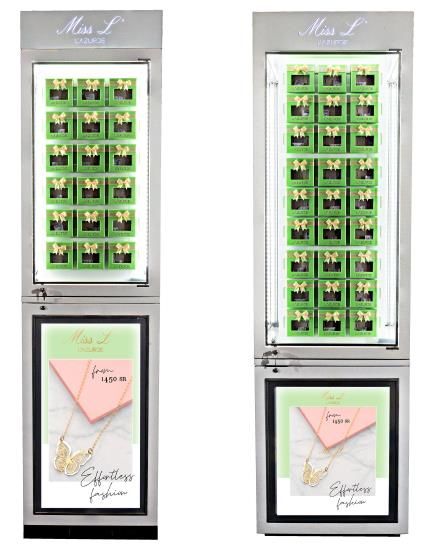
L’azurde Business Model Evolution

                              L’AZURDE
                              GROUP

Wholesale                       Retail                         Miss L’

                L’AZURDE
- 18K                            TOUS          KENAZ        Malls Wholesale
               20 Locations
- 21K                         26 Locations   12 Locations   and Direct Retail
               7 Duty Free

                                                                            6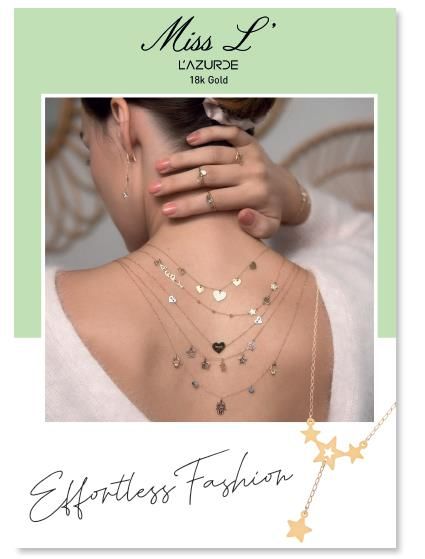
Wholesale Business Model

Gold Jewelry Wholesale Business Model
                   Banks

                                                  Value Creation at L’azurde:

                                                       • Creating great Gold jewelry products
                                     Bank
    Bank
                                   Facilities
                                                         (Design, technology, value offering,
  Facilities
(Murabaha)                         + Margin              innovation,….)

                                                       • Brand marketing

                                                       • Revenues = LSC (Labor Service Charge ) +
                                                         Stones Profits
                 L’azurde

                                                  Retailers pay L’azurde:
                                  Physical Gold
                                        +
                                                       • Physical Gold + Labor Service Charge
   Gold                           Labor Service
  Jewelry                            Charge
                                   (SAR/USD)

                                                  L’azurde takes no position on Gold

               2,000 Retailers
               1,500                              Quarterly Gold Audit with Auditors rotation
                                                                                                    7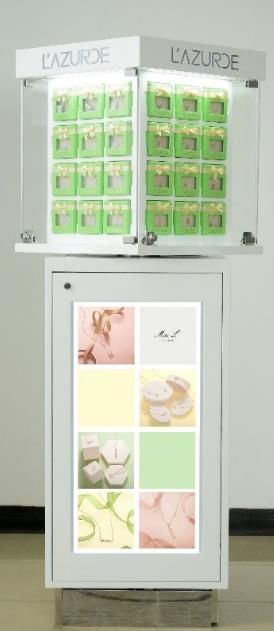
New Miss L’ High Potential Line

High GM and Low Working Capital

                                             8
New Miss L’ High Potential Line

Wholesale Business at Malls

                     E-Commerce
                  Advertising Banners          Standing Displays
                                        3rd   Party Retailers in Malls

                                                                         9
L’azurde Wholesale Business Model Evolution
Traditional Gold New Miss L’ Fashion
Souks Wholesale Jewelry Wholesale
Business Business
Gold Souks Malls
Sold by weight Sold by piece
High WC Very low WC
AR at 90-120 days AR at 60 days
Major E-Commerce
Limited E-Commerce
opportunity
If we shift 10% of the current wholesale volume sales to Miss L’,
GM and NI can increase by SAR 50m and SAR 40m respectively
10Group Initiatives
Reinforce Core Gold Wholesale
Grow Miss L’
Business
• Improve design capabilities and leverage • Drive the promising Miss L’ affordable
technology and 3D printing to produce gold jewelry fashion line distribution
differentiated products at lower weight through 3rd party retailers, own stores
• Leverage product tracking technologies and e-commerce
for better measurement of sales, faster • Develop a regional and global
replenishment to our retailers and lower distribution channel for Miss L’ products
working capital • Launch top designs: essentials, classic
• Restructure the business model to run at and fashion jewelry at affordable prices
lower operating costs and improve
• Leverage latest consumer and fashion
manufacturing productivity
jewelry trends: gifting and lighter jewelry
• Reduce working capital through shorter
• Enhance Gross Margins through mix and
payment terms and lower inventories
premium pricing for products endorsed
levels
by celebrities
11Group Initiatives
Perfect Integration Tous Franchisee
Enhance L’azurde Retail Profitability
Acquisition
• Optimize the newly acquired TOUS • Develop our profitable L’azurde retail
franchisee business in KSA business in Egypt
• Strong marketing to build awareness • Improve the profitability of the L’azurde
and brand image retail business in KSA by rationalizing our
• Enhance products assortment footprint and re-invigorating our flagship
• Train and develop engaged female shops
Saudi team in the shops • Expand our exclusive airports retail
• Expand network with top locations operations
• Establish global E-Commerce platform • Enhance products mix to raise Life Like
and CRM sales through cross selling
• Leverage global TOUS best practices • Invest in staff training to raise
productivity
12Revenues Variance – Q3 2019 (Million SAR)
120
110
2.9
100
90 (4.2) 14.6
(9.5) 7.1
80
98.5 109.4
70
60
50
Wholesale Retail
Net Volume and Price Impact
13Revenues Variance – YTD Sep 2019 (Million SAR)
450
400
350
12.8
300 2.8 56.9
(3.5) 19.8
250
200 395.2
306.3
150
100
50
Wholesale Retail
Net Volume and Price Impact
14Group Quarterly Revenues (Million SAR)
180.0
160.0 153.0
140.0 132.8
121.9
120.0 115.0 115.0
109.4
98.5 100.1 98.5
100.0 92.8 92.8
82.2
80.0 76.2 75.1
60.0
40.0
20.0
-
Q1 2018 Q2 2018 Q3 2018 Q4 2018 Q1 2019 Q2 2019 Q3 2019
Previous Year Current Year
15Group Quarterly Operating Income (Million SAR)
40.0
34.8
35.0
30.4
30.0 28.0
25.0 23.0 23.0
20.0 17.4 17.4
15.7 15.8 15.8
15.0 14.0 13.8 13.2
10.7
10.0
5.0
-
Q1 2018 Q2 2018 Q3 2018 Q4 2018 Q1 2019 Q2 2019 Q3 2019
Previous Year Current Year
16KSA Revenues increased by 33%
Operating Revenues by Country – YTD Sep 2019
Million SAR
240
215.0
190
164.6
140
90
40
8.1 7.4
-10
KSA Egypt Other GCC Other Export
% of Total 54% 42% 2% 2%
Vs. 2018 33%▲ 25% ▲ 27%▼ >100% ▲
17Retail Revenues at +57% in Q3 2019 vs. LY
109 400 395
99
100
350
306
31 48 +57% 300 166 +72%
80
250 96
60
200
40 150
-10% +9%
68 229
61 210
100
20
50
- -
Q3-2018 Q3-2019 YTD Sep-2018 YTD Sep-2019
Wholesale Retail Wholesale Retail
18Retail Gross Margin +93% in Q3 - 2019 vs. LY (Million SAR)
70 250 242
66
60 59
75 +108%
21 +93%200 183
11
50
36
150
40
30
-7% 100
48 45 168 +14%
20 147
50
10
- -
Q3-2018 Q3-2019 YTD Sep-2018 YTD Sep-2019
Wholesale Retail Wholesale Retail
19Group Consolidated Income Statements (Million SAR)
Q3 YTD Sep
2018A 2019A Delta 2018A 2019A Delta
Revenue 98.5 100.0% 109.4 100.0% 11.0% 306.3 100.0% 395.2 100.0% 29.0%
Cost of revenue (39.8) -40.4% (43.8) -40.0% 10.2% (123.1) -40.2% (152.9) -38.7% 24.1%
Gross Profit 58.8 59.6% 65.6 60.0% 11.6% 183.2 59.8% 242.3 61.3% 32.3%
Selling and marketing (32.6) -33.1% (43.7) -39.9% 33.9% (96.6) -31.5% (138.1) -34.9% 42.9%
General and admin (10.4) -10.5% (8.7) -8.0% -15.9% (30.4) -9.9% (32.6) -8.3% 7.2%
Operating Income 15.8 16.0% 13.2 12.1% -16.4% 56.2 18.3% 71.6 18.1% 27.5%
Other income – net (0.4) -0.4% 3.1 2.8% >100% (3.5) -1.1% 3.1 0.8% >100%
Finance Charges – net (9.0) -9.1% (12.8) -11.7% 42.9% (26.2) -8.6% (38.4) -9.7% 46.5%
Net Profit before Zakat 6.4 6.5% 3.5 3.2% -45.9% 26.5 8.7% 36.3 9.2% 37.0%
Zakat (2.6) -2.6% (2.5) -2.3% -5.3% (8.2) -2.7% (8.5) -2.2% 3.6%
Income Tax (0.1) -0.1% (0.8) -0.7% >100% (0.7) -0.2% (3.4) -0.9% >100%
Net Income 3.7 3.8% 0.2 0.2% -93.7% 17.6 5.7% 24.4 6.2% 38.6%
Earning per Share 0.1 0.0 -93.7% 0.4 0.6 38.6%
20You can also read