MODELING WEIGHT DATA OF INDIVIDUAL FINISHERS - KATARINA NIELSEN DOMINIAK, PHD SEGES
←
→
Page content transcription
If your browser does not render page correctly, please read the page content below
Modeling weight data
of individual finishers
Katarina Nielsen Dominiak, PhD
SEGES
2

PigSys and project ‘Production monitoring and optimization’

• PigSys is an international project with participants from Sweden, UK, France, Germany,
  Latvia and Denmark

• The overall aims are to improve productivity and sustainability of pig production as a
  whole system – including building optimization, emission handling and the animal
  productivity itself

• In SEGES we use PigSys data from the two Danish field test herds as input for models in
  the daughter project ‘Production monitoring and optimization’

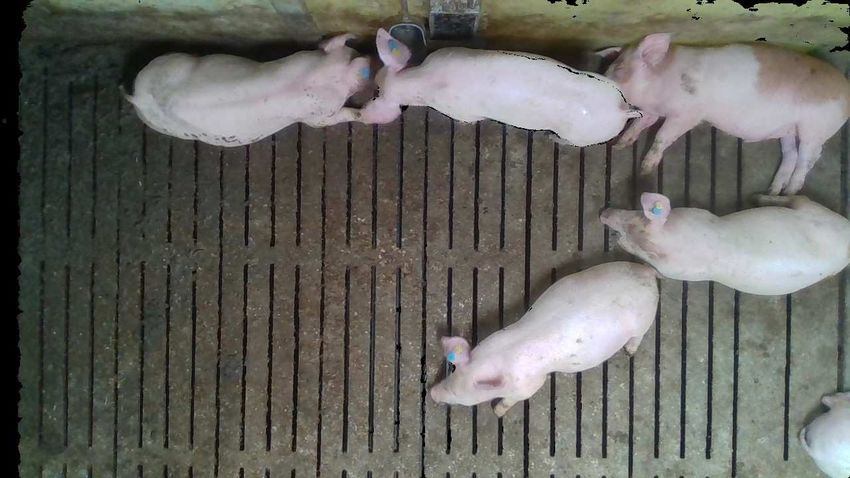
Herd description

• 40 pens per section
• 880 pigs inserted per section (22 per pen)
• Reduced to 640 after three weeks (16 per pen)
• All pigs inserted simultaneously and at same age in all sections
• Restrictive liquid feed
• 4 focus pens (2 double pens) in each of sections 7, 8, and 9

Sensors in PigSys
Weight estimates using 3D cameras – prototype setup
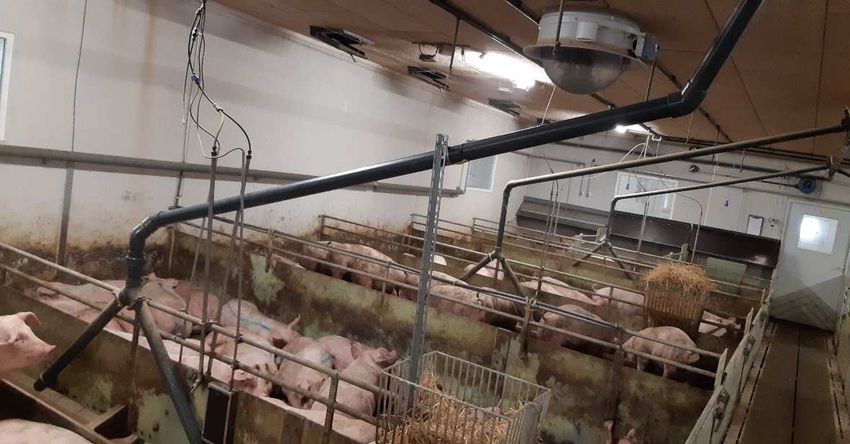
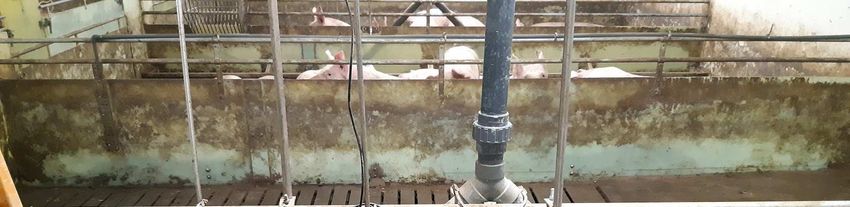
Initial setup – one camera for two pens
Feed pipe was a challenge
One camera for two pens – feeding pipe adjustment

Pigs are too big for half a camera
width

Original feeding pipe placement
restored

Thankfully we worked with one
demo-setup!
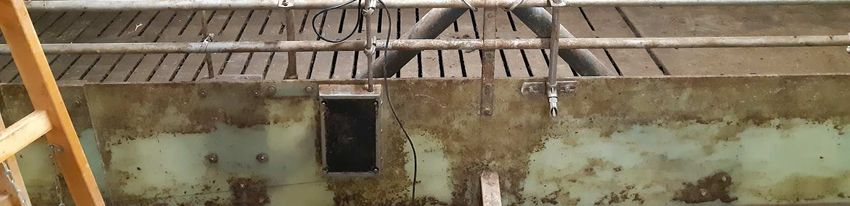
One camera per pen – drinking nipple

                          70 cm
Challenge – drinking nipple
F1

     RFID reader and drinking bowl
Slide nummer 12 F1 Forfatter; 02-10-2019
Final camera setup
Data

 Parameter     Sensor            Level            Remarks

 Water         RS/VENG           Double pen       Installed at May 9 (sec 7+9) and May 23 (sec 8)
                                                  5 min intervals
 Water         SKOV (DOL90)      Section

 Ventilation   SKOV              Section          Percentage performance fan, inlet, outlet

 Feed          BigDutchman       Double pen       Section also available

 Temperature   VENG              Pen              Manure and resting areas 5 min intervals

 Temperature   SKOV              Section          Outdoor and indoor average/day

 Weight        DOL64 prototype   Individuals in   Installed ultimo August 2019
                                 focus pens       RFID readers next to drinking bowls     We currently have data from 1½ batch

 Activity      MSH camera        Pen              Stored in hard drives
No manual registrations available • No insertion weight • No manual weighings during growt period • No registrations of diseases or behavioural changes (tail biting or fouling) • No efficiency report • No data from the abbatoir
Aims for ‘Production monitoring and optimization’

• To detect reduced growth of finishers based on camera-based weighings of individual pigs automatically

• To describe growth of finishers in double pens based on water consumption and temperature

• To develop an alarmsystem which identifies reduced growth of finishers in double pens based on changes
  in water consumption and temperature

The last aim allows for an affordable scenario with cameras in few pens and water meters in all pens

There are large variations in growth and weigth both within and between pens – sentinel pens are not
representative

– We do not know whether it is possible to predict growth changes from water and temperature
Initial data handling and considerations

• How can we define ‘reduced growth’ as an event we wish to identify?

• How does data look and how does it behave – explorative analyses

• Which methods should we use?

• How do we communicate alarms to the farmer?
Defining reduced growth as an event

Main conclusions from workshop held with 7 colleagues from SEGES:

• 3 Standard Deviations from reference growth curve

• 3-4 days in a row below the reference growth curve
Defining reference curve

• Reference growth curves should be defined separately for

  •   Gilts and barrows

  •   Ad libitum and restrictive feeding

• Each curve should be calculated with respect to insertion weight (average of three first
  days)

• Finishers are expected to grow 900-1000 g a day

• The reference curve may also be the farmer’s goal or the average of the pen
Explorative analyses – camera based weight estimates
Variation within pens
Variation between pens
Raw data – one pig

   Outlier (+/- 20 kg from median)

   Raw observation

   Median
ADW - one pig

 Outliers removed

       Average daily
       weight for days with
       less than three
       observations

        Average daily
        weight for days
        with minimum
        three observations
Mean vs median
Smoothed curve - one pig
Method consideration – Univariate DLM

A DLM aims to predict the next observation based on all previous observations

• Describe the growth of each pig individually in a linear growth model DLM

• Filter and smooth data in order to reduce amount of noise

• Estimate variance components

• Compare observed growth to reference curve (slope or exact value)

• If observed growth is more than X g lower than the reference curve 3 days in a row – put pig on alarm list

• If Y pigs in the same (double)pen are on the alarm list – generate an alarm for that (double)pen

• Go simple? Shewhart control chart monitoring smoothed observations?
Communication to the farmer

• If more than X pigs in a pen show reduced growth – an alarm will be generated for that pen

  •   The managerial setup – and time costs – does not allow for extra feed or handling of a single (healthy) pig which
      doesn’t grow as fast as expected

  •   The farmer can choose to see exactly which pigs have reduced growth and which fulfill their genetic potential

  •   At the moment prices for pig meat are historically high due to ASF in China so higher feed convertion ratio,
      increased daily gain and shorter growth periods are vere valuable

• If more than Y pigs in a pen or in a double pen show simultaneous changes in growth
  – an alarm will be generated for that pen or double pen

  •   The cause of simultaneous reduced growth is likely to be in the feed formula or in the water supply. Errors in
      feed formulas are of great concern since they have big consequenses but are often found with a delay
29
..
TAK og husk!
Vær altid opdateret på den seneste faglige viden
Tilmeld dig Nyhedsmail fra
SEGES Svineproduktion på
www.svineproduktion.dk
facebook.com/SegesSvineproduktionFocus points • A growth period is approximately 77 days so relatively few observations in the time series • The weigth estimates are not validated by manual weighings
Method consideration II - multivariate hierarchical DLM

• Each pig in a double pen is a variable in a multivariate linear growth model DLM

• Three levels: individual pig – pen – double pen

• Pigs within the same pen are higher correlated than pigs in different pens (sorted by size, experience same
  pen density etc.)

• Pigs within the same double pen are higher correlated than pigs in different double pens (share feed and water
  supply, same gender)
You can also read