RCC Node-CM Product Description Sheet Version 1.1 (September 2018) - DWD
←
→
Page content transcription
If your browser does not render page correctly, please read the page content below
RCC Node-CM Product Description Sheet Version 1.1 (September 2018)
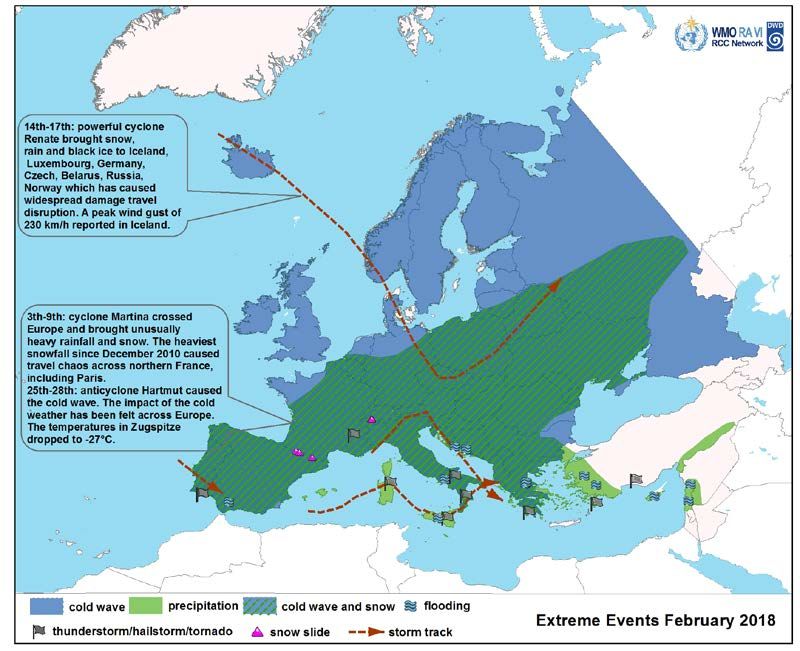
Map for extreme weather events
Some of the extreme weather events are ecological and economically disruptive,
which affects the lives of thousands of people. A “Climate Watch” can provide
information about evolving or foreseen significant weather extremes that may
have substantial impacts on a regional scale. As part of a Climate Watch
System, extreme weather events for the WMO region RA VI were monitored,
stored weekly in a Geodatabase (Knowledge Database on EuROpeaN Climate
ExtRemes / KRONER) and published in the monthly bulletins.
Categories of the extreme weather events:
Storm (storm, thunderstorm, hail, tornado and dust storm), cold spell, cold
wave, warm spell, heat wave, precipitation (heavy rainfall, heavy snow),
flooding, drought, land- and snow slide, as well as wildfire. The warm- or cold
spell is a period of abnormally warm- or cold weather(1). To define these events,
a sequence of one week has been considered in which the temperature
anomalies exceed +6°C or are below -6°C (reference period 1981-2010). For the
heat or cold wave definition(2), besides the above conditions, the criteria of
temporal scale and intensity still must be fulfilled (see below Methodology). To
define the storm track we used the IPCC term(1) that are the path followed by the
main region of a storm. For that, we have used “Analysis- and forecast charts
Europe” of DWD and ZAMG. Additionally, to record the data in the database, the
storm has to bring with them a path of destruction. Here, relevant reports on the
events are used.
Products
The map illustrates the extreme weather events in the actual period in the WMO
RA VI Region. The highlights of the extreme weather events are integrated as a
short text into the map.
1/5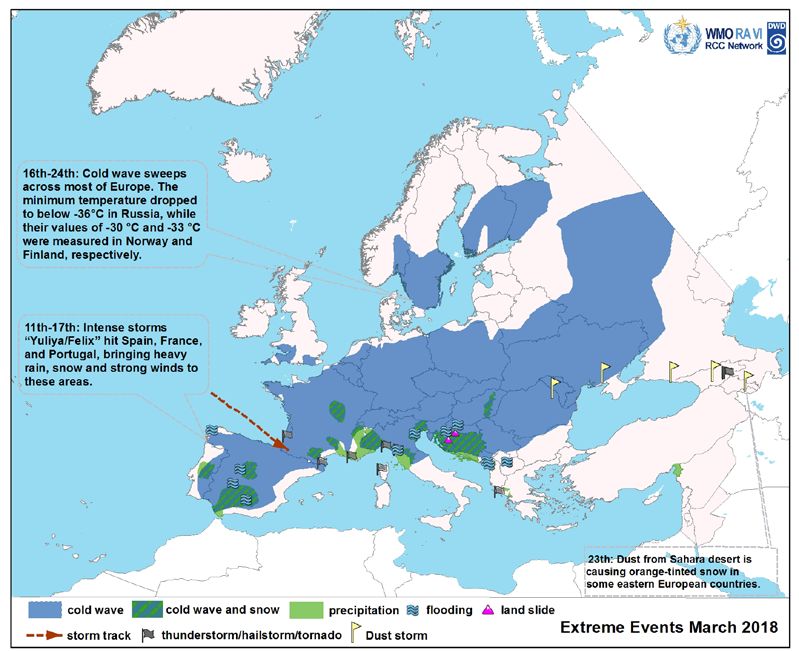
RCC Node-CM Product Description Sheet Version 1.1 (September 2018)

                                2/5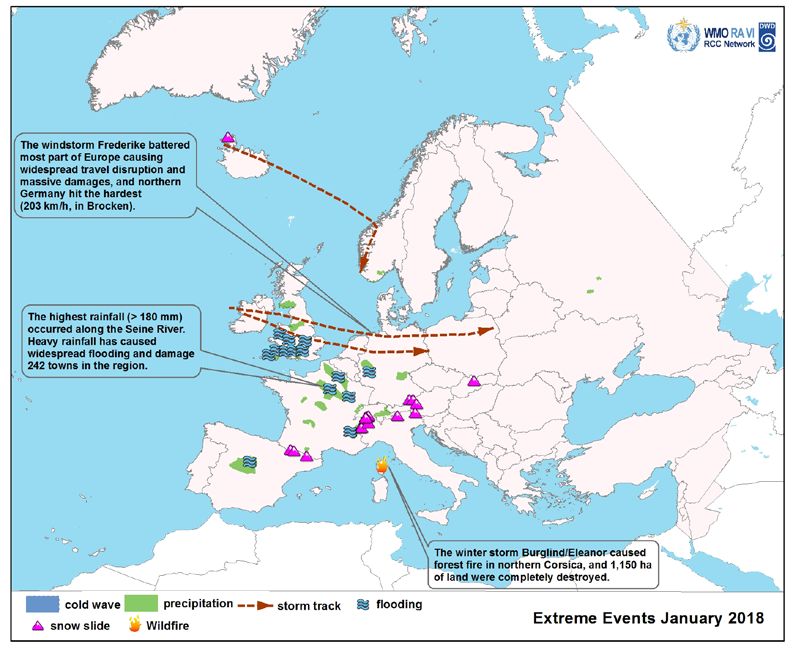
RCC Node-CM Product Description Sheet Version 1.1 (September 2018)

Specifications
Geographic regions: Europe (30°-90°N, 60°W-50°E), Middle East (29°-45°N,
25-45°E), only land areas.
Projection: North Pole LAEA Europe, World Geodetic System 1984
Availability: monthly since 01/2018
Temporal Resolution: Monthly
Format: PNG (maps)

Methodology

To quantify the extreme weather events, the following criteria have been used:
Temporal scales: the weather condition must prevail for at least three days.
The events are not necessary to persist in one place. However, it must continue
somewhere within the identified area.
Extreme character (intensity): an extreme weather event is characterized by
a significant anomaly below or above a threshold value. It can be assumed that

                                      3/5
RCC Node-CM Product Description Sheet Version 1.1 (September 2018)
this is the case if a local anomaly falls below the 10th percentile or exceeds the
90th percentile (concerning a normal reference period).
Spatial scales: the event should be captured at least in the synoptic scale range
(3), (4)
. Thus, the minimum extent should be on the order of at least some
100 km.
Ecological and economic impact: weather event-related impacts and
responses must cause damages and/or economic losses. Moreover, the damages
and losses must be verifiable by reports from the media or other public sources.
Data collection and evaluation: to collect the data, different sources are
searched on a daily basis, and all available events are stored in a data file as
possible extreme weather events. Thereafter, once a week the extreme events
are identified by using the criteria mentioned above.
To characterize and describe extreme weather events we have created a layer-
based model within GIS environment. GIS technology was used to collect, store,
retrieve, manage, transform and display spatial and non-spatial data.
Quality
To create the map for extreme weather events, we use the data from KRONER
database.
The KRONER database is characterized by the attributes such as event category,
the area of impact, begin and end of the event, duration of the event, number of
deaths, number of people who had to be evacuated and became homeless,
financial damages resulting from the event, etc. Some reports of damage from
the sources such as EM-DAT, Munich Re are published a few months later, but
with detailed information. Therefore, the attributes about the amount of damage
in the KRONER database are completed several times a year.
To be able to provide the near-real-time product, a preliminary version of the
evaluation is used for the extreme weather event map. It should be emphasized,
here, that on the one hand, the events are collected on a daily basis from the
existing data source; on the other hand, for inclusion in the preliminary version
of the database, all admission criteria have to be met (see above
“Methodology”). We, therefore, assume that the event categories and their
spatial extent in the preliminary version are well recorded, which is used for the
visualization of the monthly extreme weather event map.
Data source
The input data is based on recorded and documented events from various
existing documentation sources. Following sources have been considered:
• National Meteorological and Hydrological Services (NMHS) of the respective
countries in RA-VI
• NASA's Integrated Multi-satellitE Retrievals for Global Precipitation
Measurement mission (IMERG)
4/5RCC Node-CM Product Description Sheet Version 1.1 (September 2018)
• Copernicus Emergency Management Service
• Wetteronline
• SPIEGEL ONLINE
• MeteoWeb
• SIGN OF THE TIMES
• Prague Daily Monitor
• REUTERS
• BBC
• The Guardian
• The foreigner: Norwegian News in English
• ESWD: European Severe Weather Database
• EM-Dat: EMergency Events Database (The International Disaster Database)
• KIT (Institute for Meteorology and Climate Research, Karlsruhe Institute for
Technology
• Wetterzentrale - Current Weather Information
References
(1) IPCC, 2012 - Annex II – Glossary
(2) https://www.dwd.de/EN/ourservices/rcccm/int/descriptions/hkw/01_produktbeschreibung_hkw_en.pdf
;jsessionid=C0018D1E7511E387BC676151BBB13815.live21061?__blob=publicationFile&v=3
(3) http://www.synoptische-meteorologie.de/synoptisch-skalige-größenordnung-synoptic-scale/
(4) https://en.wikipedia.org/wiki/Synoptic_scale_meteorology
Contact
Deutscher Wetterdienst
RCC Node-CM (WMO RA VI)
Frankfurter Str. 135
63067 Offenbach
Germany
E-Mail: rcc.cm@dwd.de
Last update: 06 September 2018
5/5You can also read