NEW VERSION OF THE SPATIAL DATA MODELER TOOL: ARCSDM 5 - ARCSDM 5 FINAL SEMINAR MAY 4TH 2018, ROVANIEMI - PROJECTS
←
→
Page content transcription
If your browser does not render page correctly, please read the page content below
New version of the
Spatial Data Modeler
  tool: ArcSDM 5

           ArcSDM 5
        Final Seminar
    May 4th 2018, Rovaniemi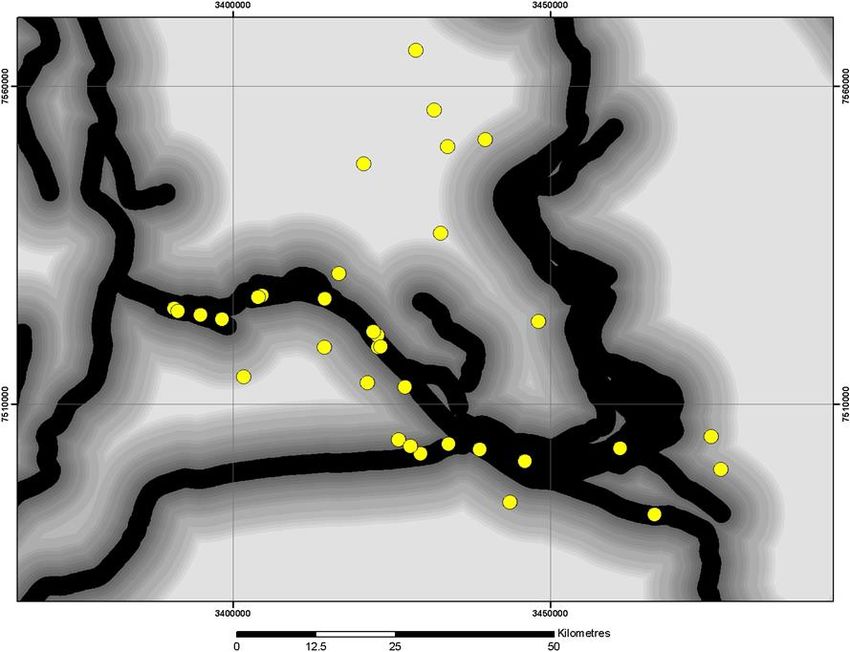
Funding

    2     Vesa Nykänen/ArcSDM5 Seminar   4.5. 2018
Acknowledgements

• This presentation may include slides borrowed from the
  following persons with or without proper citation:
   –   Gary Raines
   –   Graeme Bonham-Carter
   –   Carlos Roberto de Souza Filho
   –   Stephen Gardoll

   THANK YOU VERY MUCH GUYS!

        3   Vesa Nykänen/ArcSDM5 Seminar   4.5. 2018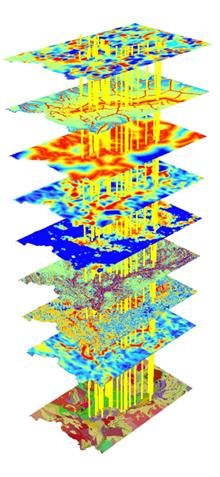
ArcSDM 5
Background
• ArcSDM was originally developed by Gary Raines (USGS) and
  Graeme Bonham-Carter (GSC) and was coded by Don Sawatzky
  (USGS)
• ArcSDM has been maintained by Prof. Carlos Roberto de Souza
  Filho, University of Campinas, Sao Paolo, Brazil,
  http://www.ige.unicamp.br/sdm/
• MPM project has recoded the tools into ArcGIS 10.4 and ArcGIS Pro
  platforms and also implemented some new tools

       4   Vesa Nykänen/ArcSDM5 Seminar   4.5. 2018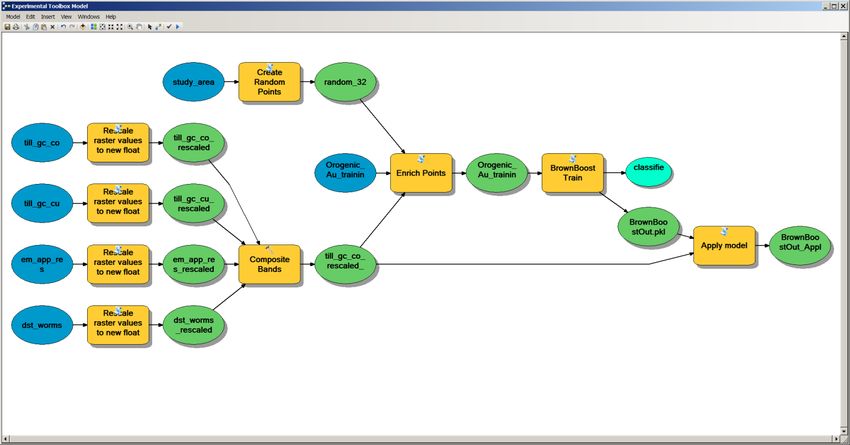
ArcSDM5
New toolbox
• Runs on ArcGIS 10.4 and beyond + ArcGIS Pro
• Maintained by GTK + open source community
• Available from https://github.com/gtkfi/ArcSDM

      5   Vesa Nykänen/ArcSDM5 Training   2.-3.5. 2018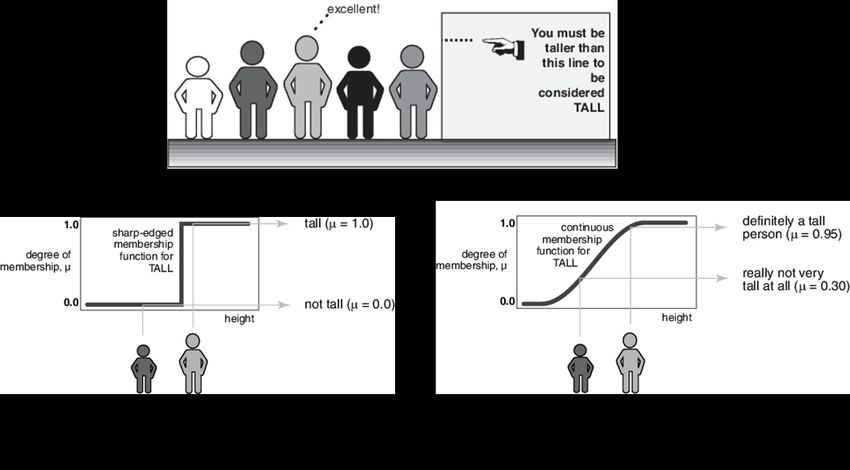
GITHUB, ArcSDM 5 Installation

• https://github.com/gtkfi/ArcSDM
• Download ZIP file to your computer
• Add toolbox(es) into your ArcGIS map document

      6   Vesa Nykänen/ArcSDM5 Seminar   4.5. 2018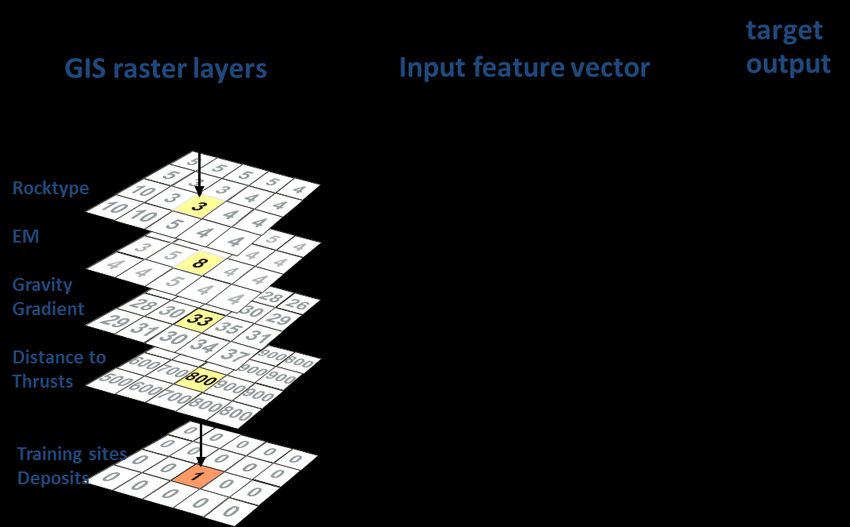
ArcToolbox

   “Traditional” SDM Tools

     Experimental SDM Tools

       7      Vesa Nykänen/ArcSDM5 Seminar   4.5. 2018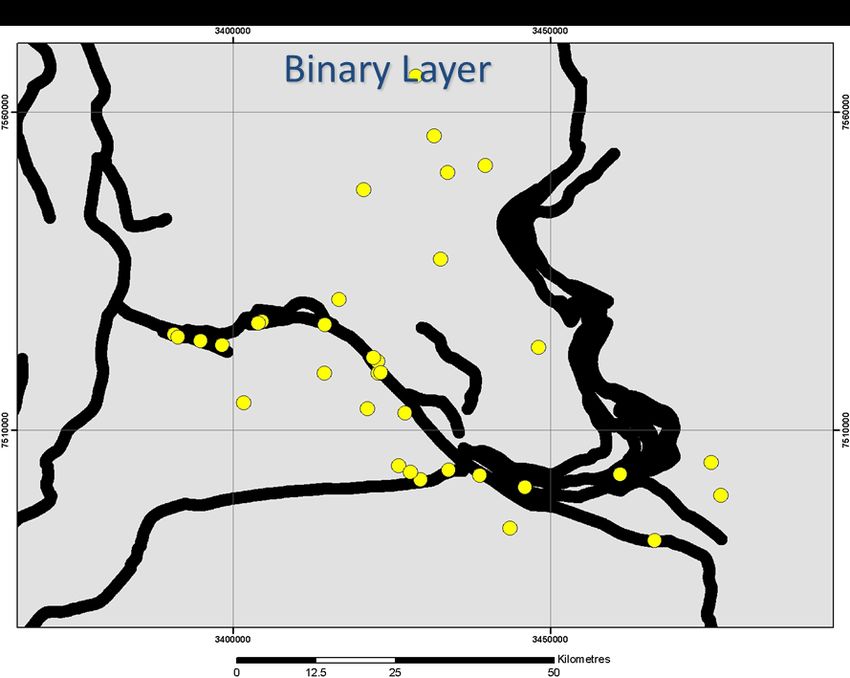
Spatial Data Modeller (SDM) toolbox

•   Geoprocessing tools for integration
    of spatial data to predict the
    location to any features (i.e.
    mineral deposits, animal habitat,
    disease outbreaks … etc).
•   Fuzzy Logic
•   Neural Network
•   ROC Tool
•   Utilities
•   Weights of Evidence
•   Logistic regression

         8   Vesa Nykänen/ArcSDM5 Seminar   4.5. 2018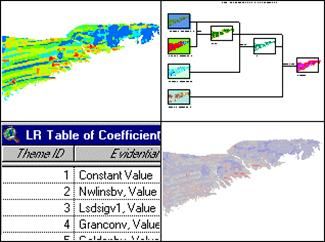
Spatial Analyst toolbox

Fuzzy logic tools in Overlay toolset
      Fuzzy Membership
      Fuzzy Overlay
      Weighted Overlay
      Weighted Sum

         9      Vesa Nykänen/ArcSDM5 Seminar   4.5. 2018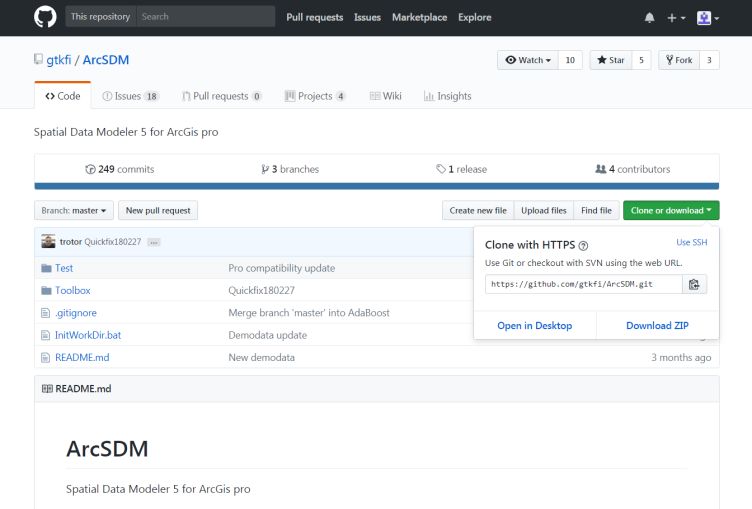
ArcSDM 5
Weights of Evidence
• Originally developed as a medical diagnosis system
   – relationships between symptoms and disease evaluated from a
     large patient database
   – each symptom either present/absent
   – weight for present/weight for absent (W+/W-)
• Apply weighting scheme to new patient
   – add the weights together to get result
• Can be applied also to predict potential for mineral
  deposit based on exploration data (geophysical or
  geochemical anomalies, geology)

      10   Vesa Nykänen/ArcSDM5 Seminar   4.5. 2018
ArcSDM 5
Weights of Evidence: Conditional Probability
• Data driven technique
– Requires training sites
• Statistical calculations are used to derive the weights based upon
training sites.
• Evidence (maps) are generally reclassified into binary patterns.
11 Vesa Nykänen/ArcSDM5 Seminar 4.5. 2018Traditional ’crisp’ logic vs. fuzzy logic
-> fuzzy sets
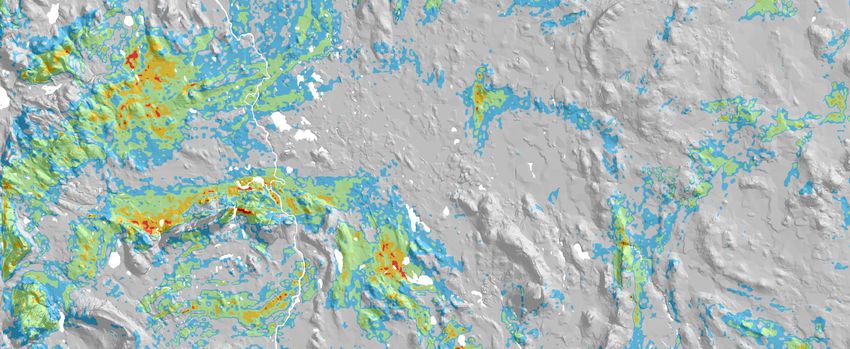
12 Vesa Nykänen/ArcSDM5 Seminar 4.5. 2018A geological example: Distance to Thrusts
13 Vesa Nykänen/ArcSDM5 Seminar 4.5. 2018A geological example: Distance to Thrusts
14 Vesa Nykänen/ArcSDM5 Seminar 4.5. 2018Problems with existing methods
Weights of Evidence
statistically-based => can’t use in poorly-explored areas
Fuzzy Logic
subjective judgement => difficult to reproduce
deposit models but a) new deposit types found
b) existing models revised
15 Vesa Nykänen/ArcSDM5 Seminar 4.5. 2018Why use neural networks?
pattern recognition
Advantages over statistical methods:
uncertain, noisy data
outliers
non-linear relationships
multiple interdependent parameters
multiple populations
mixed data sets - categorical & ratio
16 Vesa Nykänen/ArcSDM5 Seminar 4.5. 2018Converting GIS layers to feature vectors
17 Vesa Nykänen/ArcSDM5 Seminar 4.5. 2018Model validation
• Efficiency of Classification
– Training sites
• Efficiency of Prediction (Validation)
– Sites not used for training
• ROC curves
• Jack-knife/Cross-validation
18 Vesa Nykänen/ArcSDM5 Seminar 4.5. 2018PRC: Efficiency of Prediction
SRC: Efficiency of Classification
• Intersect points with response grid.
• Plot Cumulative area versus cumulative number of points
• Calculate area under the curve.
– Area under the curve for sites should be greater than 50% of total area, then
have a positive association with points.
– Area under the curve for “Not” sites should be less than 50% of total area, then
have a positive association with points
– If area under the curve, then have a random association with the evidence.
Evidence provides no better information than guessing.
• Point in curve where goes from steep slope to flat slope is an optimal break
between predicted sites and not sites.
19 Vesa Nykänen/ArcSDM5 Seminar 4.5. 2018The ROC curve
• The ROC curve is a graphical method for evaluating the
performance of binary classifiers
• The threshold value takes all possible threshold values
• For each threshold value, the following rates are calculated:
– False Positive Rate: FPR = number of false positives / total number of negatives
– True Positive Rate: TPR = number of true positives / total number of positives
• The (FPR,TPR) points are plotted as a line graph
A ROC curve which is
equal to tossing a coin
to determine the group
(positive or negative)
20 Vesa Nykänen/ArcSDM5 Seminar 4.5. 2018ROC tool in ArcSDM
21 Vesa Nykänen/ArcSDM5 Seminar 4.5. 2018Experimental SDM toolbox
• Created by ESRI Germany: Irvine Gabrera and Melanie
Brandmeier.
• Based on ArcPy, Scikit-learn and Matplotlib Python
modules
• Algorithms implemented
– Adaboost
– BrownBoost
– Logistic regression
– Random Forest
– Support Vector Machine
22 Vesa Nykänen/ArcSDM5 Seminar 4.5. 2018Experimental SDM toolbox
BrownBoost model
• Steps in Experimental tools:
1. First need to re-scale data values to 0 – 1
2. Combine re-scaled grids using Composite Bands
3. Create random points (not deposit sites, N = deposit sites)
4. Enrich points -> extract grid values to points
5. Train BrownBoost model
6. Apply Brown Boost model
7. Validate model
23 Vesa Nykänen/ArcSDM5 Seminar 4.5. 2018Experimental SDM toolbox
BrownBoos model
Rescale data Enrich points Train model Apply model
24 Vesa Nykänen/ArcSDM5 Seminar 4.5. 2018Experimental SDM toolbox
BrownBoost
25 Vesa Nykänen/ArcSDM5 Seminar 4.5. 2018Experimental SDM toolbox
BrownBoost
• Validation done using ROC
method
• AUC=0.847
*
#
*
#*#
* *
##
* #
*
#
*
# *
#
*
#
*
# *
#
*#
#* *
#*
# *
# *
#
* #
# **
#
*
#
*#
*
#
#*#
*#
* #
# *
#
* *#
*
*
#
*#
# *
#
*
26 Vesa Nykänen/ArcSDM5 Seminar 4.5. 2018ArcSDM5
Summary
• Runs on ArcGIS 10.4 and beyond + ArcGIS Pro
• Maintained by GTK + open source community
• Available from https://github.com/gtkfi/ArcSDM
27 Vesa Nykänen/ArcSDM5 Seminar 4.5. 2018You can also read