Back to Broadside Two - Cape Wrath Capital
←
→
Page content transcription
If your browser does not render page correctly, please read the page content below

This is not a promotional document

  Back to
Broadside
      Two

                  July 2018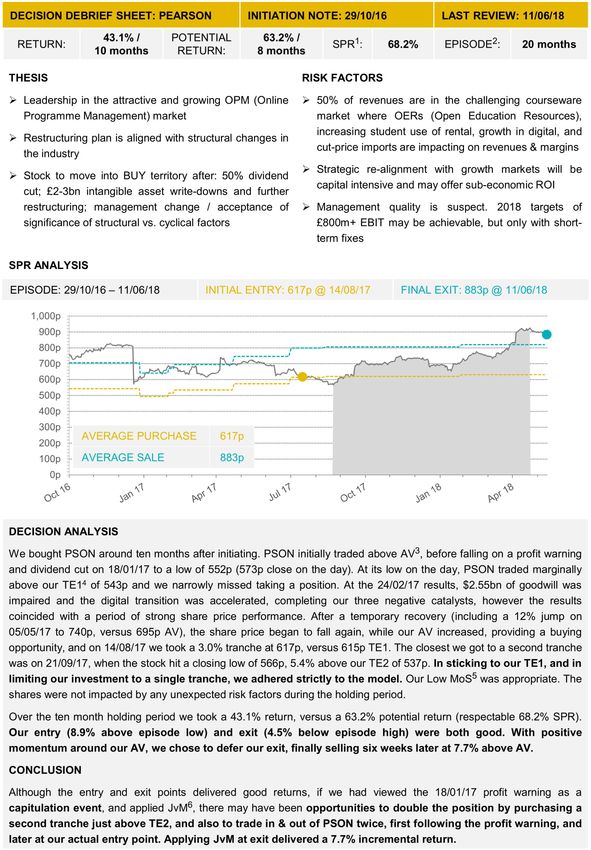
This is not a promotional document

BACK TO BROADSIDE TWO                                      COMMENTARY

In October 2016 we put Pearson through our
research process and decided not to invest.                  Pearson came onto our radar having halved
We documented this decision in ‘Broadside                         over 18-months from a high of 1508p.
Two – Existentialism & Equity Research’,
which was published in April 2017, and which                   The ‘Thesis and Risk Factors’ are cut and
is available on our website. Companies in                    paste from our original Initiation note. These
which we decide, after due diligence, not to                     are our thoughts at the time without the
invest, reside on a Watchlist, where we                                                benefit of hindsight.
monitor the news flow and update our target
price accordingly. So it was with Pearson. In
August 2017 the share price dropped below
our initial target entry price, which had been
gradually rising, and we bought an initial                   We entered and exited the position in single
tranche. We exited Pearson ten months later                  tranches, so the initial entry is the same as
when the share price rose beyond our                       the average purchase price, and the final exit
assessment of approximate value.                                  is the same as the average sale price.

If you have discussed process with us, you                               Exit points
will know that the debrief and feedback loop
                                                                         Entry points
is an important part of what we do.
‘Broadside Six – Back to Broadside Two’                                  Approximate    Value,   which
wraps up the Pearson case study by                                       changes over time as we
documenting that debrief process.                                        update our valuation model

The ‘Decision debrief sheet’ on the following                            Target Entry Price 1, which is
page is produced as an internal document,                                calculated at a discount to the
and so is best read in conjunction with the                              Approximate Value
‘Commentary’ opposite, and the ‘Acronyms
and terminology’ sheet on the final page.

Adam Rackley
                                                                     Our conclusion is a reflection on the
Cape Wrath Capital                                              importance of following the model, versus
                                                                having the flexibility to apply judgement in
July 2018                                                                                 making a decision.

                                                           While the Pearson debrief has not suggested
                                                              any tangible improvements to our process,
                                                               some of our debriefs do. For example, our
                                                           investment in NCC delivered a return of 42%
                                                           versus a potential return of 171% (i.e. a 25%
                                                            Share of Potential Returns), with most of the
                                                              potential return lost on our entry price. As a
                                                             result, we made a number of improvements
                                                             (and more are underway), to reflect the fact
                                                                          that behaviourally focused value
                                                              opportunities can ‘decay’ quickly over time.
                                                            The debrief on our investment in AA has led
                                                               us to broaden our valuation approach and
                                                                     improve our risk management tools.

                                                  PAGE 1
This is not a promotional document
PAGE 2This is not a promotional document
ACRONYMS AND TERMINOLOGY
(1) SPR
Share of Potential Returns = actual return over the holding period / maximum potential return during the
Episode
With the Episode start and end points, and our trading data, the performance model calculates the
maximum potential share price return during the Episode, our actual share price return, and our SPR.
Another model collects the changes in AV for each holding over time and updates the chart with the AV
(blue dotted line) and TE1 (orange dotted line).
(2) Episode
The period from when we first considered the stock as a potential investment, to when the investment thesis
has run its course. Sometimes the Episode is simply the period from when we started researching the
company (we often use the date of the Initiation note as a proxy for this), to when we exited the position. In
these cases, the Episode might coincide closely with our holding period. At other times the stock might sit
on a new ideas list for a number of weeks or months before we come to look at it, or the thesis may
continue to play out after we have exited the position. In these cases, the Episode might be much longer
than our holding period.
(3) AV
Approximate Value. Our Valuation Matrix includes up to 33 different valuation metrics which we blend to
produce the AV. We prefer AV to the more commonly used ‘Fair Value’ or ‘Target Price’ because it reminds
us that precision is not the same as accuracy. We cannot know what a stock is worth. At best we can
estimate a likely range of value. The AV is simply the mid-point in a range of possible values for the stock.
We illustrate this graphically in our Valuation Distribution, which plots possible values on a Gaussian
distribution. Whatever the criticisms of the Gaussian distribution when measuring volatility / VAR, we feel
that it is a simple but effective way to look at equity valuation risk. The standard deviation of our valuation
distribution (which we scale to a 0-3 range and simply call ‘valuation range’) is thus one of the factors that
we consider when calculating our Margin of Safety.
(4) TE1, TE2, TE3
Target Entry (price) 1, 2, 3. We look to build a position in three tranches, with each Target Entry triggered
by a price level. The exact price which triggers an entry is calculated based on a required % upside to our
AV. Where a share has a Low MoS, our TE1 is set at 30% upside, a Medium MoS implies a TE1 at 50%
upside and High MoS suggests TE1 at 70% upside. TE2 and TE3 are then triggered by further share price
falls (or AV increases). With a High MoS share, TE3 will only be triggered when we see 110% upside,
which means a share worth 100p must trade below 48p before we will add a third tranche. Each tranche is
around a 2.5% position, which means that after three tranches a stock will be 6.0% - 6.5% of the portfolio.
(5) MoS
Margin of Safety. This the penultimate stage in our research process. Having arrived at an AV, we need to
determine what discount to that AV we should aim to buy at to compensate for the riskiness of the
investment. We calculate a score across four risk factors (including valuation range) to determine whether
we need to make a purchase with a Low, Medium or High MoS.
(6) JvM
Judgement versus Model. We believe that investing is part art, part science. A robust and quantifiable
process helps us to deliver repeatable decision-making and enables an effective feedback loop. However,
we must not be slaves to our models. They are just tools to support human decision making, and there are
factors that our model cannot quantify. For example, we might view a piece of news flow and subsequent
share price reaction as a ‘capitulation’ event. Under such circumstances, we would be inclined to buy, even
if the shares had not hit TE1, on the basis that all of the bad news is now ‘in the price’. Alternatively, we
might see changes in the shareholder register, or short-selling disclosures, that incline us to trade, despite
the model. Whether we should follow the model or exercise judgement to over-ride it is a continual source
of healthy tension within our process.
PAGE 3You can also read