Introduction to Excel, Word and Powerpoint - Shawn Koppenhoefer Developing Valuable Technology Skills!
←
→
Page content transcription
If your browser does not render page correctly, please read the page content below
Introduction to Excel, Word
             and Powerpoint
        Developing Valuable Technology Skills!

                  Shawn Koppenhoefer

Training in Research in Reproductive Health/Sexual Health 2005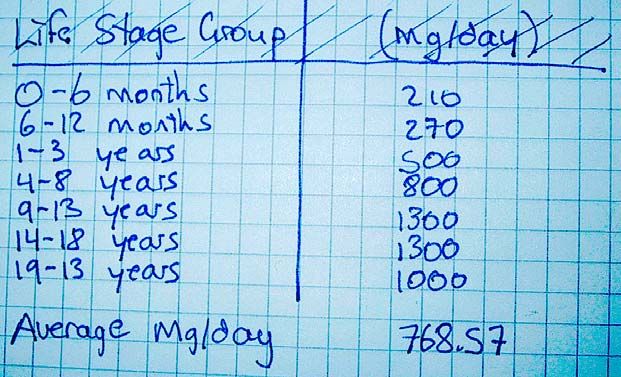
Excel spreadsheets
• What you need to know:
  – Creating new spreadsheets
  – Resizing your rows & columns
  – Inserting, deleting, and hiding rows & columns
  – Making calculations & using cell-references
  – Copy/paste your work into other applications
• How to recognize an Excel file?
  – The file names ends in « .xls »
EXCEL
Why a SpreadSheet?
• A spreadsheet is the computer equivalent of a paper ledger sheet. It consists of
a grid made from columns and rows. It is an environment that can make number
manipulation easy.
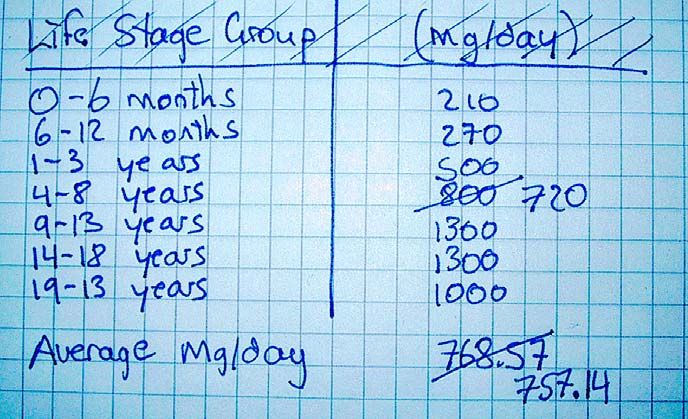
• If you change the mg/day amount, you will have to start the math all over again. On
the computer version you can change the values and the result is automatically re-
calculated.• Let the COMPUTER do the calculations
Basics of a Spreadsheet
• Spreadsheets are made up of
  – columns
  – rows
  – and their intersections are called cells
• In each cell there may be the following types of
  data
  – text (labels)
  – number data (constants)
  – formulas (mathematical equations that do all the
    work)
Letters denote a columns location. e.g., column C Numbers denote a rows location. e.g., row 4 Cells are denoted by the Column and the row. e.g., cell B6
Types of Data you will type
•   three basic types of data that can be entered.

     – labels - (text with no numerical value)
       e.g., “Life Stage Group”, or “0-6 months”

     – constants - (just a number -- constant value)
       e.g., “210”, or “270”

     – formulas* - (a mathematical equation used to calculate)
       e.g., “=10+100”, or “=123*12+78.2
Basic Math
• Spreadsheets have many Math functions built into them. Of the most
basic operations are the standard multiply, divide, add and subtract.
These operations follow the order of operations (just like algebra).
• Examples
A1 (column A, row 1) = 5
A2 (column A, row 2) = 7
A3 (column A, row 3) = 8
B1 (column B, row 1) = 3
B2 (column B, row 2) = 4
B3 (column B, row 3) = 6
Operation Symbol Constants References Result
Multiplication * =5*6 = A1 * B3 30
Division / =8/4 = A3 / B2 2
Addition + =4+7 = B2 + A2 11
Subtraction - =8–3 = A3 - B1 5Selecting Cells
• Learn to REFERENCE your data from other parts of the spreadsheet.
– When entering your selection you may use the keyboard or the mouse.
– Select cells together by specifying a starting-cell and a stopping-cell.
This will select ALL the cells within this specified BLOCK of cells.
– When cells are not together use the comma to separate the cells or by holding down the
control-key and selecting cells or blocks of cells (the comma will be inserted automatically to
separate these chunks of data.)
• E.g., the ‘SUM’ function
The Sum function takes all of the values in each of the specified cells and totals their
values. The syntax is: =SUM(first value, second value, etc)
– In the first and second spots you can enter constants, cells, range of cells.
– Blank cells will return a value of zero to be added to the total.
– Text cells can not be added to a number and will produce an error.Sum Example
= sum(B2:B8)
Note: text values will cause errors,.. And empty values are counted as ‘0’Other Functions • Average ignores text & blanks • Max – Returns the largest value in a range • Min – Returns the smallest value in a range • Count – Returns the number number-data cells • CountA – Returns the number of non-empty cells
The ‘IF’ function
•    check the logical condition of a statement and return one value if
     true and a different value if false. The syntax is
      – =IF (condition; value-if-true; value-if-false)
      – value returned may be either a number or text
      – if value returned is text, it must be in quotes

                                              = IF ( B 2 > 7 5 5 ;" ye s ";" no ")

    Note: Other logical functions can also be used (NOT, OR, AND, TRUE, FALSE)
Making a Graph
• Insert > chart
•Using the Wizard use select the chart type, data-range, and labels
•You can always CHANGE these values afterwards by double-clicking on
your graphic.Copy-Paste into Word/Powerpoint • You can always copypaste from Excel into Word or powerpoint files.
Powerpoint – for
        presentations
• What you need to know
  – Create a new presentation
    • using the wizard, design-template, or blank-
      presentation
    • Using blank-presentation is the most flexible for
      you!
  – Understand the tools inside of powerpoint
  – Moving from slide to slide
  – Presenting your slide.
Creating a new presentation • "AutoContent Wizard" walks you through a series of questions about your presentation, letting you choose from a variety of predetermined content themes, visual styles, and formatting options. You can answer all of the questions or skip some and click "Finish" at any time. • "Design Template" allows you to choose from various background designs and slide styles to use throughout your presentation. Clicking the various presentation options shows thumbnail views of their designs. Click "OK" to choose one. • "Blank Presentation" starts you out with blank slides. – This is my favorite !
Tools in Powerpoint
• VIEWS
 –   PowerPoint has several 'views' that allow you to edit and see presentation content in various
     useful ways. You can switch among the views as you work by selecting one from the View
     menu or clicking one of the five 'view' buttons in the lower left-hand corner of the PowerPoint
     window.

 - In the Normal view, the screen is split into three sections showing the
 presentation outline on the left, the slide in the main window, and
 notes at the bottom.
Other Views • Outline View • Slide View • Slide Sorter
(TOOLS)

      Inserting Slides & Text
• Use INSERT>NewSlide to add new slides
  after the current slide
  – You can use the « slide layout » choices to
    modify the layout of the slide you are using
• To insert text on a slide
  – Replace the dummy text
    or,
  – Create a text-box
     • Learn how to resize text boxes and reformat text.
(Tools)
Inserting Images
• Find the image on the Internet and use
copy/paste to paste it into your slide
• Position and reisize the image using the
image handles
• Some image-editing (like cropping) can be
done with powerpoint.Formatting your background • From the menu, use Format>Background – Preview the effect before applying it – Apply the effect to one slide or to ALL slides
Adding a graph
• The easiest approach is to use cut and
  paste from your Excel data file
• Alternatively you can use the Content-
  Layout element to the right.
Example
• The chart on the right   50
  can be then changed      45
  by double-clicking it.   40
                           35
                           30             low Cholesterol

• The type of chart can    25             medium
                                          Cholesterol
  be changed by right-     20             high Cholesterol
                           15
  clicking and opening     10
  it.                       5
                            0
                                results
Microsoft Word
• What you should know
– Opening a file (an existing file or a new file)
– Different « views » in Word
• With Outline-view you can create powerpoint
presentations (but you must use the file extension
.ppt when saving!)Other Resources
• Excel Tutorials on the Internet
– http://www.fgcu.edu/support/office2000/excel/
– http://www.baycongroup.com/el0.htm
– http://www.studyfinance.com/lessons/excel/
– http://www.usd.edu/trio/tut/excel/
• Useful Powerpoint help
– http://www.actden.com/pp/print.htm
– http://www.ellenfinkelstein.com/powerpoint_tip.html
– http://www.masterviews.com/2001/11/15/chart_types_how_to_select_appropriate_cha
rt_types.htm
• Microsoft Word Tutorials
– http://www.tutorialbox.com/tutors/off2000/word/
– http://www.baycongroup.com/wlesson0.htm
– http://www.public.iastate.edu/~hschmidt/wordtutorial.htmlYou can also read