CEASELESS (Copernicus Evolution and Applications with Sentinel Enhancements and Land Effluents for Shores and Seas)
←
→
Page content transcription
If your browser does not render page correctly, please read the page content below
CEASELESS
                    (Copernicus Evolution
  and Applications with Sentinel Enhancements and Land
               Effluents for Shores and Seas)
                           EU H2020 project
Sanchez-Arcilla A, Staneva J, Cavaleri L, Badger M, Bidlot J, Sorensen JT, Hansen LB, Martin
A, Saulter A, Espino M, Miglietta MM, Mestres M, Bonaldo D, Pezzutto P, Schulz-
Stellenfleth J, Wiese A, Larsen X, Carniel S, Bolaños R Abdalla S and Tiesi A (2021)
CMEMS-Based Coastal Analyses: Conditioning, Coupling and Limits for Applications.
Front. Mar. Sci. 8:604741. doi: 10.3389/fmars.2021.604741

                                                                                          1
INTRODUCTION

CEASELESS pilot cases: Mediterranean/North Atlantic offshore + coastal
domains representing open/gulf coasts (Catalan/Northern Adriatic) and
estuary/inlet coasts (German Bight/Danish).
                                                                         2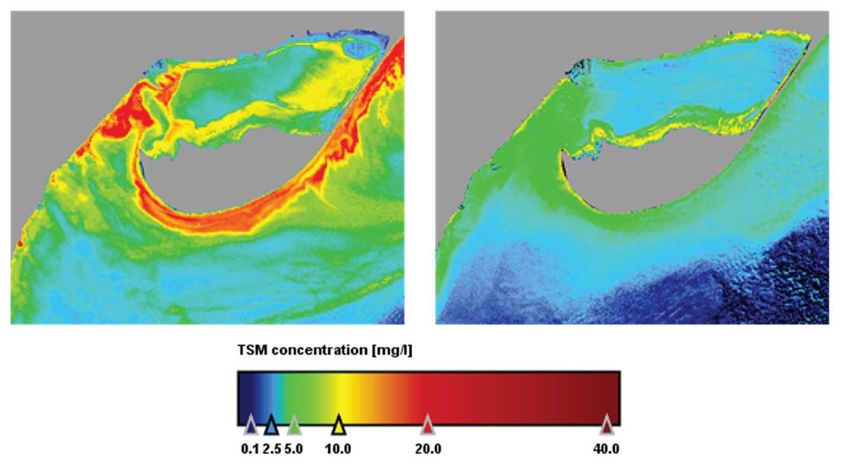
MATERIALS AND
  METHODS

            QQ-Scatter plots of measured
            significant wave height - in-situ-GTS
            vs. remote sensing data of: (a)
            Sentinel-3A SAR, (b) Sentinel-3A
            RDSAR, (c) CryoSat-2 SAR, (d)
            CryoSat-2 RDSAR and (e) Jason-2. The
            comparison is from June to November
            2016 period. The QQ-plot (black
            crosses) indicates the 45° reference
            line (blue line) and the least-squares
            best fit line (red line).

                                              3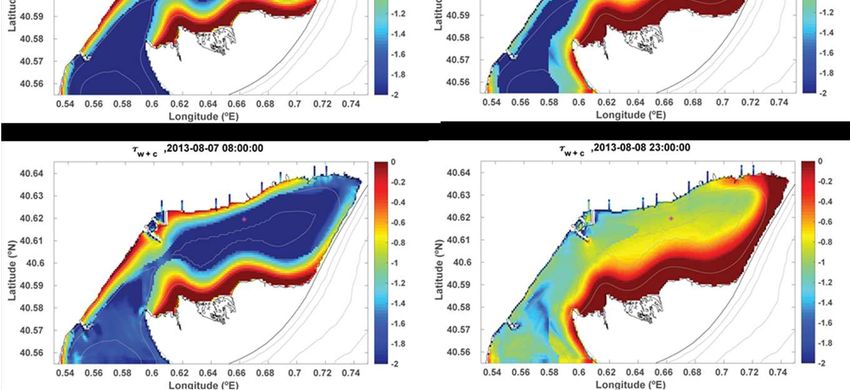
RESULTS
   Evolution of Coastal Data Conditioning (1)

Sea level anomaly (SLA) standard deviation (STD) in 200 meter bins of
distance to coast and 20 Hz significant wave height (SWH) median of
points curve for retrackers SAMOSA++ (black curve), SAMOSA+ (red curve),
together with SAR Marine (blue curve) and numerically simulated (GCOAST
model - green curve) versus distance to the coast. NP is the number of
points.
                                                                           4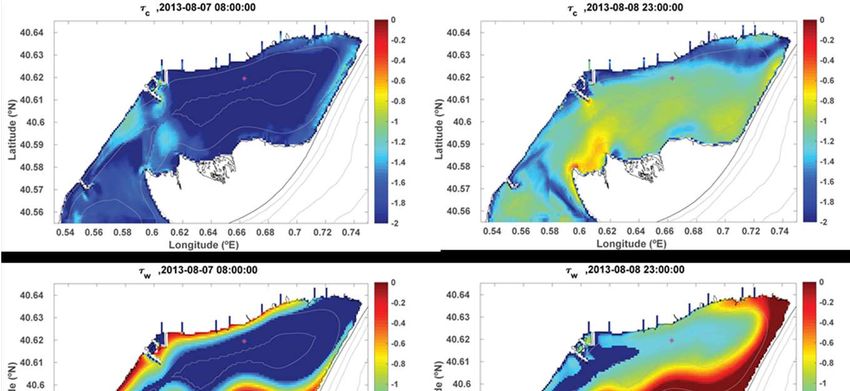
RESULTS
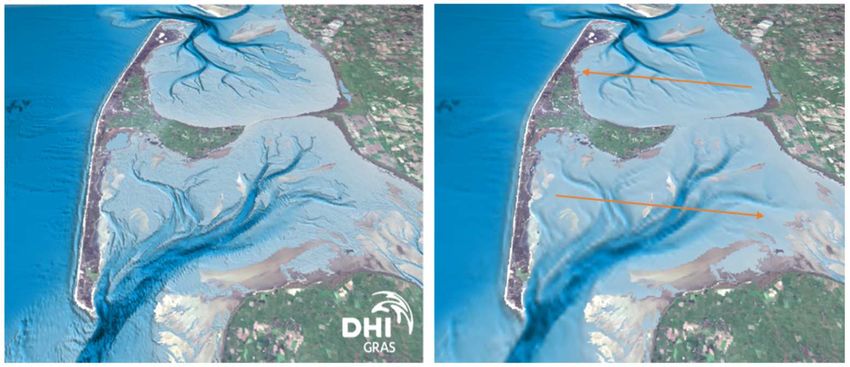
Evolution of Coastal Data Conditioning (2)
Illustration of the higher level of detail resulting from a S2 derived bathymetry
(left) when compared to the widely used EMODnet bathymetry (right). The
example shown is from the German part of the Wadden Sea, inside the
corresponding CEASELESS pilot area.
5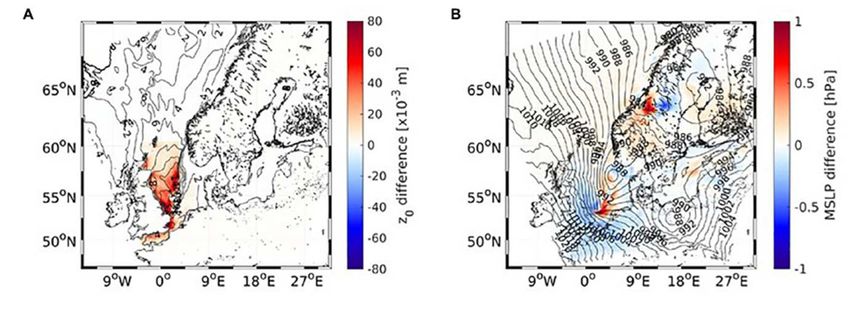
RESULTS
       Evolution of Coastal Data Conditioning (3)

Total Suspended Matter (TSM in mgr/l) in the Ebro delta southern bay, derived
from Sentinel-2 data for two different scenarios: NW winds (left; 27th of December
2017) and calm conditions (right; 15th of February of 2018). The images depict the
TSM originating from the bay and contributed by the main river mouth (not shown)
located above the figure domain.                                                     6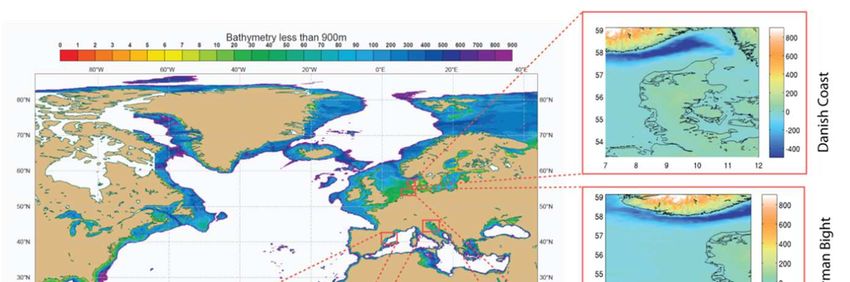
RESULTS
Coupled High-Resolution Coastal Simulations (1)

                                  Absolute values of roughness
                                  length variations (A), mean
                                  sea level pressures MSLP (B),
                                  and 10 m wind speed (C) for
                                  the regional stand-alone
                                  (reference) model
                                  simulations (contours). The
                                  color coding indicates the
                                  differences between the
                                  coupled and reference model
                                  simulations in the North Sea
                                  pilot domain during a sample
                                  storm on 13th January, 2017
                                  at 12:00 UTC.

                                                            7
RESULTS
Coupled High-Resolution Coastal Simulations (2)

                                  Distribution of the current,
                                  wave and combined wave-
                                  current bottom stresses
                                  (logarithmic scale in 10Pa) in
                                  the Alfacs Bay of the Ebro
                                  delta, during the first stage of
                                  a sea breeze episode (left) and
                                  during a land wind (from the
                                  NW) event. Note that, for
                                  clarity, the plot scale is
                                  logarithmic

                                                                8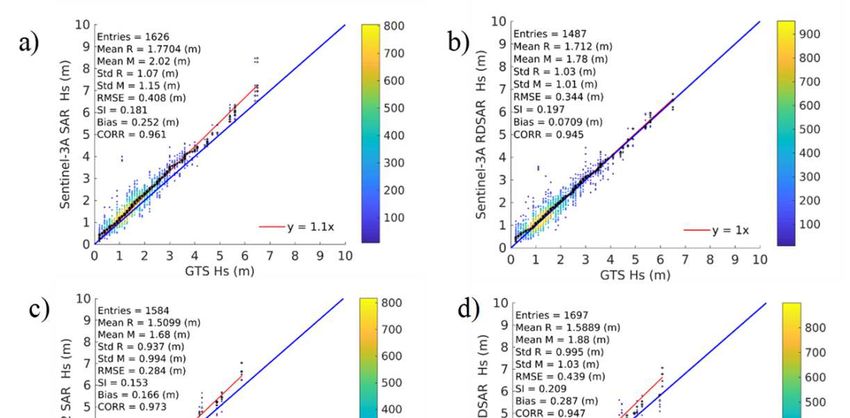
RESULTS
 Coupled High-Resolution Coastal Simulations (3)

Relative change in normalized root-mean-square error (RMSE) of significant
wave height compared with in-situ observations for the 3 -1.5 km versus 7 km
model runs (AMM15 and AMM7 respectively). The error shows a degradation in
performance (in red) with an improvement in performance (in blue) associated to
a decreasing normalized root-mean-square error (RMSE). The increasing
resolution has a largely neutral impact on open waters, while for coastal zone
predictions there is a substantial reduction in error with respect to the AMM15   9
model.
RESULTS
Coastal Assimilation and Error Control (1)
                             Root mean square errors for
                             significant wave height
                             predictions in North Sea pilot
                             case, including the UK East and
                             South Coasts. The three
                             analysed experiments
                             correspond to: a) model run
                             without data assimilation
                             (amm15s, black dashed line); b)
                             assimilation of satellite altimeter
                             and in-situ wave observations in
                             open waters (amm15s-acma-
                             ig05; gold line); and c)
                             assimilation of satellite altimeter
                             and in-situ wave observations in
                             open and coastal waters
                             (amm15s-aext-cg05; green line).
                                                                   10
RESULTS
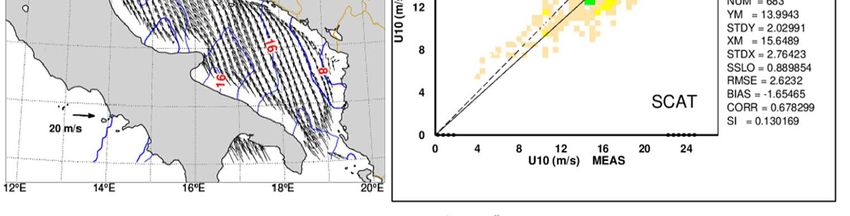
Coastal Assimilation and Error Control (2)
Wind field derived from ASCAT-B scatterometer in the evening of 29th
October, 2018 over the Adriatic Sea pilot (left), and comparison between
modeled and measured wind speed values for that event (right)
11RESULTS
Coastal Assimilation and Error Control (3)
Random error reduction in significant wave height HS (left) and mean wave
period (right) from all performed experiments compared to the experiment
without data assimilation, verified with all available in-situ data for the whole
month of October 2018. Note that the random error reduction by in-situ-
assimilation and the combined in-situ-altimeter assimilation shoot up at
analysis times to the depicted values. 12RESULTS
Limits and Recommendations for Coastal Applications (1)
Differences (in days) for the
water e-flushing times between
different (NBS) Nature Based
Solutions (R1, R2 are controlled
land discharges with different
flow rates and B1, B2, B3 indicate
different breaching widths in the
barrier beach). Each NBS test case
has been compared to the Control
Simulation. Negative (positive)
indicates shorter (longer) local e-
flushing times for the
corresponding NBS when
compared with the control
simulation. 13RESULTS
Limits and Recommendations for Coastal Applications (2)
a) Sentinel-3a tracks together with
positions (top left) of CMEMS in-
situ wave measurement stations
(blue diamonds) and additional
GTS wave stations (red triangles),
together with an example (top
right) of CMEMS AMM17 model HS
values for the North Sea pilot case
on 10th December, 2018 00:00
UTC.
b) A comparison of HS measured by
the Elbe buoy with numerical
model results (bottom left), and
S3A measurements (bottom
centre) for 2018.
14DISCUSSION AND
CONCLUSION
• By merging in-situ, satellite and high-resolution numerical data, the CEASELESSS
project has explored synergies among different data sources and strategies for
parameter optimization, leading to improved metocean coupled predictions in
coastal restricted domains.
• To comply with stakeholder requirements, these high-resolution predictions should
include:
a) Cross validation with multiple source measurements;
b) Consistent provision of accuracy for all sensors;
c) Optimal blending of information from satellite, in-situ and modeled data.
• However, the low probability of having a satellite overpass coincident with a critical
period, such as a storm peak (i.e., right place at the right time) constitutes the
main limitation of the CEASELESS methodology, suggesting as an alternative, a
posteriori applications of the proposed methodology, using Sentinel data for
hindcast verification and improvement of modeling physics.
15Thank you very much.
Manuel Espino
Maritime Engineering Laboratory (LIM)
Polytechnic University of Catalonia (UPC) Barcelona, Spain
16You can also read