Torquay Risk Profile 2018/19 - Devon & Somerset Fire & Rescue Service
←
→
Page content transcription
If your browser does not render page correctly, please read the page content below
To see the full behavioural

                              Torquay Risk Profile 2018/19
Torquay Risk Profile 2018/19                 2

Overview

                                                                 almost double that of the static population.              Below are the Officers in charge of this station.

                                                                 Torquay has a higher proportion of elderly/retired
                                                                 persons compared to the national average. Torquay
                                                                 has a significant and growing number of migrant
                                                                 European workers employed within the lower paid
                                                                 service sector industries. Approximately a third of the
                                                                 adult residents of Torquay are in receipt of some form
                                                                 of benefit (DWP) and a higher percentage of people
                                                                 are unemployed.                                           Watch Manager     Watch Manager      Watch Manager
                                                                                                                           Dave Nott         Jim McGuiness      James Tribble
                                                                 Torquay is the largest town in the Torbay area and        Blue Watch        Green Watch        Red Watch
                                                                 has an extensive tourism and leisure industry. There
                                                                 is significant holiday trade based around many hotels,
                                                                 bed and breakfasts, restaurants, nightclubs, theatres
 This plan presents the risks in your area and                   and other tourist attractions. The Marina attracts
                                                                 many boating enthusiasts and a large infrastructure
 the actions that Devon & Somerset Fire &
                                                                 has developed to support this. Torquay is accessed
 Rescue Service (DSFRS) will take to make the                    primarily via the A380/A379 and a main line rail link
 community safer. Our actions are a mix of                       with two railway stations. On the outskirts of the town
 activities based on prevention, protection and                  there are villages, parishes and extensive areas of       Watch Manager     Watch Manager      Local Risk
                                                                 open fields and woodland, which can present               Guy Watkin        Malcolm Mushing    Manager
 emergency response, all undertaken by the
                                                                 additional risks. In September 2007 Torbay received       White Watch       Retained           Rod Schneider
 people that are best suited for each activity.                  international recognition for its rich geological,
                                                                 historical and cultural heritage; it became one of just
 Torquay Fire Station is located within the Western              57 areas around the world to be endorsed by
 Command. The local Authority is Torbay Council, which           UNESCO as a Global Geopark.
 has unitary status. The station ground also covers an                                                                     To discuss the content of this plan with a
 area outside of Torbay, which form parts of Teignbridge                                                                   member of the fire service, please use the
 and South Hams District Councils. It covers an area of
                                                                                                                           contact details below:
 approximately 56.23 square kilometres and a
 population of 67,871. Approximately 1% of the
 population is made up of small ethnic groups composed                                                                     Name: Local Risk Manager Rod Schneider
 primarily of Asian, Black, Eastern European and other                                                                     Tel: 01392 456888
 ethnic groups.                                                                                                            Email: rschneider@dsfire.gov.uk

 The population figure will rise significantly with the influx                                                             For more information please visit
 of visitors during the holiday seasons. During the very                                                                   www.dsfire.gov.uk/yoursafety
 busy summer months, the population can swell to

www.dsfire.gov.uk                                                                                                                             V1.0 Published April 2018
Torquay Risk Profile 2018/19 3
Our Response
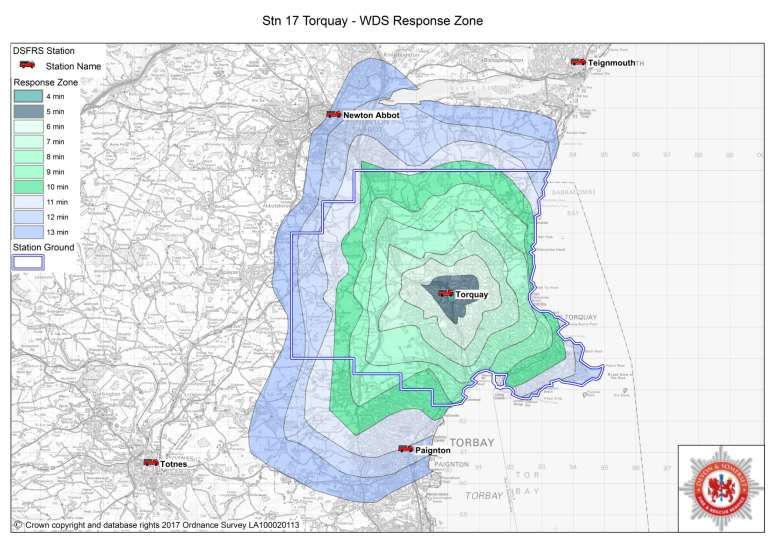
The map opposite shows an estimate
of how long the fire engine will take to
reach residents in Torquay from the
time they make the call. It will naturally
take us longer to get places further
away from the station.
Residents of Torquay should take the
following precautions to help keep
them safe from fire:
Fit a working smoke alarm
Take care when cooking and
never leave cooking food
unattended
Plan and practise your escape
route
Make a bedtime check
Don't overload your electrics
Put cigarettes right out
Use candles carefully
Have your chimney swept
regularly
www.dsfire.gov.uk V1.0 Published April 2018Torquay Risk Profile 2018/19 4
Prevention and Protection
We maintain a very simple philosophy that prevention is better than cure and we recognise that risk reduction begins with safe behaviours at home, at
work, or on the road, and this leads to a safer society for all. We have developed a community safety strategy to focus our work and set our levels of
resourcing where we have most risk. Using our knowledge, along with that of local organisations and partners we will target those people and
properties that are more likely to be affected by fire and other emergencies, according to our risk analysis and risk profiling. The risks identified at
Torquay station have been identified below, our prevention and protection work will be prioritised accordingly.
Youth
Health
Dwelling Business Road Community Water Development
& Heritage
Fires Safety Safety Resilience Safety & Community
Wellbeing
Cohesion
Risk Key
VERY HIGH HIGH MEDIUM LOW VERY LOW
www.dsfire.gov.uk V1.0 Published April 2018Torquay Risk Profile 2018/19 5
Our Incidents
The activity information for this local community area is shown in the tables below.
Incidents attended (within station area)
Five Year
Station - 17 Torquay 2012/13 2013/14 2014/15 2015/16 2016/17
Average
All Fires 253 280 182 231 209 231
Fires where people live (primary) 61 62 55 66 60 61
Fires where people work and visit (primary) 81 58 45 51 55 58
Fires - outdoor and refuse fires (secondary) 104 153 77 112 94 108
Chimney Fires 7 7 5 2 0 4
All False Alarms 390 372 307 315 303 337
False Alarms - Automatic Fire Alarms 240 237 184 203 226 218
False Alarms - Good Intent 132 125 106 101 70 107
False Alarms - Malicious attended 18 10 17 11 7 13
All Special Service Calls 231 236 190 227 233 223
Co-Responding 1 3 0 1 9 3
Road Traffic Collisions 38 28 26 51 39 36
Flooding & Water Rescues 31 21 10 18 22 20
Other Special Service calls 161 184 154 157 163 164
All Incidents 874 888 679 773 745 792
All Incidents minus False alarms 484 516 372 458 442 454
All Incidents minus False alarms and Co-Res. 483 513 372 457 433 452
Station Availability
In the 12 months from April 2016 to March 2017 the station was able to
crew the following appliances
% Hours
Hours Unavailable
Availability
Fire Engine 1 Wholetime 0 100.0%
Fire Engine 2 Wholetime / Retained 210.75 97.6%
Fire Engine 3 Retained 7168.25 18.2%
www.dsfire.gov.uk V1.0 Published April 2018Torquay Risk Profile 2018/19 6
Station Response Activity:
The table below shows the number of times the local fire station was called out (which may or may not have resulted in attending an incident). It also shows the
number percentage of calls on and off the station ground.
5 year
Station - 17 Torquay 2012/13 2013/14 2014/15 2015/16 2016/17
average
Total Turnouts 1437 1404 924 1026 1005 1159
Turnouts to incidents on Station Ground 1301 1240 791 875 821 1006
% of Turnouts to Incidents on Station Ground 90.5% 88.3% 85.6% 85.3% 81.7% 86.7%
% of Turnouts to incidents not on Station Ground 9.5% 11.7% 14.4% 14.7% 18.3% 13.3%
Station Demand 2012/13 - 2016/17*
The graphs below demonstrate the peak demand on the station in terms of time of the day and month of the year. (*Incidents in station area, not including false
alarms or co-responding)
Hour of the day Month of the year
60 90
Annual Number of Incidents
Annual Number of Incidents
80
50
70
40 60
50
30
40
20 30
20
10
10
0 0
0 1 2 3 4 5 6 7 8 9 10 11 12 13 14 15 16 17 18 19 20 21 22 23 Jan Feb Mar Apr May Jun Jul Aug Sep Oct Nov Dec
Hour of Day Month of Year
5 yr Average - Stn 17 2016/17 - Stn 17 5 yr Average - Stn 17 2016/17 - Stn 17
www.dsfire.gov.uk V1.0 Published April 2018You can also read


