California Department of Transportation(Caltrans)
←
→
Page content transcription
If your browser does not render page correctly, please read the page content below

California Department of Transportation(Caltrans)

Probabilistic Cost Estimating using Crystal Ball Software
               "You cannot exactly predict an uncertain future"
Presented By:
Jack Young
California Department of Transportation
Division of Engineering Services, Structure Cost Estimates
Caltrans Overview
         • Staff 0f 22,000-24,000 Employees
         • Headquarters, 12 Regional Districts
           and Division of Engineering
           Services(Structures)
         • 50,000 miles of freeway lanes
         • Supports Intercity Rail Service
         • Many miles of bicycle lanes
         • Maintains and Inspects 24,000
           State and Local Bridges
         • Nearly $10 Billion Dollars Under
           Contract in Construction
         Helpful Links:
         •   http://www.dot.ca.gov
         •   http://www.dot.ca.gov/hq/oppd/index.htm
         •   http://www.dot.ca.gov/hq/projmgmt/
         •   http://www.dot.ca.gov/hq/innovfinance/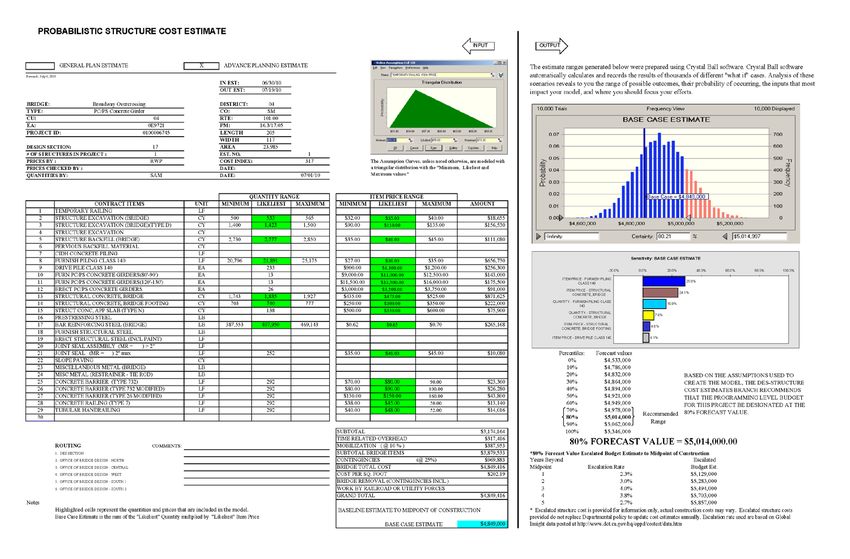
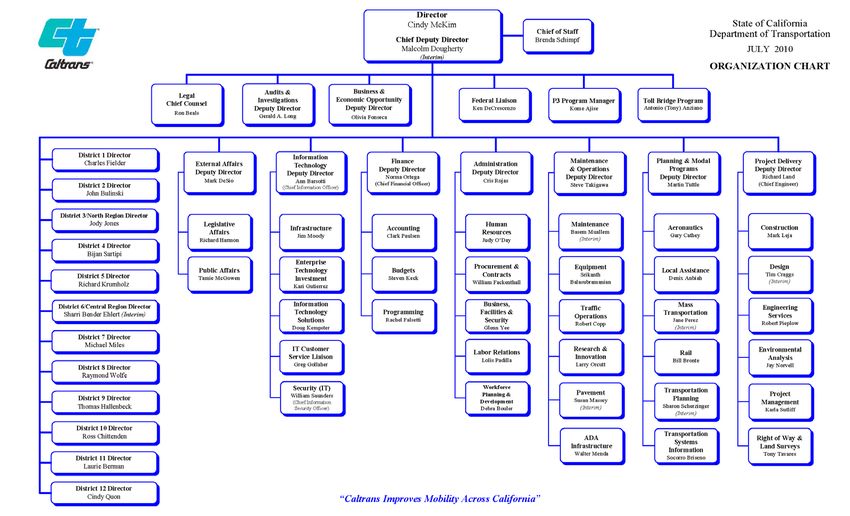
Caltrans Organization Chart

                  Structure Cost Estimates Branch
                            Jack Young
                      Senior Bridge Engineer
Population of California…44 Million People
Cost Estimation Approaches

Single Point Estimate Plus Contingency

  • History indicates a high likelihood that the final Project Costs
    will exceed the estimated amount.
  • To account for possible cost overruns, contingency amounts
    are added to the total estimate amount.
  • Unfortunately, there is no "probability" associated with the
    likelihood of meeting the programmed cost!

Probabilistic Cost Estimate

  • Reveals the full range of cost and associated probability of
    possible outcomes.
Why Traditional Spreadsheet Analysis Often Fails

 • Traditional spreadsheet analysis uses a single value
   (like the average) to represent uncertain or variable
   inputs.

 • The results are static or deterministic and most likely
   will be unrepresentative of the range of possible
   outcomes.

        For example, if it takes you an average of 1.5 hours to
        get to the airport and thru security and you leave 1.5
        hours before your flight takes off, you will miss your
        plane ~ 50% of the time.
Probabilistic Cost Estimate
    "Challenges and Opportunities"

• Cost Estimators recognize that uncertainty and risk will occur.

• Cost estimates are not static or deterministic. They are
  forecasts that have a range of possible outcomes.
  Understanding the implications of these ranges leads to more
  accurate decisions.

• Can Estimators develop a standard process for risk analysis
  that identifies "challenges and opportunities" and also
  quantifies risk in unit pricing?
Probabilistic Cost Estimate
          What is a Model?

A model is a combination of data and logic constructed to
predict the behavior and performance of a process.

Crystal Ball software works with spreadsheet models,
specifically Microsoft Excel.

  A model is a spreadsheet that has taken the leap from
  being a data organizer to a predictive analysis tool.
Probabilistic Cost Estimate
               "What is Risk?"

Uncertainty about a situation can often indicate risk, which
is the possibility of loss, damage, or any other undesirable
event.

Most Project Managers and Estimators desire low risk,
which would translate to a high probability of success and
cost savings.
Probabilistic Cost Estimate
              "What is Uncertainty?"

Uncertainty is assessed in cost estimate models for the purpose
of estimating the risk (probability) that a specific funding level
may or may not be exceeded.

Points to keep in mind when analyzing risk:

How likely is the risk?
How significant is the risk?
Where is the risk?
How do I manage the risk?
A Better Way To Analyze Uncertainty
Simulation with Crystal Ball
• Use ranges as inputs
• Thousands of outcomes with associated
certainty
• Easy to analyze and communicate
Range
What-if Analysis
• Even increments of values
of • Multiple outcomes but no associated probabilities
Outcomes • Difficult to analyze and very time consuming
Range Estimates
• Most-likely, best-case, worst-case 3 outcomes
Single point estimate
• One representative value as input 1 outcome
Value of Analysis (Betterness)Probabilistic Cost Estimate
"Simulation"
What is Simulation?
The application of models to predict future outcomes
with known and uncertain inputs.
Why use Simulation?
Measure the behavior of the outcomes given changes
in the inputs.
Simulation can be considered a probabilistic framework for analysisWhat is Monte Carlo simulation?
Inputs:
• A computer simulation of N trials calculating multiple (hundreds,
thousands) scenarios of your model by repeatedly sampling
random combinations of your uncertain inputs.
Outputs:
• Sampling statistics characterize output variation
(mean, standard deviation, etc.)
• Predict and Quantify ranges of output(probability/forecast of cost)
• Identify primary variation drivers (sensitivity analysis)How Does Crystal Ball Appear in MS Excel?
Toolbar
Define Menu Run Menu Analyze Menu
Setup
Views results and
simulation creates reports
Runs the simulationWhich Assumption Curves Do I Use?
• Use distributions based on past historical data or More realistic,
physical principles (normal, log-normal) Less conservative
• Use expert opinion to develop triangular distribution
(Minimum, Most Likely, Maximum value)
• Use bounds with uniform distribution
(Minimum, Maximum value)
Less realistic,
More conservativeStructure Cost Estimate - Crystal Ball Example
• Apply or develop probability curves to a historical
data set
• Build a model identifying potential threats and
opportunities
• Simulate project bidding 10,000 times using Monte
Carlo Simulation
• Develop a probabilistic estimate forecast including
a range of likely final costs with associated
confidence levels
• Conduct sensitivity analysis and determine largest
contributors to cost varianceOverview - Crystal Ball Cost Estimate Model
(Input and Output)MODEL INPUT
ASSUMPTION CURVE - INPUT
FORECAST CHART - OUTPUT
FORECAST PERCENTILES - OUTPUT
SENSITIVITY CHART - OUTPUT
In Summary:

Probabilistic Cost Estimate - Pros:
• Forecast results reveal the full range of cost and probability of possible
  outcomes.
• Sensitivity analysis indicates which inputs drive most of the output
  variation (threats and opportunities).
• Forces the Estimator to refine the historical item cost data.
• Employs "quantitative" risk management strategies in unit pricing.
• Transparent and defensible input and report output results.
• Excellent backup for cost estimate certification.
• Premium reporting and charting features for Executive summaries.
• Potential to reduce cost estimate contingencies.
• User friendly software(Excel Overlay).
Crystal Ball Software Uses in
 Transportation Project Cost Estimating
FHWA-Cost Estimate Reviews:
• Cost Estimate Reviews (Mega projects)
   Marin-Sonoma Narrows, I-5 HOV, I-10 HOV, I-215 HOV,
  I-405 HOV, Caldecott 4th Bore Tunnel Project, Doyle Drive, etc.

California Department of Transportation
Division of Engineering Services – Structures

• Development of all phases of structure cost estimates

• Depositions

• Transparent/Defensible Back-Up for Cost Estimate Certification

• QC/QA/IQA Practices
You can also read