Analysis and Investigation of a Brown Ground Layer from North Italy in the Seventeenth Century - Derek Zable, Seattle University Dr. Tami Lasseter ...

 
CONTINUE READING
Analysis and Investigation of a Brown Ground Layer from North Italy in the Seventeenth Century - Derek Zable, Seattle University Dr. Tami Lasseter ...
Analysis and Investigation of
a Brown Ground Layer from
     North Italy in the
    Seventeenth Century
          Derek Zable, Seattle University
Dr. Tami Lasseter Clare, PSU, Principal Investigator
       Dr. Vanessa Johnson, PSU, Mentor

                 August 13th, 2021
               REU Symposium 2021
Analysis and Investigation of a Brown Ground Layer from North Italy in the Seventeenth Century - Derek Zable, Seattle University Dr. Tami Lasseter ...
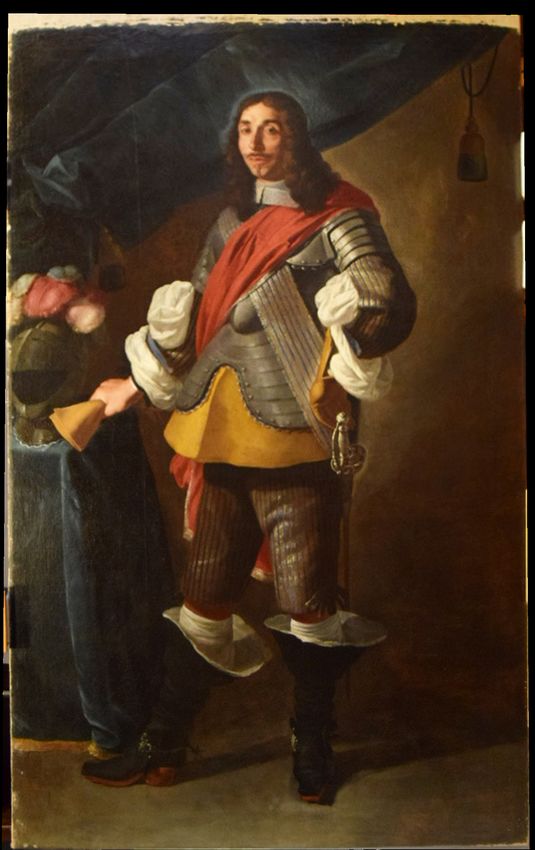
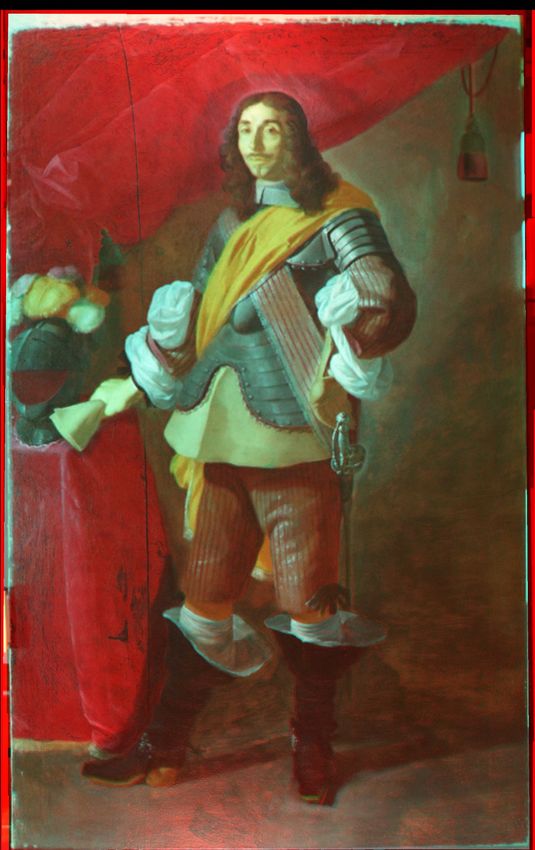
THE PORTRAIT OF BARON
   IGNAZIO DE PIZZIS

• A Swagger portrait

 • A full-body painting with extra emphasis and
   detail placed on the clothing of the model.

• Dimensions: 83.75” x 51.75” inches

• Painted by Carlo Ceresa

• Uses a brown-beige ground layer
Analysis and Investigation of a Brown Ground Layer from North Italy in the Seventeenth Century - Derek Zable, Seattle University Dr. Tami Lasseter ...
CARLO CERESA (1609-1679)
                               • Trained and worked near Bergamo, Italy, a
                                   northern city.1

                               • Known for his portraits and religious artwork, such
                                   as portraits for chapels and altar restoration.2

                               • Otherwise, much is unknown about his life.

1Langmuir,   E. Palazzo Moroni and Accademia Carrara. The Burlington Magazine 1983, 125, 782-783+785.
2Vertova,   L. Additions to Carlo Ceresa. The Burlington Magazine 1995, 137, 599-607.
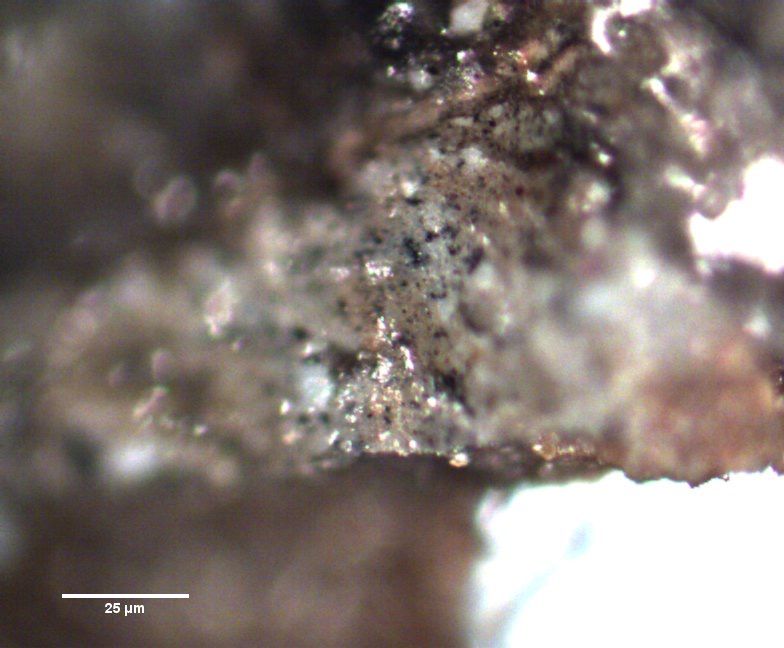
Analysis and Investigation of a Brown Ground Layer from North Italy in the Seventeenth Century - Derek Zable, Seattle University Dr. Tami Lasseter ...
GROUND LAYERS OF
                       PAINTING
• The ground is the layer used to prepare a
  support or canvas for painting.
• The ground layer can affect the colors and
  tones of art.3
    • A white ground layer is often preferred due
      to high contrast with other colors.
• Right: A cross section of the ground layer
  of “The Portrait of Baron Ignazio de Pizzis”
  encased in Bioplastic

  3Ground.   The National Gallery. https://www.nationalgallery.org.uk/paintings/glossary/ground.
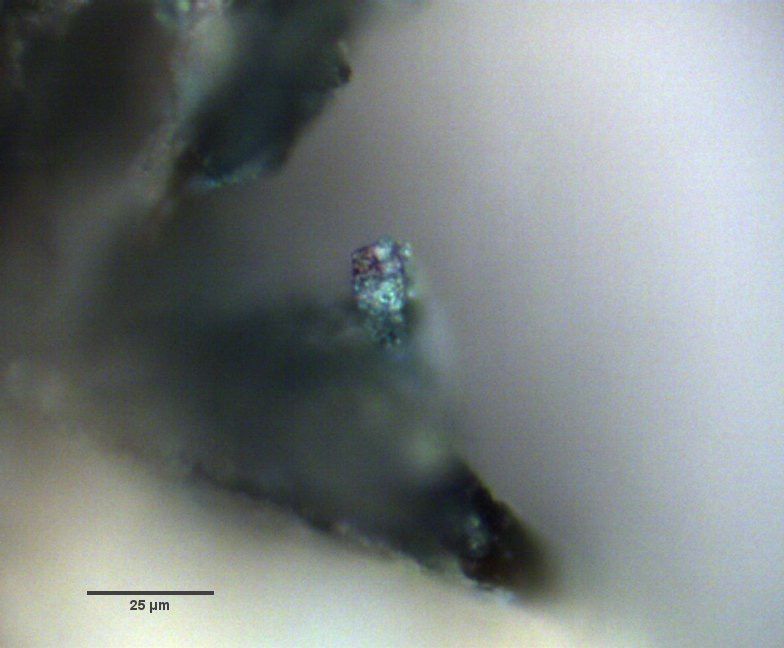
Analysis and Investigation of a Brown Ground Layer from North Italy in the Seventeenth Century - Derek Zable, Seattle University Dr. Tami Lasseter ...
PROJECT GOAL

   To investigate the         The bigger goal: to learn
  composition of the           more about the brown
Portrait of Baron Ignazio     ground layer used in the
de Pizzis, specifically the      portrait, as well as
blue paints and ground        connecting it to a larger
           layer.                historical context.
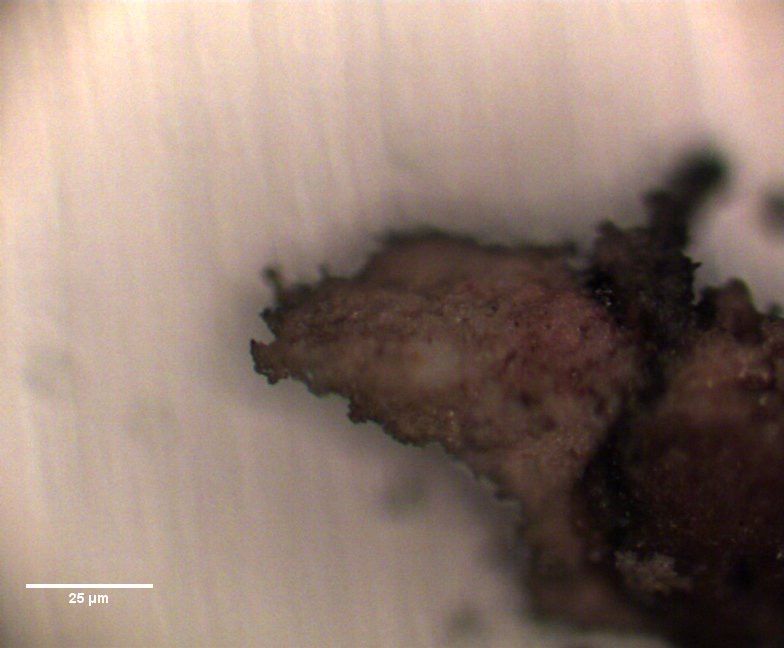
Analysis and Investigation of a Brown Ground Layer from North Italy in the Seventeenth Century - Derek Zable, Seattle University Dr. Tami Lasseter ...
Analytical Methods

Infrared Reflectography            Raman
and Infrared False Color        Spectroscopy               X-Ray Fluorescence

• Easy method of           • Uses Raman scattering      – Detects elements in the
  detecting                  to identify molecules in     paint and ground layers
  compositional              the paints.                  of the portrait.
  differences in the       • Uses a high intensity
  portrait.                  laser to knock off         – Measures fluorescence
                             incident light and           released when orbitals
• Uses heat lamps            measure the Raman            relax after having a
  which emit IR waves        scattering.                  core electron knocked
  to measure IR                                           off.
                           • All samples were
  reflection by the          measured at 50x
  materials on the                                      – Spectra were taken at
                             magnification.
  painting.                                               40kV, 7.6 µA, and a live
                                                          time of 60 seconds.
Analysis and Investigation of a Brown Ground Layer from North Italy in the Seventeenth Century - Derek Zable, Seattle University Dr. Tami Lasseter ...
IRR
• We can see a black and white
  image of the portrait with different
  tones of gray, representing
  differences in IR absorption.
• The area around the head is
  shaded similarly to the background
  of the portrait, despite being a part
  of the drapes.
Analysis and Investigation of a Brown Ground Layer from North Italy in the Seventeenth Century - Derek Zable, Seattle University Dr. Tami Lasseter ...
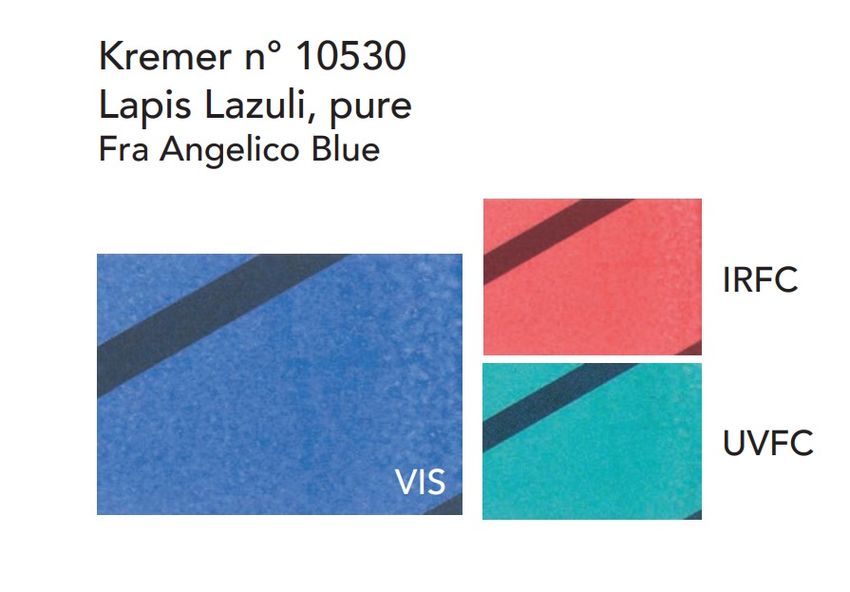
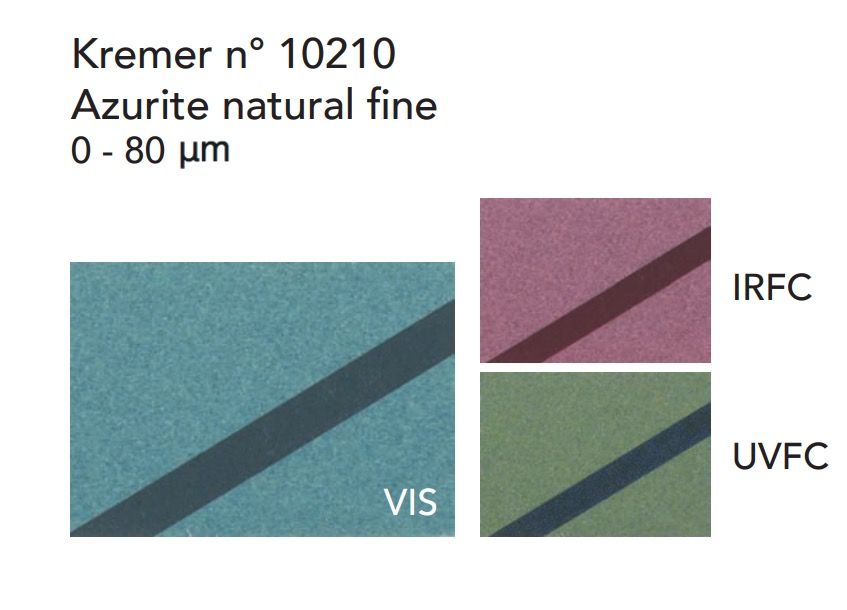
IRFC

IRFC database references taken
from:
Boust, C.; Wohlgelmuth, A.
HistoricalPigments_BLUE_170920:
Pigments under UV and IR radiations,
in Scientific imaging for cultural
heritage, ISSN 2609-780X,
18/08/2017, copa.hypotheses.org/552.
Analysis and Investigation of a Brown Ground Layer from North Italy in the Seventeenth Century - Derek Zable, Seattle University Dr. Tami Lasseter ...
545
                                                                                                                                                                           Ceresa_blue_microsample_6
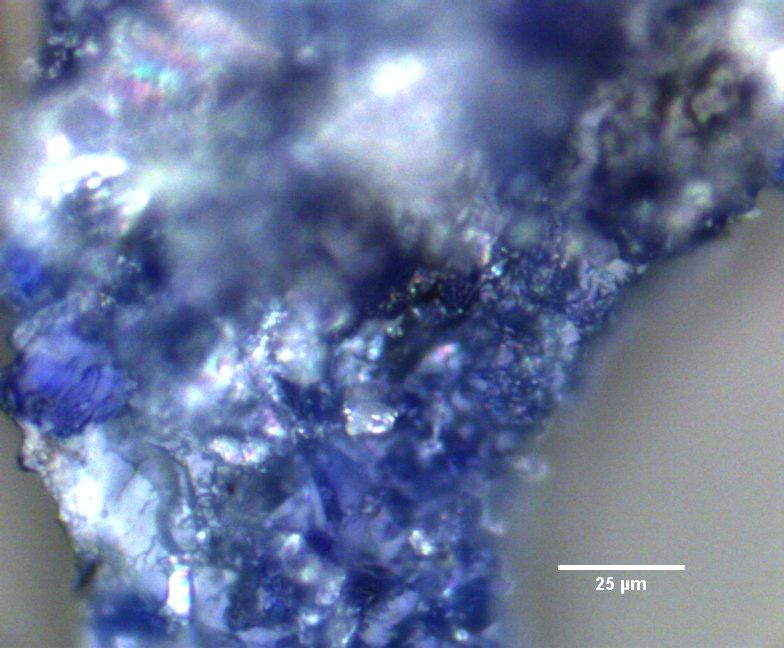
  RAMAN
                                                                                                          8000

  MICROSCOPY                                                                                              6000

                                                                                                 Counts
– Top: The Raman spectra                                                                                  4000                             1091
produced by analyzing a                                                                                                                                             1638
                                                                                                                                                                             1905
                                                                                                                                                                                       2184

pigment sample of the blue trim                                                                                              581
                                                                                                                                   806
                                                                                                                                                      1357

of the armor with a 532 nm laser                                                                          2000
                                                                                                                 257

and at 25% intensity.

                                                                                                                       500               1000                1500               2000            2500
– Down: Image of the pigment                                                                                                                                    -1
                                                                                                                                                Raman shift (cm )
sample being analyzed.

– The Raman spectrum for the
blue sample is nearly identical to
spectra in literature for lapis lazuli,
with strong peaks at 545 and
1091 cm-1.4

4González-Cabrera,  M.; Arjonilla, P.; Domínguez-Vidal, A.; Ayora-Cañada, M.J. Natural or
synthetic? Simultaneous Raman/luminescence hyperspectral microimaging for the fast distinction
of ultramarine pigments. Dyes Pigm. 2020, 178, 108349
Analysis and Investigation of a Brown Ground Layer from North Italy in the Seventeenth Century - Derek Zable, Seattle University Dr. Tami Lasseter ...
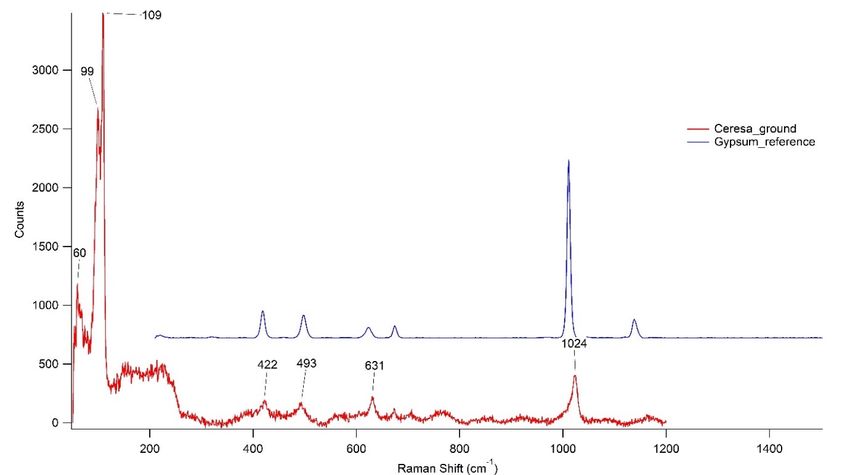
RAMAN MICROSCOPY
(CONT.)

• Top: Raman spectrum of the ground
  layer at 785 nm & 50% intensity with a
  reference spectrum of gypsum.5
• Bottom Left: Region where Raman was
  applied.
• Bottom Right: Image of a different
  region of ground layer that produced
  no spectrum.
• SERS was attempted on the ground
  layer but failed due to fluorescence.

5RRUFFdatabase. Berlin, Germany 2015. http://rruff.info/ X050099/display=default/
(accessed August 11, 2021).
• Top: The Raman spectrum of a cross section of
RAMAN MICROSCOPY                                                                                 the drapery with baseline correction taken at 785
                                                                                                 nm and 10% intensity. A lazurite and azurite6

(CONT.)                                                                                          spectrum are superimposed onto the spectrum
                                                                                                 for comparison.
                                                                                               • Bottom: Image of the cross section of the drapes
                                                                                                 where Raman analysis was applied.

6RRUFF   database. Berlin, Germany 2015. http://rruff.info/R050638/display=default/ (accessed August 11, 2021).
• Left: the Raman spectrum of a cross section of

RAMAN MICROSCOPY                                                                           the red sash was taken at 785 nm and10%
                                                                                           intensity with baseline correction. A cinnabar
                                                                                           reference spectrum7 is superimposed on the
(CONT.)                                                                                    spectrum.
                                                                                         • Right: The image of the region of Raman
                                                                                           analysis with its contrast enhanced by 1.00%
7RRUFF   database. Berlin, Germany 2015. http://rruff.info/ R050072/display=default/ (accessed August 11, 2021).
XRF FILTER AND REGIONS
                               XRF Filter    Location

                                                                               Sleeve       Sleeve        pink   shoe
                                             blue trim   drapes   left iris                                              sash
                                                                              (ground)   (blue stripe)   plume    sole
                                No filter       x                                             x
                               Blue filter      x          x         x           x                         x      x
                               Red filter                                                     x                           x

                               Due to a limitation of time, not every region was able to be
                               analyzed with XRF with each filter used. The tracer has a working
                               distance of a centimeter.

An example of XRF setup with   Blue Filter = 1 mil of titanium
the tracer and the portrait.   Red Filter = 12 mil aluminum, 1 mil of titanium, 1 mil of copper
No Filter XRF Normalization and
                              Background Subtractions
                      3
            40x10

                     30
                                                               Pb L-Alpha
Intensity (counts)

                                                                                           Pb L-Beta
                                                                                                        Sleeve_Blue Stripe
                                                                                                        Armor_Blue Trim

                     20

                                                  Fe K-Alpha
                     10          Ca K-Alpha

                      0

                          0                   5                        10                          15                  20
                                                                            Energy (keV)
Blue Filter XRF with Normalization
                                          and Background Subtraction

                         3
                     20x10

                                          Blue Armor Trim
                                          Blue Drapes                                                            Pb L-Alpha
                                          Left Iris
                                          Left Sleeve ground
                        15                Pink Plume
                                          Sole of the Toe                                                                            Pb L-Beta
Intensity (Counts)

                                                                           Cu K-Alpha
                        10
                                                                                        Cu K-Beta

                                                                                                    Hg L-Alpha
                                                                    Fe K-Beta

                         5                                                                                               Hg L-Beta
                                                       Fe K-Alpha

                             Ca K-Alpha

                         0
                                    4                          6                   8     Energy (keV)     10                  12                 14   16
Red Filter XRF with Normalization
                                and Background Subtraction

            6000

            5000

                                                          Pb L-Alpha
                                                                           Pb L-Beta
            4000
                                                                                             Sleeve_Blue Stripe
Intensity

                                                                                             Shoulder_Sash

            3000

                                             Hg L-Alpha
            2000                                              Hg L-Beta
                   Fe K-Alpha

                         Fe K-Beta
            1000
                                Cu K-Alpha

              0
                   6                 8              10             12 Energy (keV) 14   16                  18    20
Region             Conclusion                 XRF                 Raman

          Drapes              Azurite & Lapis lazuli     [Ca], Fe, Cu, Pb      Azurite & Lapis lazuli

          Armor trim          Lapis lazuli and lead      Fe, [Cu], Pb          Lapis Lazuli

          Sash                Vermilion and lead         Fe, [Cu], Hg, Pb      Vermilion

RESULTS   Left iris           Lead and vermilion         Fe, Hg, Pb            Not analyzed

          Ground                    Unknown              [Ca], Fe, Pb          Gypsum

          Sleeve stripe    Lapis lazuli (?) Vermilion (?) [Ca], Fe, [Hg], Pb   Not analyzed

          Pink plume          Vermilion and lead         Fe, Hg, Pb            Not analyzed

          Shoe sole               Unknown              Fe, Cu, Pb              Not analyzed
          Minor elements are presented in brackets [ ]
DISCUSSION
• There is lapis lazuli in the armor trim (the obtained Raman spectra matches Raman
  spectra in literature8)
• IRFC indicates lapis lazuli in the drapes,9 but the high abundance of copper indicates
  azurite in XRF. Raman analysis indicates a mix of the two blue pigments.
• The ground layer had gypsum in Raman analysis. The fluorescence of gypsum is likely
  drowning out signal from other molecules in the ground.
• The high presence of lead could be either lead white or red lead being mixed with
  various other pigments in the portrait.
• No graphite was found in the ground layer during Raman analysis, but it could still be
  present (the black spots in the sample). While it was not found, it is not conclusive that
  graphite is absent.

8González-Cabrera,   M.; Arjonilla, P.; Domínguez-Vidal, A.; Ayora-Cañada, M.J. Natural or synthetic? Simultaneous Raman/luminescence hyperspectral
microimaging for the fast distinction of ultramarine pigments. Dyes Pigm. 2020, 178, 108349.
9Boust, C.; Wohlgelmuth, A. HistoricalPigments_BLUE_170920: Pigments under UV and IR radiations, in Scientific imaging for cultural heritage, ISSN 2609-780X,

18/08/2017, https://copa.hypotheses.org/552.
CONCLUSIONS & FUTURE WORK
• Lapis lazuli was found in the armor trim through Raman analysis.
• Vermilion was found in the sash and plumes by Raman and XRF.
• No graphite was found in the ground layer but could still be present as black spots
  were found in a cross section of the ground layer.
• Further study into the brown-beige ground layer would provide historical context into
  art as current analysis cannot move past the gypsum signals found in the Raman
  analysis
• Analysis of other paintings from North Italy during the seventeenth century and other
  works by Ceresa would further understanding about the style of art at the time in
  Italy and how his artwork fits in Italian and art culture.
– The National Science      This research was sponsored by:
                     Foundation
                   – PSU REU
                      – Dr. Jun Jiao
ACKNOWLEDGEMENTS      – Dr. Erik Sánchez
                      – Siri Vegulla
                   – Nina Olsson & PAM
                   – Dr. Tami Lasseter Clare
                   – Dr. Vanessa Johnson
                   – Lasseter Clare Lab
You can also read