Chemical, Elemental and Structural Analysis of Batteries - Application Compendium
←
→
Page content transcription
If your browser does not render page correctly, please read the page content below

Chemical, Elemental and
Structural Analysis of Batteries
Application Compendium

Contents                                Contents
Imaging techniques for          Raman Ex situ Raman Analysis of Lithium Ion Batteries                                                3
2D/3D morphology
                                           In situ Raman Analysis of Lithium Ion Batteries                                           6

                                           Raman Analysis of Lithium-Ion Battery Components – Part I: Cathodes                     10

                                           Raman Analysis of Lithium-Ion Battery Components – Part II: Anodes                      14

                                           Raman Analysis of Lithium-Ion Battery Components – Part III: Electrolytes               19

                                   SEM Investigate batteries with a SEM for better performance                                     22

                               microCT Uncovering Internal Structure Defects in Lithium Ion Battery Foils                          25

Bulk analysis                       XPS Analysis of Electrode Materials for Lithium Ion Batteries                                  27

                 Ion Chromatography Determination of Electrolyte Solution from Lithium Ion Battery                                 30

                                           Determination of Dissolved Manganese in Lithium/Manganese Oxide Battery Electrolyte 35

                              ICP-OES Simultaneous Determination of Impurities and Major Elements in Lithium-ion
                                      Battery Cathodes                                                                             39

                                GC-MS Orbitrap GC-MS Technology Provides New Insight into
                                      Lithium Ion Battery Degradation                                                              44

The global lithium-ion battery market is expected to reach           are mainly used to study the 2D and 3D morphology of battery
93.1 billion USD by 2025. This is largely driven by increased        components at different stages in the life cycle. 3D imaging
usage in electric vehicles, grid storage, and portable consumer      provides complete geometric evolution of the cathode micro-
electronics where the higher energy density of the lithium-ion       structure upon cycling. Geometric parameters such as volume
battery offers a clear advantage.                                    fraction, surface area, particle size distribution and tortuosity
                                                                     are typically assessed using a combination of microCT and FIB–
Increases in battery performance requires the development
                                                                     SEM techniques.
of new battery components as well as understanding and
addressing the mechanisms that result in performance                 Spectroscopy, NMR, X-ray diffraction and mass spectrometry
degradation with repeated charging and discharging cycles.           are key to studying the evolution of structural and chemical
Evaluation of batteries and battery components requires              changes and the defect formation in battery electrodes. These
a variety of analytical methods that study materials and             techniques permit the analysis of electrode materials as they
component surfaces at various scales.                                change during the redox reactions; and give information on both
                                                                     crystalline and amorphous phases. Local differences in Raman
As the world leader in advancing science, Thermo Fisher
                                                                     spectral changes can create a state-of-charge (SOC) distribution
Scientific provides the widest range of analytical instrumentation
                                                                     map showing the composite electrode. The composition of the
for battery analysis and product formulation, including X-ray
                                                                     solid electrolyte interface (SEI) is commonly studied with ex situ
photoelectron spectroscopy (XPS/ESCA), electron microscopy
                                                                     XPS and in situ FTIR and Raman spectroscopy to monitor the
(SEM, TEM and FIB-SEM), vibrational spectroscopy (FTIR,
                                                                     SEI formation.
Raman and NIR), mass spectrometry (GC-MS, HPLC, LC-MS,
HREMS-MS, ICP-MS), microCT, nuclear magnetic resonance               Rheology and viscometry systems measure the dispersiveness
(NMR), X-ray diffraction, X-ray fluorescence, rheometry,             and coating capability of battery materials in an electrode slurry.
viscometry, extrusion and torque rheometry.                          Torque rheometers deliver information about melting behavior,
                                                                     influence of additives on processability and temperature or
Imaging techniques such as Raman, microCT, and electron
                                                                     shear stability; all critical parameters for the production of
microscopy cover the full length scale from the cell level with
                                                                     polymer separators.
Raman and microCT down to the atomic scale with TEM. Raman
imaging can be used to observe the distribution of components        This compendium of application notes provides in-depth
and to monitor how these components change during the                reports on analyses aimed at improving the performance of
charging/discharging cycles. MicroCT and electron microscopy         lithium-ion batteries.

Find out more about Thermo Fisher Scientific capabilities for batteries at thermofisher.com/energy
Ex situ Raman Analysis of Lithium Ion Batteries

APPLICATION NOTE

Ex situ Raman Analysis of
Lithium Ion Batteries
Author
Dick Wieboldt, Ph.D., Thermo Fisher Scientific, Madison, WI, USA
Key Words
Anodes, Ex Situ Analysis, Lithium Ion Battery, Raman
Microscopy, Raman Imaging
Abstract
The needs of the Li-ion battery
customers can be segmented into in situ
and ex situ modes of analysis. Ex situ
analysis lets researchers study battery
components removed from the operating
battery cell.
Introduction
Analysis of battery materials with Raman spectroscopy has
been around for quite some time. During the 1960s, researchers
used Raman to elucidate many of the fundamental spectral
features of the minerals and inorganic materials widely used in
battery research today.1,2 Raman is a good fit for these materials
because many of the characteristic vibrational and rotational
                                                                     are most interested in characterizing failure modes and a better
modes occur in the low-wavenumber region of the spectrum
                                                                     understanding of performance differences. For example, what
typically accessible only by far-infrared measurements. In that
                                                                     makes one production run work better than another, and why did
day and age, both Raman and far-infrared measurements
                                                                     one battery fail yet its siblings from the same batch worked fine.
were time consuming and difficult experiments.
                                                                     To answer these questions, researchers carefully disassemble
Analysis Techniques: In situ Versus Ex situ
                                                                     a battery cell so the individual components can be examined.
The term in situ is used to describe experiments where the
                                                                     This type of analysis is termed ex situ because the battery
battery components are studied in an assembled cell under
                                                                     components are removed from the operating battery cell. The
operating conditions. Think of in situ as a window on the case
                                                                     goal is to prepare the samples for analysis in as close to a native
of a battery which lets you see the chemistry of what goes on
                                                                     state as possible.
when you charge and discharge a battery.
                                                                     Battery disassembly for ex situ analysis is carried out in an inert
While in situ cells provide valuable information, their use
                                                                     environment such as an argon filled glove box to protect the
is generally targeted at research and development of new
                                                                     battery components from moisture and oxidation. For example,
materials for Li-ion batteries. Once a formulation is designed, a
                                                                     the anode, separator, cathode sandwich must be carefully
candidate battery is scaled up through pilot production to actual
                                                                     separated and rinsed to remove excess electrolyte.
product samples. At this stage of development, researchers
Once the samples are prepared, they must be kept in an inert                          As you might expect, it is a messy business to extract electrodes
environment to protect against changes during analysis. When                          from a used battery so the SEI can be studied. It takes great care
space is available, instruments are installed inside the glove box                    to prepare the sample so as to preserve its integrity for ex situ
so the samples can be analyzed. In most cases, the sample                             analysis. This is usually achieved by working in an argon filled
must be removed from the glove box and transferred to an                              glove box to prevent sample degradation due to atmospheric
external instrument for analysis. This is where an ex situ transfer                   exposure. A transfer cell with window is used to seal the sample
cell becomes a key component of the workflow. It preserves the                        in the inert argon environment so it can be removed from the
inert environment around the sample so it can be studied.                             glove box for analysis using a Raman microscope.
From Single Point Measurements to                                                     Experimental
Raman Imaging                                                                         Anode samples from a disassembled Li-ion battery were cut and
The majority of published research on Li-ion battery Raman                            mounted in a Thermo Scientific™ transfer cell so that a cross-
work is based on single point measurements acquired over time                         section of the anode could be imaged.
during charge/discharge cycles. Single point measurements
                                                                                      The transfer cell (Figure 1) maintains an inert environment
can be misleading because there is no way of knowing if the
                                                                                      surrounding the sample so it can be analyzed using instruments
sampled point is representative of the entire electrode. It is
                                                                                      outside a glove box. The cell body accepts
important to make multiple measurements to be sure. Because
                                                                                      a variety of industry standard sample holders (stubs) developed
the Raman signals are weak, it takes many minutes to generate
                                                                                      for scanning electron microscope (SEM) analysis. A 90° stub
enough signal-to-noise ratio at each measurement point. A
                                                                                      was used to hold the cut edge of the anode facing the window.
complete, multi-point experimental can be quite time consuming
                                                                                      A cap containing a calcium fluoride (CaF2) window seals the
to complete.
                                                                                      sample under an argon blanket. The cap is screwed on until
Today, Raman imaging is a viable alternative which lets you                           the window height is just above the sample. This provides a
quickly makes thousands of measurements over                                          minimum working distance between a microscope objective and
an area of the electrode rather than just single point                                the sample. A short working distance is an advantage because
measurements. Each pixel in a Raman image is a complete                               it allows the use of high magnification objectives having a large
Raman spectrum. This technique provides confidence in                                 numerical aperture (N.A.).
understanding if changes are heterogeneous or hot spots.
                                                                                      Raman spectra were collected over a single 76 µm × 160 µm
The following experimental results demonstrate the flexibility of                     area at spatial resolution of 1.0 µm per pixel using a Thermo
using Raman imaging for the ex situ analysis                                          Scientific™ DXR™xi Raman imaging microscope. Laser power
of Li-ion batteries and their components.                                             at the sample was 2.0 mW at 532 nm with a 0.2 sec exposure
                                                                                      time and 4 image scans. An Olympus™ 50× long working
Characterization of Li-ion Anodes
                                                                                      distance, 0.5 N.A. microscope objective was used to focus
After safety concerns, a leading area of interest in Li-ion
                                                                                      through the transfer cell window. Higher laser powers and/or
battery research is understanding the cause of performance
                                                                                      longer exposure times were avoided because they can heat
degradation over time. Research indicates the solid electrolyte
                                                                                      the sample causing changes which mask the native state of
interphase (SEI) layer formed on the surface of the electrode
                                                                                      the electrode.
is key to performance. The SEI layer is formed by deposition
of organic and inorganic compounds during the first several
charge/discharge cycles.4 It stabilizes the electrode from
further decomposition and promotes reversible capacity.
Because of the complexity of the SEI layer, results from any
and all analytical techniques contribute to an incremental
understanding of its behavior.

Figure 1: Transfer cell maintains sample in an inert environment for ex situ analysis of Li-ion battery materials
Results
A Raman image is a hyperspectral data set with each pixel in
the image being a complete Raman spectrum. Using a variety
of spectral processing techniques, this hyperspectral Raman
data generates image contrast pertaining to specific chemical
features. This capability is used to visualize minute differences
within a sampled area.
A variety of chemical images can be created from each data set
showing changes within the sampled area. For this experiment,
image contrast is generated by multivariate curve resolution
(MCR) analysis. MCR finds the major components within
                                                                                                       Figure 2: Cross section view of a Li-ion battery anode. Raman image indicates
each image and a different color is assigned to each. This is                                          a difference in the anode coating on each side. Inset Raman spectra are color
analogous to the use of dyes in biological fluorescence imaging                                        coded to the areas in the Raman image.
which tag different parts of a cell.
Alternatively, multiple regions of the sample can be imaged and                                        Conclusion
the Raman spectral data within each region can be averaged to                                          The high sensitivity of Raman imaging is a benefit for Li-ion battery
produce a single spectrum. In this mode, the Raman imaging                                             analysis. Ex situ Raman imaging measurements give results with a
data set is used as a means of homogenizing any differences in                                         higher degree of confidence compared to single points.
the electrode area. This average spectrum represents a single
                                                                                                       References
point measurement yet each point represents a 30 µm square
                                                                                                       1. P. Tarte, J. Inorg. Nucl. Chem. 29(4) 915–923 (1967).
compared with the typical 1 µm sample area from a standard
Raman microscope.                                                                                      2. W
                                                                                                           .B. White, B.A. De Angelis, Spectrochimica Acta Part A
                                                                                                          23(4) 985–995 (1967).
Figure 2 is a micrograph of the anode cross section. The copper
current collector is in the center with anode material coated on                                       3. R. Baddour-Hadjean, J.P. Pereira-Ramos, Chemical Reviews
both surfaces. Superimposed is the Raman image created from                                                110(3) 1278–1319 (2010).
the spectral differences shown by the inset Raman spectra.
                                                                                                       4. A
                                                                                                           . Chagnes and J. Swiatowska, Electrolyte and Solid-
The Raman image clearly shows that the coating on one side of
                                                                                                          Electrolyte Interphase Layer in Lithium-Ion Batteries, Lithium
the copper current collector is dominated by carbon black (red)
                                                                                                          Ion Batteries – New Developments, Dr. Ilias Belharouak
whereas the other side has a much greater density of the active
                                                                                                          (Ed.), ISBN: 978-953-51-0077-5, InTech, (2012). Available
graphite phase (blue).
                                                                                                          from: http://www.intechopen.com/books/lithium-ion-
This example demonstrated the advantage of Raman imaging                                                  batteries-newdevelopments/electrolyte-and-solid-electrolyte-
over traditional single point measurements. The major                                                     interphase-layer-in-lithium-ion-batteries .
differences in the two coatings could easily have been missed
by single point measurements depending on where the points
were measured.

Find out more at thermofisher.com/energy

© 2019 Thermo Fisher Scientific Inc. All rights reserved. All trademarks are the property of Thermo Fisher Scientific and its subsidiaries
unless otherwise specified. AN52677-EN-03-2019
In situ Raman Analysis of Lithium Ion Batteries

APPLICATION NOTE

In situ Raman Analysis of
Lithium Ion Batteries
Author
Dick Wieboldt, Ph.D., Thermo Fisher Scientific, Madison, WI, USA
Ines Ruff, Ph.D., Thermo Fisher Scientific, Dreieich, Germany
Matthias Hahn, Ph.D., El-Cell GmBH, Homburg, Germany
Key Words
Electrodes, In Situ Analysis, Lithium Ion Battery, Raman
Microscopy, Raman Imaging
Abstract

The needs of the Li-ion battery
customers can be segmented into in
situ and ex situ modes of analysis. In
situ analysis allows researchers to follow
changes in a battery cell during its
charge and discharge cycles. Recent
improvements in Raman sensitivity
enable these changes to be imaged on
a dynamic time scale.                                                  Analysis Techniques: In situ Versus Ex situ
Introduction                                                           The term in situ is used to describe experiments where the
The use of Raman spectroscopy for analysis of battery materials        battery components are studied in an assembled cell under
has been around for years. During the 1960s, researchers used          operating conditions. Think of in situ as a window on the
Raman to elucidate many of the fundamental spectral features           case of a battery which lets you see the chemistry of what
of the minerals and inorganic materials widely used in battery         goes on when you charge and discharge a battery. There are
research today.1,2 Raman is a good fit for these materials             very few commercially available cell designs compatible with
because many of the characteristic vibrational and rotational          spectroscopic measurements. Researchers have resorted to
modes occur in the low-wavenumber region of the spectrum               building their own cells to meet the needs of their experimental
typically accessible only by far-infrared measurements. In that        apparatus. Examples of such designs have been published
day and age, both Raman and far-infrared measurements were             along with experimental results.4-10
time consuming and difficult experiments.
Advances in instrumentation have greatly increased the ease-of-
use of Raman making it a much more approachable technique.
New areas of application ensued such as the exploding interest in
rechargeable lithium ion batteries. Many researchers are involved
and have published careful studies of materials specifically related
to Li-ion batteries as well as next generation batteries. A review
article by Baddour-Hadjean published in 2010 is an excellent
resource for those wishing to get up-to-speed in this field.3
The focus of this application note is on the in situ application of
Raman spectroscopy as it pertains to battery research.
In situ cells analysis is generally targeted at research and              Today, Raman imaging is a viable alternative which lets you
development of new materials for Li-ion batteries. Once a                 quickly makes thousands of measurements over an area of
formulation is designed, a candidate battery is scaled up through         the electrode rather than just single point measurements. Each
pilot production to actual product samples. At this stage of              pixel in a Raman image is a complete Raman spectrum. This
development, researchers are most interested in characterizing            technique provides confidence in understanding if changes are
failure modes and a better understanding of performance                   heterogeneous or hot spots.
differences. For example, what makes one production run work
                                                                          The following experimental results demonstrate the flexibility of
better than another, and why did one battery fail yet its siblings
                                                                          using Raman spectroscopy for in situ analysis of Li-ion batteries
from the same batch worked fine.
                                                                          and their components.
To answer these questions, researchers carefully disassemble
                                                                          Lithiation of Graphite
a battery cell so the individual components can be examined.
                                                                          Graphite is widely used as an anode material for rechargeable
This type of analysis is termed ex situ because the battery
                                                                          Li-ion batteries.
components are removed from the operating battery cell. The
goal is to prepare the samples for analysis in as close to a native       During the Li-ion battery charging cycle, positively charged
state as possible. Please see the companion application note for          Li+ ions move from cathode through the electrolyte, across
details on ex situ analysis.                                              a separator into the anode to balance the flow of electrons in
                                                                          the external circuit (Figure 1). This process of Li+ ions entering
From Single Point Measurements to
                                                                          the graphitic structure of the anode is called intercalation.
Raman Imaging
                                                                          Intercalation causes changes in the anode structure – primarily a
The majority of published research on Li-ion battery
                                                                          swelling of the graphite structure.
in situ Raman work is based on single point measurements
acquired over time during charge/discharge cycles. An example             Experimental
is the excellent work done by Kostecki’s group at Lawrence                The experimental setup for this example consists of a Thermo
Berkeley National Lab.11                                                  Scientific™ DXR™xi Raman imaging microscope and an EL-
                                                                          CELL® ECC-Opto-Std optical electrochemical cell. This cell
Single point measurements can be misleading because there is
                                                                          enables the investigation of batteries in a so-called sandwich
no way of knowing if the sampled point is representative of the
                                                                          configuration where the working electrode (WE) material is
entire electrode. It is important to make multiple measurements
                                                                          placed under a sapphire (Al2O3) window. Electrode material
to be sure. Because the Raman signals are weak, it takes
                                                                          (graphite powder in this example) is spread onto a copper grid
many minutes to generate enough signal-to-noise ratio at each
                                                                          serving as the current collector. This WE is sandwiched from
measurement point. A complete, multi-point experiment can be
                                                                          below, with a glass fiber separator soaked with the electrolyte
quite time consuming to complete.
                                                                          solution and lithium metal as the counter electrode (CE).
                                                                          The Raman beam from the microscope objective impinges onto
                                                                          the backside of the WE material through the sapphire window
                                                                          (Figure 2). The advantage of investigating the backside of the
                                                                          electrode is that the pathway for the Raman beam is minimized,
                                                                          allowing the use of high magnification objectives, optimizing
                                                                          spectra quality. The drawback is the gradient of lithiation
                                                                          concentration along the depth of the electrode. Accordingly, the
                                                                          electrode must be charged very slowly in order to minimize this
                                                                          unwanted gradient.
                                                                          The graphite electrode was cycled at a constant rate of
                                                                          approximately 0.06 C. The C-rate is measure of how rapidly a
Figure 1: Movement of Li+ ions balance electrons during the charge and
                                                                          battery is charged/discharged. This rate of 0.06 C corresponds
discharge cycles of a Li-ion battery                                      to 33 hours for a full charge/discharge cycle between 1.5 and
                                                                          0.005 V against Li/Li+. Raman imaging was carried out during
                                                                          the initial 480 minutes of the charging (lithiation) process only.
                                                                          Raman spectra were collected over a 30 µm × 30 µm
                                                                          area at 1 µm pixel spacing using 2 mW of 532 nm laser
                                                                          excitation, a 0.01 sec exposure time for each pixel, and
                                                                          50 scans per image. Higher laser powers and/or longer
                                                                          exposure times resulted in burning of the graphite and boiling of
                                                                          the electrolyte.

Figure 2: Experimental setup for the in situ example showing the
electrochemical cell mounted on the stage of a Raman imaging microscope
Results
A Raman image is a hyperspectral data set with each pixel in
the image being a complete Raman spectrum. Using a variety
of spectral processing techniques, this hyperspectral Raman
data generates image contrast pertaining to specific chemical
features. It is this capability that visualizes minute differences
within a sampled area. By collecting a sequence of Raman
images, we now have the ability to monitor changes in both
space and time. As mentioned earlier, a variety of chemical
images can be created from each data set showing changes
within the sampled area. Alternatively, the Raman spectral
data within each data set can be averaged to produce a single
spectrum for each time slice. In this mode, the Raman imaging
data set is used as a means of homogenizing any differences in
the electrode area. This average spectrum represents a single
point measurement yet each point represents a 30 µm square                 Figure 3: Different views rendered from the time lapse hyperspectral Raman
compared with the typical                                                  data provide a wealth of experimental information
1 µm sample area from a standard Raman microscope.
In Figure 3, the 3D view (bottom left) shows changes in the
Raman spectrum as a function of time over 8.3 hours (1–500
min). During this time, the battery cell is in the charging (lithiation)
process only. This portion of the electrochemical cycle is shown
in the lower right of Figure 3.
The spectrum of graphite exhibits a prominent peak at 1580
cm-1 attributed to the E2g2 mode (G band). At potentials
between 0.42 and 0.31 V (specific charge 33 and 45 mAh/g),
the band gradually disappears along with the simultaneous
emergence of a peak centered at 1590 cm-1. This peak shift is
attributed to the Li+ ions intercalated into the graphite structure.
This is more easily seen in the center, 2D Raman image. The
inset shows Raman spectra before and after the change.
Towards the end of the charge cycle at 8.3 hours (496 min),
where the voltage is less than 0.15 V (specific charge greater
than 146 mAh/g), a strong Raman band centered at 154 cm-1
begins to appear. This Raman band has not been previously                  Figure 4: Raman images from different time slices in the graphite lithiation
reported so its assignment is not conclusive. Strong Raman                 experiment

bands in this region have been attributed to TiO2, Sb, and metal
chlorides.
The type of views shown in Figure 3 are “spectrum-centric”
because they show changes in the Raman spectra captured
at different times during a time based analysis. Figure 4 shows
another way of exploring the same Raman imaging data set from              It can be challenging to visualize the information content with
an alternative “image-centric” point-of-view. Here, we are not as          such a massive wealth of data. Figure 4 shows just three frames
interested in the Raman spectrum itself but rather its use as a            to demonstrate this type of analysis. The changes are easier to
tool to enhance differences within the image (image contrast).             grasp using a time lapse viewer of the complete time sequence:
In Figure 4, Raman images are presented in which the image                 • 3D time lapse: http://youtu.be/Ic0MFAB5U4M
contrast is generated by multivariate curve resolution (MCR)
                                                                           • Time lapse: http://youtu.be/geq6mbYVARE
analysis. In this case, MCR finds the differences not only within
each image but also across the entire time sequence. A different
color is assigned to each resolved component. This is analogous
to the use of dyes in biological fluorescence imaging which
tag different parts of a cell. Each image is from the same 30
µm square portion of the anode. The blue MCR component is
indicative of the 1580 cm-1 band; green the 1590 cm-1 band;
yellow the 154 cm-1 band; red represents carbon black, a
conductivity enhancer.
Conclusion                                                                                             References
The high sensitivity of Raman imaging is a benefit for Li-ion                                          1. P. Tarte, J. Inorg. Nucl. Chem. 29(4) 915–923 (1967).
battery analysis. In situ Raman imaging techniques show the
                                                                                                       2. W
                                                                                                           .B. White, B.A. De Angelis, Spectrochimica Acta Part A
spatial distribution of phase changes in electrodes over time.
                                                                                                          23(4) 985–995 (1967).
This is a capability that was not possible with single point
measurements using traditional Raman microscopy.                                                       3. R. Baddour-Hadjean, J.P. Pereira-Ramos, Chemical Reviews
                                                                                                           110(3) 1278–1319 (2010).
                                                                                                       4. T
                                                                                                           . Gross, C. Hess, J Power Sources 256, 220–225 (2014).
                                                                                                       5. P
                                                                                                           . Novák, D. Goers, L. Hardwick, M. Holzapfel, W. Scheifele,
                                                                                                          J. Ufheil, A. Wursig, J Power Sources 146, 15–20 (2005).
                                                                                                       6. C.M. Burba, R. Frech, Applied Spectroscopy 60(5), 490–493
                                                                                                       (2006).
                                                                                                       7. E. Markevich, V. Baranchugov, G. Salitra, D. Aurbach, M.
                                                                                                           Schmidt, J Electrochem Soc 155(2), A132–A137 (2008).
                                                                                                       8. Y
                                                                                                           . Luo, W.B. Cai, X.K. Xing, D.A. Scherson, Electrochem.
                                                                                                          Solid-State Lett. 7(1), E1–E5 (2004).
                                                                                                       9. T. Gross, L. Giebeler, C. Hess, Rev. Sci. Instrum. 84(7),
                                                                                                           073109-1–073109-6 (2013).
                                                                                                       10. K
                                                                                                            . Hongyou, T. Hattori, Y. Nagai, T. Tanaka, H. Nii, K. Shoda,
                                                                                                           Power Sources 243, 72–77 (2013).
                                                                                                       11. J. Lei, F. McLarnon, R. Kostecki, J. Phys. Chem. B, 109(2),
                                                                                                            952–957 (2005).

Find out more at thermofisher.com/energy

© 2019 Thermo Fisher Scientific Inc. All rights reserved. All trademarks are the property of Thermo Fisher Scientific and its subsidiaries
unless otherwise specified. AN52676-EN-03-2019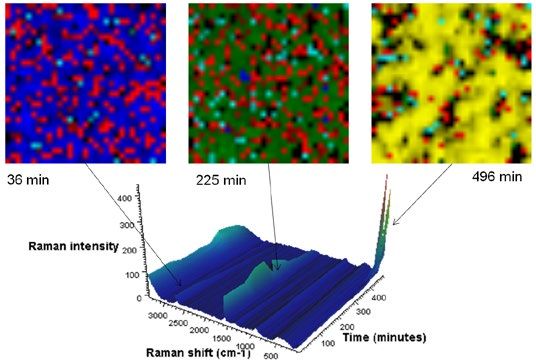
Raman Analysis of Lithium-Ion Battery Components – Part I: Cathodes

                                                                                         APPLICATION NOTE AN52443

Raman analysis of lithium-ion battery components
Part I: Cathodes
Author
Robert Heintz, Ph.D., Thermo Fisher Scientific
Madison, WI, USA

Keywords
DXR 2 Microscope, cathodes, lithium-ion battery,
Raman

Introduction
In recent years the increasing demand for powering
portable electronic devices from laptops to smart phones
has driven the need for improved battery performance
but the emergence of electric and hybrid vehicles is
creating additional interest in new battery technologies.
The expanding use of portable energy storage introduces          molecular structure or local chemical environments.
additional factors beyond just improving battery capacity.       The spectral results can usually be correlated with the
Cost, safety, and environmental impact are important             electrochemical performance.
considerations as the use of battery technology evolves.
Lithium-ion batteries offer the highest energy density and       There have been significant improvements in commercial
output voltage among commercial rechargeable battery             Raman instrumentation over the last several years.
systems.1 Even though lithium-ion batteries are now an           Important advances in both hardware and software
established technology there is still considerable interest in   have made modern Raman instruments much more
improving the current technology and the development of          user friendly and removed many of the obstacles that
new battery components.                                          in the past made routine use of Raman spectroscopy
                                                                 arduous for users with limited expertise. Advances
Evaluation of batteries and battery components                   in instrumentation also include integration of light
requires a variety of analytical methods not only for the        microscopes with Raman instrumentation which allows
development of new materials but also for gaining a              spectroscopic analysis of samples at the microscopic
greater understanding of the mechanisms involved in              level. Modern Raman instruments, like the Thermo
charge/discharge cycles. Bulk analysis of components             Scientific™ DXR™ 2 Raman microscope, are fully
is important but it is also important to understand              integrated, high performance research grade instruments
surface interactions and interfaces. Electrochemical             that have incorporated extensive automation to simplify
evaluation of cells includes conductivity measurements,          the collection of Raman spectra. For example, automated
electrochemical stability of components, cell capacity, ion      on-demand alignment and calibration present on the
mobility, discharge rates, and cycling behavior Materials        DXR 2 microscope, is designed to eliminate the need
characterization of the various cell components can              for manual realignment and calibration and results in an
include many different analytical techniques (examples:          instrument that is easy to use and maintain at its highest
XRD, SEM, TEM, TGA, DSC, EDS) but one technique                  level of performance. This ease of use means it is much
that is rapidly growing in popularity for the analysis of        quicker to get started and straightforward to get accurate
materials is Raman spectroscopy. Raman spectroscopy              results. This opens up the use of Raman spectroscopy for
has many advantages but the most important for battery           all types of users.
applications are ones that involve subtle changes in
Raman has been used for the analysis of many different Fd3m material.1 The mapping data was collected using a
types of battery components. This includes analysis of DXR 2 Raman microscope with a motorized stage and a
cathode materials, anode materials, and electrolytes.2,3 532 nm laser. Thermo Scientific™ Atlμs™ software allows
Part one of this series will focus on some examples for easy collection and analysis of Raman maps and is
of how Raman spectroscopy has been utilized for the part of the Thermo Scientific™ OMNIC™ software used
analysis of cathode materials. This article is in no way with the DXR 2 Raman microscope. The material with the
meant as a complete review of the literature. That is ordered spinel structure (P4332) displays lower electrical
beyond the scope of this application note. Included here conductivity compared to the materials with the normal
are some interesting examples from published papers that spinel structure (Fd3m) so it is important to have an easy
illustrate how Raman spectroscopy has been used for the way to distinguish between these phases.4 This illustrates
analysis of cathode materials. how the DXR 2 Raman microscope can be used for fast
easy evaluation of molecular structure.
Developing new cathode materials for lithium ion batteries
has been a very active area of research. LiCoO2 is the
classical cathode material for lithium ion batteries but
there are issues with the cost, safety, and toxicity of
this material. The manganese spinel, LiMn2O4, is a low
cost alternative that is safer and is more environmentally
friendly. This cathode material is used in some commercial
lithium ion cells. The issue with the use of this material is
that the cathodes suffer from capacity fade over time. One
main contribution to this capacity fading appears to result
from manganese (Mn) dissolution via a disporportionation
reaction of MnIII at high potentials. This dissolution can be
suppressed by doping the material with other transition
metals. An example of this can be seen in some interesting
work on mixed metal spinels (LiNi0.5Mn1.5O4 and LiNi0.5-
x
Mn1.5-yMx+yO4 M = Cr, Al, Zr).4 Raman spectroscopy was Figure 1: Raman spectra of the two phases of LiNi0.5Mn1.5O4. Spectra
used to analyze the molecular structures of these spinels. were collected using a DXR 2 Raman microscope and a 532 nm laser.
LiNi0.5Mn1.5O4 can be obtained in two different phases Adapted with permission from Xialong Zhang, Fangyi Cheng, Kai Zhang,
Yanliang Liang, Siqi Yang, Jiang Liang, Jun Chen, RSC Advances, 2,
depending on the synthesis conditions. The Raman 2012, 5669–5675. Copyright 2012 RSC Publishing
spectra from the two different phases of LiNi0.5Mn1.5O4 are
shown in Figure 1.1 These Raman spectra were collected
using a DXR 2 Raman microscope configured with a
532 nm laser. The peaks in the spectrum of the P4332
material are sharper and stronger and the peak near
580–600 cm-1 (the T2g peak of the spinel) is split into two
compared to the single peak in the spectra of the Fd3m
material.4 The structures of the two phases have space
groups corresponding to Fd3m (normal spinel) and P4332
(ordered spinel). These phases show poor contrast in the
XRD but were distinguishable using Raman spectroscopy.1
Figure 2 illustrates how different reaction conditions
can lead to different phases.4 Doping the material with
aluminum (Al) or zirconium (Zr) favors the formation of the
ordered spinel structure whereas doping with chromium Figure 2: Raman spectra of LiNi0.5Mn1.5O4 synthesized under various
(Cr) favors the normal spinel structure (see Figure 3).4 conditions. (1) Annealed at high temperature, (2) Quenched, (3)
calcined at lower temperature. Spectra were collected using a Thermo
Utilizing the differences in the Raman spectra it is also Scientific™ Nicolet™ Almega™ XR dispersive Raman spectrometer
possible to evaluate the spatial distribution of phases in equipped with a 633 nm laser. Adapted with permission from Si Hyoung
a sample by mapping the sample. Figure 4 shows an Oh, Kyung Yoon Chung, Sang Hoon Jeon, Chang Sam Kim, Won Il Cho,
Byung Won Cho, J. Aloys Compd. 469, 2009, 244–250. Copyright 2009
example of this where there are only a couple of small Elsevier Publishing
particles of the P4332 phase present in a larger field of thecyclability and high-rate capacity compared to regular
LiMn2O4 cathodes.5 The enhanced capacity and cycling
behavior was attributed to the morphology providing short
ionic diffusion distances and a structure that could more
readily accommodate the lattice expansion and contraction
associated with repeated lithium ion intercalation and
deintercalation. A DXR 2 Raman microscope was used
to confirm the spinel structure (Fd3m) of the material and
was also used to monitor the stability of the material after
multiple charge/ discharge cycles.5
Doping LiCoO2 with other transition metals has been
investigated as a way of improving cathode materials
Figure 3: Raman spectra of Zr, Al, and Cr doped LiNi0.5Mn1.5O4.
(1) and (2) Cr doped (Fd3m structure); (3) and (4) Al doped (P4332 (cost, safety, performance, environmental impact). An
structure); (5) Zr doped (P4332 structure). Spectra were collected using example of this is the class of materials with the following
a Nicolet Almega XR dispersive Raman spectrometer configured with a
general formula, Li[Mn1-x-yCoxNiy]O2. Raman spectroscopy
633 nm laser. Adapted with permission from Si Hyoung Oh, Kyung Yoon
Chung, Sang Hoon Jeon, Chang Sam Kim, Won Il Cho, Byung Won Cho, can be used to monitor the structure of these types of
J.Alloys Compd. 469, 2009, 244–250. Copyright 2009 Elsevier Publishing materials as well. It has been reported in a paper that
the Raman spectra of the material changed when the
lithium content increase from Li[Mn0.45Co0.40Ni0.15]O2 to
Li1.15[Mn0.45Co0.40Ni0.15]O2.6 Figure 5 shows the Raman
spectra of these cathode materials.6 Increasing the lithium
content decreased the electrostatic repulsion between
adjacent layers in the structure and resulted in an increase
in the Raman intensity and a shift to higher wavenumbers.
The change in the Raman spectrum with lithium content
illustrates the utility of Raman spectroscopy for monitoring
lithium content in these types of materials.
Figure 4: A Raman map showing the distribution of the two different
spinel phases in a sample. The red-yellow locations (such as location 2)
indicate areas of the P4332 phase whereas the blue-green areas (such as
location 1) represent areas of the Fd3m phase. Mapping data collected
using a DXR 2 Raman microscope with a motorized stage and Atlμs
software. Adapted with Permission from Xialong Zhang, Fangyi Cheng,
Kai Zhang, Yanliang Liang, Siqi Yang, Jiang Liang, Jun Chen, RSC
Advances, 2, 2012, 5669–5675. Copyright 2012 RSC Publishing
An alternative approach to doping with other transition
metals is to synthesize materials with different Figure 5: The Raman spectra of (a) Li1.15[Mn0.45Co0.40Ni0.15]O2 and (b)
morphologies. The approach is typically to target Li[Mn0.45Co0.40Ni0.15]O2. Peak shift and intensity change with change in
lithium content. Spectra collected using a Nicolet Almega XR dispersive
nanoscale materials because the smaller particles and Raman spectrometer configured with a 532 nm laser. Adapted with
higher surface areas tend to improve the electrochemical premission from Tao Wang, Zong-Huai Liu, Lihong Fan, Yinfeng Han,
properties of the materials. An example of this is the Xiuhua Tang, Powder Technology, 187, 2008, 124–129. Copyright 2008
Elsevier Publishing
report that porous nanorods of LiMn2O4 gave enhancedThere are different ways of trying to improve the These are just a few examples to illustrate how Raman
properties of cathode materials. In addition to doping spectroscopy can be used for the study of cathode
and morphology changes an alternative approach is to materials. This was not meant as a comprehensive review
coat the cathode with a more conductive material to form of the literature. There are certainly other applications in
a hybrid material. This can change the solid electrolyte the literature beyond those included here. The intent was
interface (SEI) and can improve the perfor- mance of to encourage and inspire the use of Raman spectroscopy
the cathode. Li(Li0.2Mn0.54Co0.13 Mn0.13)O2 is a member for the analysis of battery components. Raman provides
of a class of layered materials with the general form of a fast and efficient way to identify materials and confirm
Li2MnO3 · LiMO2 (M = Mn, Ni, Co). These materials have molecular structure. It can be used on a wide variety of
attracted attention because of high theoretical capacities materials and can be used for both bulk analysis and
up to 250 mAh/g.7 The problem is they have poor rate the study of surfaces and interfaces. It has proven itself
capacities and cycling behavior. as an important analytical method for the analysis of
battery components The DXR 2 Raman microscope is a
Constructing hybrid composite materials with graphene high-performance Raman microscope in an easy to use
improves the cycling stability and gives enhanced high package that puts Raman spectroscopy in the reach of
rate capacity. A DXR 2 Raman microscope fitted with any user.
a 532 nm laser was used to monitor the structure of
the Li(Li0.2Mn0.54Co0.13 Mn0.13)O2 material and provided References
evidence for the incorporation of graphene in the hybrid 1. Xialong Zhang, Fangyi Cheng, Kai Zhang, Yanliang Liang,
material. Peaks for both the inorganic oxide material Siqi Yang, Jiang Liang, Jun Chen, RSC Advances, 2, 2012,
and the graphene derived coating were observed in the 5669–5675.
Raman spectra. Figure 6 shows the Raman spectra of 2. Raman Analysis of Lithium Ion Battery Components –
Part II: Anodes, Thermo Scientific Application Note.
the cathode material before and after the reaction with
3. Raman Analysis of Lithium Ion Battery Components –
graphene.7 The significant D band indicates substantial
Part III: Electrolytes, Thermo Scientific Application Note.
defects from the idealized graphene structure. There are
4. Si Hyoung Oh, Kyung Yoon Chung, Sang Hoon Jeon,
many possible contributions to this defect peak including Chang Sam Kim, Won Il Cho, Byung Won Cho, J. Alloys
small domains sizes and vacancies in the graphene Compd. 469, 2009, 244–250.
sheets. The existence of defects is not unexpected and 5. Fangyi Cheng, Hongbo Wang, Zhiqiang Zhu, Yan Wang,
in some applications can be advantageous. For instance, Tianran Zhang, Zhanliang Tao, Jun Chen, Energy Environ.
increased disorder in graphene anodes has been Sci., 4, 2011, 3668–3675.
correlated with increased lithium ion capacity.8 6. Tao Wang, Zong-Huai Liu, Lihong Fan, Yinfeng Han, Xiuhua
Tang, Powder Technology, 187, 2008, 124–129.
7. Ke-Cheng Jiang, Xing-Long Wu, Ya-Xia Yin, Jong-Sook
Lee, Jaekook Kim, Yu-Guo Guo, ACS Appl. Mater.
Interfaces, 4(9), 2012, 4858–4863.
8. Timothy N. Lambert, Claudia C. Luhrs, Carlos A. Chavez,
Stephen Wakeland, Michael T. Brumbach, Todd M. Alam,
Carbon, 48, 2010, 4081–4089.
Figure 6: The Raman spectra of Li(Li0.2Mn0.54Co0.13Mn0.13)O2 (LMNCO)
and the graphene enwrapped hybrid material (LMNCO-G). Spectra were
collected using a DXR 2 Raman Microscope and a 532 nm laser. Adapted
with premission from Ke-Cheng Jiang, Xing-Long Wu, Ya-Xia Yin, Jong-
Sook Lee, Jaekook Kim, Yu-Guo Guo, ACS Appl. Mater. Interfaces, 4(9),
2012, 4858–4863. Copyright 2012 American Chemical Society
Find out more at www.thermofisher.com/energy
©2019 Thermo Fisher Scientific Inc. All trademarks are the property of Thermo Fisher Scientific and its subsidiaries unless otherwise
©2018 Thermo Fisher Scientific Inc. All trademarks are the property of Thermo Fisher Scientific and its
specified. AN52443_E 03/18M
subsidiaries unless otherwise specified. AN52443_E 03/18MRaman Analysis of Lithium-Ion Battery Components – Part II: Anodes
APPLICATION NOTE AN52444
Raman analysis of lithium-ion battery components
Part II: Anodes
Author
Robert Heintz, Ph.D., Thermo Fisher Scientific
Madison, WI, USA
Keywords
DXR 2 Microscope, anodes, carbon, graphene,
lithium-ion battery, Raman
Introduction
From laptops and mobile phones to power tools and
hybrid vehicles the use of portable energy storage
devices is growing rapidly. As the number and types
of applications expand there is a constant demand for
expanding battery functionality. Different applications
impose their own requirements on the technology Raman spectroscopy probes molecular structure and
(potential, capacity, discharge rates, charging rates, life local chemical environments and it is very useful for not
time, operating conditions, etc.). With wide spread use only characterizing new anode materials but also for
there also comes greater concern with factors such as studying subtle changes in materials. The changes in
safety and environmental impact as well. the Raman spectra can be correlated with changes in
the electrochemical performance of the materials. The
The analysis of battery components is important not only development of easy to use but high quality Raman
for the development of new materials but also for the study instruments such as the Thermo Scientific™ DXR™ 2
of charge/discharge mechanisms and even for confirming Raman microscope means that Raman spectroscopy
the quality of materials used in battery production. The can be added as a routine analytical technique to any
complex nature of batteries requires a multifaceted laboratory. The DXR 2 Raman microscope is a high
combination of electrochemical analyses and materials performance Raman spectrometer integrated with a
characterization techniques. Raman spectroscopy has research quality light microscope to produce a powerful
emerged as an important analytical technique that can molecular spectroscopy instrument for spectroscopic
be used for the characterizing of a variety of battery investigations of samples on a microscopic scale. It also
components. Even though a considerable amount of work includes many automated features that save time and
has been done on the development and commercialization simplify data collection and analysis without sacrificing
of lithium-ion batteries there is still considerable interest in performance. Features like SMART backgrounds and
improving the current technology and the development of auto exposure save the user time when collecting spectra
new battery components. This application note will focus and assist with setting collection parameters. Automated
on examples of the analysis of anode materials for lithium- alignment and calibration routines optimize instrument
ion batteries. There are other application notes available performance with a minimal amount of effort. These are
that cover examples of the use of Raman spectroscopy just some of the time saving features found on the DXR 2
for the analysis of cathode and electrolyte materials.1,2 Raman microscope that make it easy to use and allow
The examples presented here are not meant to be an anyone to collect high quality Raman spectra.
exhaustive review of the literature but are intended to
illustrate the utility of Raman spectroscopy for the analysis
of battery components and in particular anodic materials.One of the classical anode materials for lithium ion structures due to negative charge transfer. This is an
batteries is graphite. The Raman spectrum obtained example of how Raman spectroscopy can be used to
from a graphite anode using a DXR 2 Raman microscope monitor the changes in the anode material with different
with a 532 nm laser is shown in Figure 1. Recently, states of the battery.
other allotropes of Carbon besides graphite have been
investigated for anode materials due to their novel An active area of research is the use of carbon coatings
physical and chemical properties. Raman spectroscopy to improve the electrochemical properties of other
is an excellent choice for analyzing the different allotropes potential anodic materials. These carbon coatings are
of carbon (see Figure 2).3 Many of these carbon allotrope used to improve properties like low conductivity and
materials are strong Raman scatters and have diagnostic cycling stability. Graphene composites have shown
spectral features. Raman spectra not only can be used improved electrochemical properties. High surface area
to distinguish different allotropes of carbon but also can graphene improves lithium ion intercalation. Also the
provide additional information on the molecular structure.4 presence of graphene at the interfaces decreases the
For example, Raman spectral data can be used to mechanical deterioration of anodes caused by large
determine the number of sheets of graphene in a stack, volume changes during cycling. One of the interesting
it can provide information on defects and disorder in the aspects of this is that when many other applications are
structure of graphene, and it can be used to determine trending toward the fabrication of defect-free graphene,
diameters of single wall carbon nanotubes.4,5 the presence of defects appears to be advantageous
for anode materials. The presence of defects due to
Raman spectroscopy can also be used to monitor edges and vacancies in the graphene actually improves
changes in anode materials during use. In one published the capacity and cycling stability because it provides
example a DXR 2 Raman microscope was used to study additional reversible storage sites for lithium ions.7 This
the insertion of lithium into a hard carbon anode.6 The means that the evaluation of defects in the graphene
G band (graphite type structure) of the anode material structures is important because it is directly related to the
displayed a slight shift to lower wavenumbers as the electrochemical properties. Raman spectroscopy can
lithium insertion increased with the state of charge provide relative defect concentrations and this is typically
(SOC) of the battery. This shift has been attributed expressed as the ratio of the defect peak (D band) to the
to a weakening of carbon bonds in the graphite type graphite peak (G band) (ID/IG).
Figure 2: Raman spectra of different forms
of carbon: (a) Graphite, (b) Single layer of
graphene, (c) Single walled carbon nanotube
(SWCNT), (d) Multi-walled carbon nanotube
(MWCNT), (d) Diamond like carbon (DLC).
Figure 1: Raman spectrum of a graphite These spectra were obtained using a DXR 2
anode collected using a DXR 2 Raman Raman microscope and a 532 nm laser.
microscope equipped with a 532 nm laserSilicon has been studied extensively as a promising The Raman spectrum of the SnO2/graphene composite
candidate as an anode material for lithium ion batteries material collected using a DXR 2 Raman microscope
because of its high theoretical capacity (4200 mAh/g).8 and a 532 nm laser showed both D and G bands
However, silicon electrodes undergo a large volume typically associate with carbon but the G band was
expansion/contraction during cell cycling and this slightly blue shifted compared with the graphene
volume change results in mechanical degradation sheet and graphene oxide peaks and this was taken
of the anode and a dramatic fading of capacity. The as evidence of electronic interactions between the
high potential capacity of the silicon anode has lead SnO2 nanorods and the graphite type structures of the
researchers to try to modify the surface of the silicon graphene sheets (see Figure 3).13
anode and thus the solid electrolyte interface (SEI) to
improve the cycling behavior. One approach that has
been reported is to coat the silicon anode surface with
carbon using a fullerene (C60) precursor.9 Analysis of
these thin films using a Thermo Scientific™ Nicolet™
Almega™ dispersive Raman spectrometer configured
with a 633 nm laser indicated that the carbon was no
longer in the fullerene form but displayed D and G bands
typical of other types of carbon coatings. The G band
comes from idealized graphite type carbon structures
and the D band represents defects edges, vacancies,
etc. from the graphite structure and can be either sp2
or sp3 hybridized carbon. The ID/IG ratio varied with the
plasma power used to create the coating and with boron
doping of the fullerene.10,11 Boron doping lowered the ID/IG
ratio with respect to the undoped materials with similar Figure 3: Hybrid anode material SnO2 and graphene sheet (GS).
deposition conditions. A similar approach was also Comparison of the peak location of the G band between graphene sheet
(GS), graphene oxide (GO), and the hybrid anode material (GS/SnO2).
carried out using diamond like carbon (DLC) films.12 In Raman spectra collected using a DXR 2 Raman microscope with a 532
the case of the DLC films the D and G bands overlapped nm laser. Adapted with permission from Chaohe Xu, Jing Sun, Lian Gao,
significantly but they were deconvoluted into the two J. Mater. Chem. 22, 2012, 975-979. Copyright 2012 RSC Publishing
components. Peak fitting software like Peak Resolve in
Thermo Scientific™ OMNIC™ software can be used to The composite material as well as the starting graphene
evaluate the relative contributions from these two types sheet showed significant D bands indicating substantial
of carbon. Coating the silicon anodes with these carbon disorder from the idealized graphene structure. This is
films provided more stable cycle performance along with probably not unexpected considering that the materials
high reversible capacity. were prepared hydrothermally and there are many
factors that could contribute to the defect concentration
Tin dioxide (SnO2) and tin disulfide (SnS2) are both (small domains, vacancies, functionality, etc.)
potentially useful anodic materials for lithium ion
batteries. These materials are interesting because they The Raman spectra of the SnS2/multi-walled carbon
have high theoretical capacities but like silicon they nanotube composite anode material displayed peaks
display a very large volume change during cycling and associated with nanosheets of SnS2 (131 (w) 212 (w),
thus suffer from mechanical degradation. To address 309 peak (s), 450–650 (b) cm-1) as well as peaks
this issue, nanoscale hybrids of these materials have associated with the carbon nanotubes (D and G
been investigated. In one report, nanorods of SnO2 bands) (see Figure 4).14 No peaks associated with SnS
were combined with graphene and in another, SnS2 were observed despite the fact that SnS powder was
nanosheets were combined with multi-walled carbon used as the precursor. The SnS2 nanosheet/MWCNT
nanotubes.13,14 In both of these cases the hybrid composites exhibited significantly better discharge
materials displayed improved high rate capacities and capacities and cyclability compared to the SnS2
enhanced cycling behavior. nanosheets alone.Figure 4: Raman spectrum of the SnS2/MWCNT composite material. Figure 5: (a) Raman spectrum of Li4Ti5O12 and (b) Raman spectrum of Peaks associated with both the SnS2 nanosheets and the multi-walled carbon coated-Li4Ti5O12. Raman spectra were obtained using a Nicolet carbon nanotubes are observed. Raman spectra collected using Almega XR dispersive Raman spectrometer configured with a 633 nm a Nicolet Almega dispersive Raman spectrometer. Adapted with laser. Adapted with permission from Ju Bin Kim, Dong Jin Kim, Kyung permission from Jin-Gu Kang, Gwang-Hee Lee, Kyung-Soo Park, Sang- Yoon Chung, Dongjin Byun, Byung Won Cho, Phys. Scr. T139, 2010. OK Kim, Sungjun Lee, Dong-Wan Kim, Jae-Gwan Park, J. Mater. Chem. Copyright 2010 IOP Publishing 22, 2012, 9330-9337. Copyright 2012 RSC Publishing Lithium transition metal oxides can be used as anodes These are few examples illustrating how Raman for lithium batteries as well as cathodes. Li4Ti5O12 has spectroscopy can be used to analyze anode materials the spinel structure and has been used as an anode for lithium-ion batteries. Many anode materials involve material for lithium ion batteries. It does not have the some form of carbon and Raman spectroscopy has high theoretical capacity (175 mAh/g) that materials like proven itself very useful for the analysis of carbon based silicon have but it is a zero strain insertion material which materials. Not only can Raman spectroscopy be used to means it shows only a very small change in volume differentiate one form of carbon from another but it also during charge/discharge cycles.15 It has excellent cycle can provide detailed structural information. However, the characteristics. However, it has a poor rate capacity utility of Raman spectroscopy does not stop with carbon and low conductivity. Similar approaches (morphology, based materials and it can also be used to probe the doping, and coating) have been reported to improve structure of other materials. Transition metal oxides and the conductivity of Li4Ti5O12. One example of this was tin disulfide examples were included in this application detailed in a paper on how the conductivity of Li4Ti5O12 note. The versatility of use with many different types of was improved by generating a carbon composite materials and the extraordinary structural information that material. Raman spectroscopy was used to confirm it can provide make Raman spectroscopy an ideal choice that the structure of the Li4Ti5O12 was retained in the for the analysis of battery components. The DXR 2 hybrid material and that carbon had been incorporated Raman microscope allows for spectroscopic analysis on in the material (see Figure 5).15 The Raman spectra a microscopic scale. Advances in Raman instruments, obtained using a Nicolet Almega XR dispersive Raman such as the DXR 2 Raman microscope, make them easy spectrometer with a 633 nm laser also showed the D and to use while still providing high quality Raman data. Easy G bands typically associated with graphitic type carbon access to high quality Raman data is one reason for the and disordered carbon structures were present. growing number of Raman applications.
References
1.     Raman Analysis of Lithium Ion battery Components –
       Part I: Cathodes, Thermo Scientific Application Note:
       52443.
2.     Raman Analysis of Lithium Ion battery Components –
       Part III: Electrolytes, Thermo Scientific Application Note:
       52445.
3.     Joe Hodkiewicz, Characterizing Carbon Materials with
       Raman Spectroscopy, Thermo Scientific Application Note:
       51901, 2010.
4.     Joe Hodkiewicz, Characterizing Graphene with Raman
       Spectroscopy, Thermo Scientific Application Note: 51946,
       2010.
5.     Joe Hodkiewicz, Technical Reference Chart for Common
       Calculations Involving Raman measurements with Carbon
       Nanomaterials, Thermo Scientific Technical Note: 51964,
       2010.
6.     H. Hori, M. Shikano, S. Koike, H. Sakaebe, Y. Saito,
       K. Tatsumi, E. Ikenaga, Abstract #117, The 15th
       International Meeting on Lithium Batteries, IMLB 2010, The
       Electrochemical Society.
7.     Timothy N. Lambert, Claudia C. Luhrs, Carlos A. Chavez,
       Stephen Wakeland, Michael T. Brumbach, Todd M. Alam,
       Carbon, 48, 2010, 4081-4089.
8.     Arenst Andreas Arie, Joong Kee Lee, Phys. Scr. T139,
       2010.
9.     Arenst Andreas Arie, Wonyoung Chang, Joong Kee Lee, J.
       Solid State Electrochem. 14, 2010, 51-56.
10.    Arenst Andreas Arie, Joong Kee Lee, J. Ceramic
       Processing Research, 10 (5), 2009, 614-617.
11.    Arenst Andreas Arie, Joong Kee Lee, Synthetic Metals,
       161, 2011, 158-165.
12.    Sang-Ok Kim, Heung-Taek Shim, Joong Kee Lee, J. Solid
       State Electrochem. 14, 2010, 1247-1253.
13.    Chaohe Xu, Jing Sun, Lian Gao, J. Mater. Chem. 22, 2012,
       975-979.
14.    Jin-Gu Kang, Gwang-Hee Lee, Kyung-Soo Park, Sang-
       Ok Kim, Sungjun Lee, Dong-Wan Kim, Jae-Gwan Park, J.
       Mater. Chem. 22, 2012, 9330-9337.
15.    Ju Bin Kim, Dong Jin Kim, Kyung Yoon Chung, Dongjin
       Byun, Byung Won Cho, Phys. Scr. T139, 2010.

Find out more at www.thermofisher.com/energy
©2018 Thermo Fisher Scientific Inc. All trademarks are the property of Thermo Fisher Scientific and its
subsidiaries
©2019 Thermounless  otherwise
             Fisher Scientific Inc.specified. AN52444_E
                                    All trademarks             03/18M
                                                   are the property of Thermo Fisher Scientific and its subsidiaries unless otherwise
specified. AN52444_E 03/18M
You can also read