The IRA, Social Media and Political Polarization in the United States, 2012-2018 - Philip N. Howard, University of Oxford Bharath Ganesh ...
←
→
Page content transcription
If your browser does not render page correctly, please read the page content below
The IRA, Social Media and Political Polarization in
the United States, 2012-2018

Philip N. Howard, University of Oxford
Bharath Ganesh, University of Oxford
Dimitra Liotsiou, University of Oxford

John Kelly, Graphika
Camille François, Graphika

                                                      1
Contents
Executive Summary ............................................................................................................................................. 3
Introduction: Rising IRA Involvement in US Politics ........................................................................................... 4
Data & Methodology ........................................................................................................................................... 6
Overview of IRA Activity across Platforms ......................................................................................................... 8
IRA Activity and Key Political Events in the US ................................................................................................ 12
The IRA’s Advertising Campaign against US Voters ......................................................................................... 18
How the IRA Targeted US Audiences on Twitter ............................................................................................... 25
Engaging US Voters with Organic Posts on Facebook and Instagram ................................................................. 32
Conclusion: IRA Activity and Political Polarization in the US............................................................................ 39
References ......................................................................................................................................................... 42
Series Acknowledgements ................................................................................................................................. 44
Author Biographies ............................................................................................................................................ 45

Tables
Table 1: The Volume of IRA Facebook Ads, Facebook Posts, Instagram Posts, and Tweets, Monthly Average .... 5
Table 2: The Total Audience Engagement with Facebook Posts, by Year ............................................................. 7
Table 3: Increase in IRA Activity in the Six-Month Period after the 2016 US Election ....................................... 10
Table 4: The Detected Audience Segments on Facebook, Total Spend, Impressions, and Clicks ......................... 23
Table 5: The Top 20 IRA Facebook Pages, Sorted by Number of Likes.............................................................. 35

Figures
Figure 1: The Volume of IRA Activity, Monthly Average (Twitter on Right Axis) ............................................... 5
Figure 2: The Cross-Platform IRA Activity, for All Platforms, Monthly Totals (Twitter on Right Axis) ............. 11
Figure 3: The Volume of Facebook Ads, Monthly Totals ................................................................................... 15
Figure 4: The Volume of Facebook Ads, Daily Totals ........................................................................................ 15
Figure 5: The Volume of Facebook Posts, Monthly Totals ................................................................................. 16
Figure 6: The Volume of Facebook Posts, Daily Totals ...................................................................................... 16
Figure 7: The Volume of Instagram Posts, Daily Totals...................................................................................... 16
Figure 8: Network Graph of Ads and Interests Targeted ..................................................................................... 22
Figure 9: The IRA Ad Targets, By State............................................................................................................. 24
Figure 10: The IRA Activity on Twitter Focused on Russia and the US, 2009-2018, Monthly Totals ................. 28
Figure 11: The IRA Twitter Activity Focused on the US, by Category, 2012-2018, Monthly Totals................... 28
Figure 12: The Mentions Network of 2,648 IRA Accounts, 2009-2018............................................................... 29
Figure 13: The Frequency of Twitter Hashtags by Peakedness for IRA Activity Targeting US Conservatives ..... 30
Figure 14 : The Frequency of Twitter Hashtags by Peakedness for IRA Activity Targeting US Liberals ............. 31
Figure 15: The Proportional Volume of Facebook Organic Posts for Top 10 Campaigns .................................... 36
Figure 16: The Total Likes on Organic Posts for Top 10 Campaigns, in Millions................................................ 37
Figure 17: The Total Shares of Organic Posts for Top 10 Campaigns, in Millions .............................................. 38

                                                                                                                                                                     2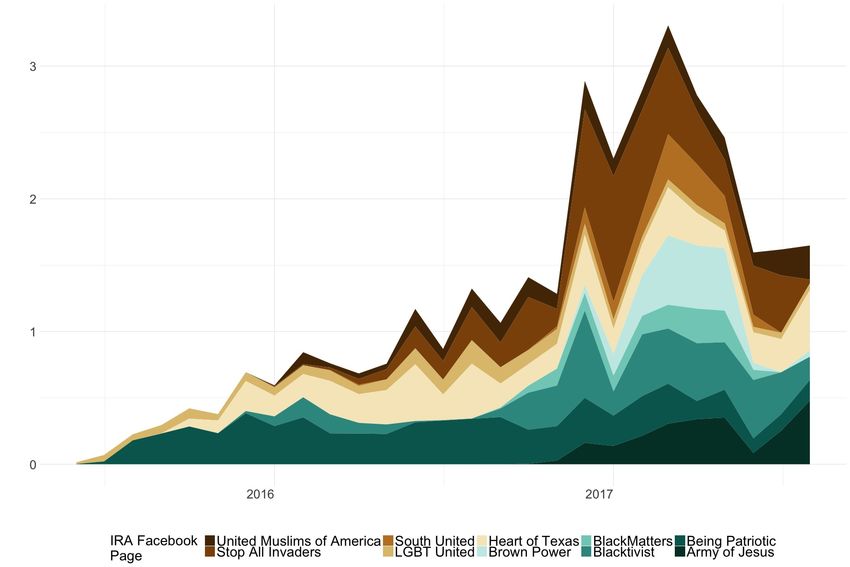
Executive Summary
Russia’s Internet Research Agency (IRA) launched an extended attack on the United States by using
computational propaganda to misinform and polarize US voters. This report provides the first major
analysis of this attack based on data provided by social media firms to the Senate Select Committee on
Intelligence (SSCI).

This analysis answers several key questions about the activities of the known IRA accounts. In this
analysis, we investigate how the IRA exploited the tools and platforms of Facebook, Instagram, Twitter,
and YouTube to impact US users. We identify which aspects of the IRA’s campaign strategy got the
most traction on social media and the means of microtargeting US voters with particular messages.

   •       Between 2013 and 2018, the IRA’s Facebook, Instagram, and Twitter campaigns reached
           tens of millions of users in the United States.
           o Over 30 million users, between 2015 and 2017, shared the IRA’s Facebook and
               Instagram posts with their friends and family, liking, reacting to, and commenting on
               them along the way.
           o Peaks in advertising and organic activity often correspond to important dates in the US
               political calendar, crises, and international events.
           o IRA activities focused on the US began on Twitter in 2013 but quickly evolved into a
               multi-platform strategy involving Facebook, Instagram, and YouTube amongst other
               platforms.
           o The most far reaching IRA activity is in organic posting, not advertisements.

   •       Russia's IRA activities were designed to polarize the US public and interfere in elections by:
           o campaigning for African American voters to boycott elections or follow the wrong voting
              procedures in 2016, and more recently for Mexican American and Hispanic voters to
              distrust US institutions;
           o encouraging extreme right-wing voters to be more confrontational; and
           o spreading sensationalist, conspiratorial, and other forms of junk political news and
              misinformation to voters across the political spectrum.

   •       Surprisingly, these campaigns did not stop once Russia's IRA was caught interfering in the
           2016 election. Engagement rates increased and covered a widening range of public policy
           issues, national security issues, and issues pertinent to younger voters.
           o The highest peak of IRA ad volume on Facebook is in April 2017—the month of the
               Syrian missile strike, the use of the Mother of All Bombs on ISIS tunnels in eastern
               Afghanistan, and the release of the tax reform plan.
           o IRA posts on Instagram and Facebook increased substantially after the election, with
               Instagram seeing the greatest increase in IRA activity.
           o The IRA accounts actively engaged with disinformation and practices common to
               Russian “trolling”. Some posts referred to Russian troll factories that flooded online
               conversations with posts, others denied being Russian trolls, and some even complained
               about the platforms’ alleged political biases when they faced account suspension.

                                                                                                         3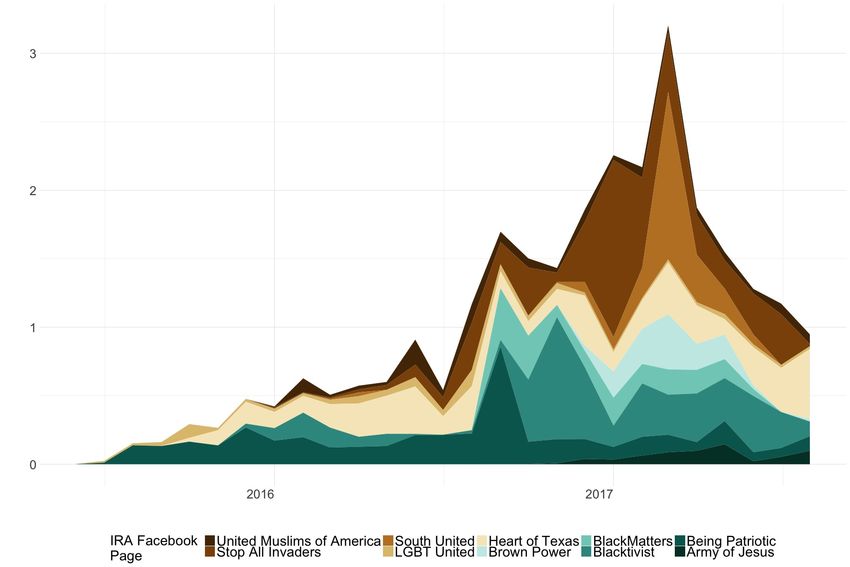
Introduction: Rising IRA Involvement in US Politics
Most of what we know of Russia's social media campaigns against voters in democracies comes from
the small amounts of data released by the major social media firms. There is certainly a constant flow of
examples of suspected Russian-backed, highly automated or fake social media accounts working to
polarize public understanding of important social issues. But understanding the structure and reach of
the Internet Research Agency’s efforts requires large pools of data. In the summer of 2017, the major
social media firms provided a snapshot of such data pertaining to campaigns against voters in the United
States.

Russia's Internet Research Agency (IRA) began targeting US voters for misinformation as early as 2012,
using some of the techniques it had deployed on its own citizens and those of neighboring countries in
Eastern Europe. The Twitter dataset contains posts in a variety of languages. Some of the accounts were
also “re-purposed” in their targeting. For example, some were shifted from operating in Indonesian for
an Indonesian audience to operating in English for a US audience (see Appendices for additional data).
While the IRA targeted a few different countries and language communities, the vast majority of its
output was written in Russian and English.

The IRA’s activities across the major social media platforms have grown in recent years. Figure 1 plots
the average monthly volume of live ads purchased by the IRA per year, from 2015 to 2017. Figure 1 and
Table 1 show that the volume of live Facebook ads purchased in the US by the IRA increased between
2015 and 2017. In 2016, the average monthly volume of live ads was more than double the 2015 level
and remained similar in 2017. Unlike the ads, the monthly volume of organic Facebook posts rose
steadily between 2015 and 2017. Between 2015 and 2016, monthly organic post volume increased
almost sevenfold and continued to rise rapidly into 2017. On Instagram, after a small increase in average
monthly post volume between 2015 and 2016, we see a large increase between 2016 and 2017. Unlike
the average volume of Facebooks ads, the average volume of Facebook and Instagram organic posts was
much higher in 2017 than in 2016: by a factor of 1.7 for Facebook organic posts, and by a factor of 2.3
for Instagram organic posts. The volume of Twitter posts (tweets) did not change significantly in the
period 2015-2017, as shown in Figure 1.a.

In more detail, Table 1 shows the values for the average monthly volume of IRA Facebook ads,
Facebook organic posts, Instagram organic posts, and Twitter posts (tweets). We note that Twitter
provided data for many more accounts (3,841 accounts) than Facebook and Instagram (76 Facebook ad
accounts; 81 Facebook pages; and 133 Instagram accounts). Google chose not to disclose any account
data on ads, YouTube, or Google+ so Google is not included in Figure 1 or Table 1.

The volume of Twitter posts made available to us is much larger than the volume of Facebook ads,
Facebook posts, and Instagram posts. The average monthly Twitter post volume is over fifty thousand
tweets per month, while the average monthly volume of Facebook ads, Facebook posts, and Instagram
posts is in the hundreds to low thousands, never exceeding the six thousand mark.

                                                                                                        4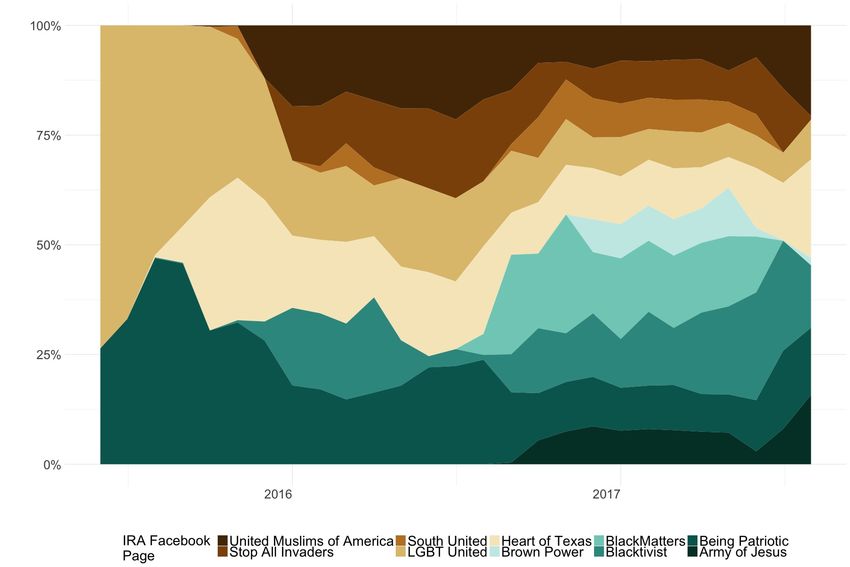
Figure 1: The Volume of IRA Activity, Monthly Average (Twitter on Right Axis)

Note: Facebook, Instagram and YouTube relative to the primary left axis, Twitter relative to the secondary right
axis.

                       Source: Authors’ calculations based on data provided by the SSCI

    Table 1: The Volume of IRA Facebook Ads, Facebook Posts, Instagram Posts, and Tweets,
                                     Monthly Average

         Year     Facebook Ads         Facebook Posts          Instagram Posts         Twitter Posts
         2015           207                   360                    2,110                 59,126
         2016           564                 2,442                    2,611                 57,247
         2017           541                 4,234                    5,956                 59,634

                       Source: Authors’ calculations based on data provided by the SSCI.

                                                                                                                   5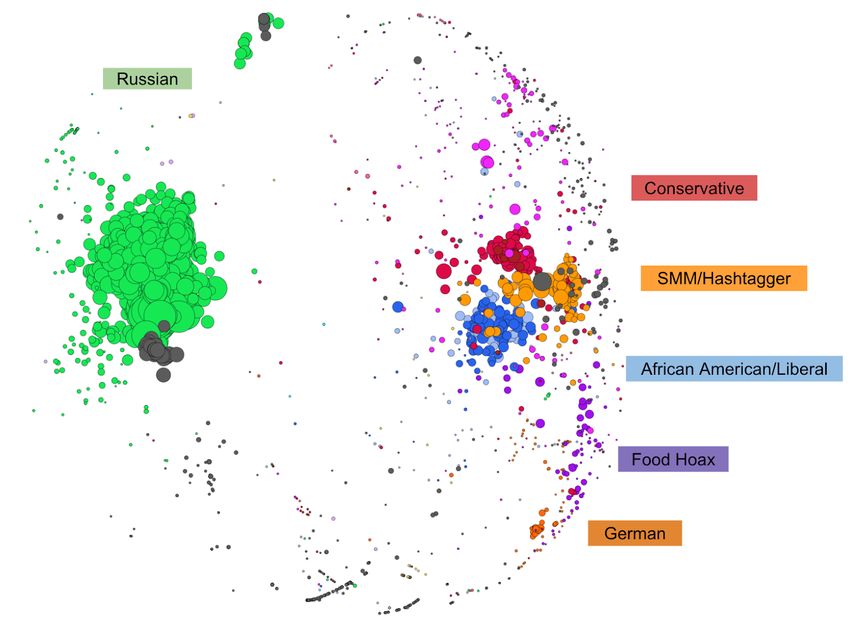
Data & Methodology
Major social media firms provided the SSCI with data on the accounts that these firms identified as
being IRA-origin. Facebook provided data on ads bought by IRA users on Facebook and Instagram and
on organic posts on both platforms generated by accounts the company knew were managed by IRA
staff. Twitter provided a vast corpus of detailed account information on the Twitter accounts the
company knew were managed by IRA staff. Google provided images of ads, videos that were uploaded
to YouTube, and non-machine-readable PDFs of tabulated data on advertisements but provided no
context or documentation about this content.

The research teams at the University of Oxford and Graphika agreed to a Non-Disclosure Agreement
with the SSCI for a short period of 7 months to prepare this report in a rigorous and secure manner. Our
analysis is notable for two reasons. First, our analysis is the first, most comprehensive analysis of the
data provided to the Senate by the social media firms. Second, the data enables an understanding of IRA
activity across platforms, along with visibility into platforms on which little or no data had previously
been revealed, such as Instagram. As a firm, Facebook manages both Facebook and Instagram
platforms. While the company provides researchers with very restricted access to publicly valuable
Facebook platform data through its Application Programming Interface (API), it currently provides none
on Instagram.

The data provided by Facebook, Twitter, and Google reveals new aspects of how the IRA’s activity on
social media has afflicted US politics in the last few years. Facebook and Instagram data covers the
period 2015-2017, Twitter data covers the period 2009-2018, and YouTube data spans the period 2014-
2018. This report presents the most comprehensive analysis of the raw data provided, and actually
makes use of three sources: (1) public data, (2) the special data that technology platforms provided to the
SSCI, and (3) the special data that was publicly released by the House Permanent Select Committee on
Intelligence (HPSCI).

Below we outline the broad contours of the multiple kinds of data analyzed in this report.

•   Facebook provided data on 3,393 individual ads. Public data released by the HPSCI provided details
    on 3,517 ads. These ads encouraged users to engage with specific pages. These pages were the
    center of issue-based ad campaigns run by the IRA.
•   Facebook provided data on 76 different ad accounts purchasing ads on behalf of these campaigns on
    Instagram and Facebook, though only a handful were responsible for the majority of ad spend.
•   On Facebook, these campaigns generated a total of 67,502 organic posts (produced by the IRA page
    administrator and not advertised) across 81 different pages.
•   On Instagram, these campaigns generated a total of 116,205 organic posts across 133 different
    Instagram accounts.
•   The campaigns’ organic Facebook posts had very high levels of engagement. In total, IRA posts
    were shared by users just under 31 million times, liked almost 39 million times, reacted to with
    emojis almost 5.4 million times, and engaged sufficient users to generate almost 3.5 million
    comments. Table 2 below provides further detail.
•   Engagement was not evenly distributed across the 81 pages for which Facebook provided organic
    post data: the top twenty most liked pages received 99% of all audience engagement, shares, and
    likes. Twenty ad campaigns received the most attention from audiences and absorbed the majority of
    the IRA’s spending.

                                                                                                         6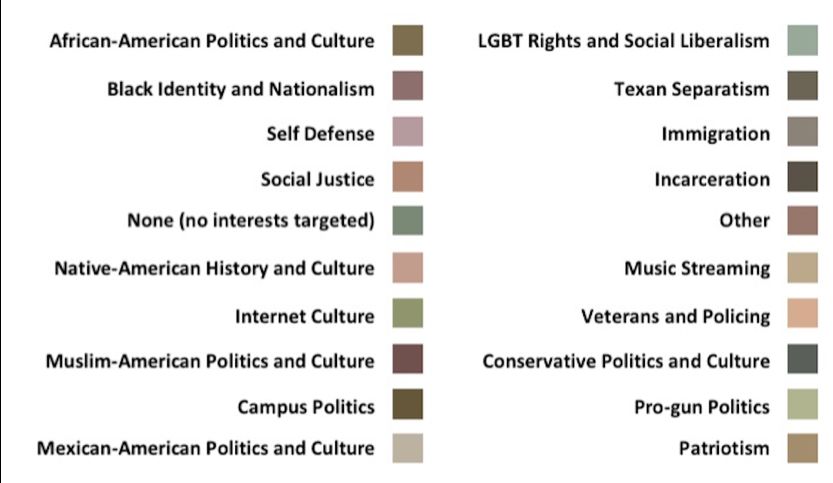
•   On Instagram, a similar pattern is evident. In total, all Instagram posts garnered almost 185 million
    likes and users commented about 4 million times. Forty pages received 99% of all likes. The themes
    of these Instagram posts do not seem to differ significantly from those of Facebook, though the
    presentation style is different.
•   The data Twitter provided contained handles and associated metadata for 3,841 accounts believed to
    have been managed by the IRA. The analysis of Twitter content in this report covers 8,489,989 posts
    (tweets, in this case) across 3,822 of these accounts.
•   Google provided images of 655 AdWords ads and 228 YouTube videos in mp4 (video) format
    without metadata, though they are named by their video ID. The images were not machine-readable
    and the data was incomplete and provided without context.

Table 2 reveals the rapidly growing levels of attention received by IRA campaign communications on
Facebook over time. In this report an “organic post” is a crafted message from an IRA-managed fake
page or user account pretending to be a concerned citizen. Between 2015 and 2017, this IRA content
generated increasing levels of interaction, in terms of sharing, liking, reactions, and comments. The data
provided by Facebook does not allow us to say how much of this activity was from unique users.

The most shared and liked forms of content are important because we have evidence that hundreds of
thousands of people not only saw them, but also actively engaged with them. Sharing is particularly
important as it exposes even more people to IRA content, including those who do not follow IRA pages.

On Facebook, the five most shared and the five most liked posts focused on divisive issues, with pro-
gun ownership content, anti-immigration content pitting immigrants against veterans, content decrying
police violence against African Americans, and content that was anti-Muslim, anti-refugee, anti-Obama,
and pro-Trump. IRA posts tended to mimic conservative views against gun control and for increased
regulation of immigrants. In some cases, terms such as “parasites” were used to reference immigrants
and others expressed some tolerance of extremist views. The top five posts by known IRA accounts are
overtly political and polarizing, and details about the content and engagement by social media users is
described in Appendix B. On Twitter, of the five most-retweeted IRA accounts, four focused on
targeting African Americans.

              Table 2: The Total Audience Engagement with Facebook Posts, by Year

                                                                 Emoji
               Year         Shares             Likes                              Comments
                                                                Reactions
              2015         1,388,390         2,104,487                478            131,082
              2016        12,861,314        15,077,235          1,698,646          1,322,342
              2017        16,714,594        21,644,714          3,695,278          2,001,882
              Total       30,964,298        38,826,436          5,394,402          3,455,306

                      Source: Authors’ calculations based on data provided by the SSCI.

                                                                                                         7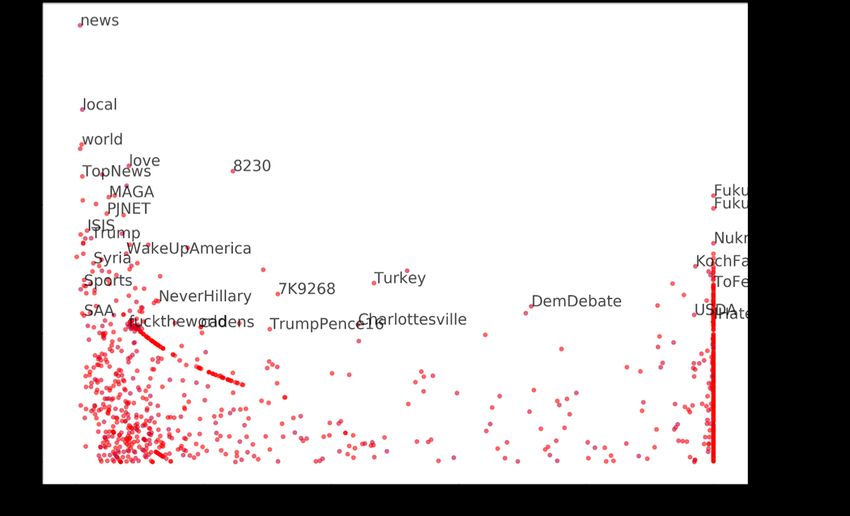
Overview of IRA Activity across Platforms
The IRA adapted existing techniques from digital advertising to spread disinformation and propaganda
by creating and managing advertising campaigns on multiple platforms, often making use of false
personas or imitating activist groups. This strategy is not an invention for politics and foreign intrigue, it
is consistent with techniques used in digital marketing. This overall strategy appeared to have served
three advantages. First, it enabled the IRA to reach their target audiences across multiple platforms and
formats. Indeed, the IRA's core messages and target audiences show consistency across the various
platforms they used to reach the US population. Second, it helped create a semblance of legitimacy for
the false organizations and personas managed by the IRA. We can hypothesize that users were more
likely to assume the credibility of the false organizations set up by the IRA with a presence across
multiple platforms, operating websites, YouTube channels, Facebook pages, Twitter accounts and even
PayPal accounts set up to receive donations. Finally, the IRA was able to leverage their presence on
multiple platforms once detection efforts caught up with them by redirecting traffic to platforms where
their activities had not been disrupted, and by using their accounts on one social media platform to
complain about suspensions of their accounts on another platform.

The Broader Cross-Platform Picture
The data examined in this section makes use of the following data sources: Twitter posts (tweets);
organic posts on Facebook pages; Facebook ads; and organic posts on Instagram. The YouTube data
provided to the SSCI was remarkably scarce and only included video files, without the context or
metadata necessary to be comparable to the other datasets. We pursued an alternative approach to
tracking IRA activity on YouTube, by extracting data on citations of YouTube content in IRA tweets to
use as a proxy for the IRA’s exploitation of the YouTube platform. The proxy is imperfect, but the
IRA’s heavy use of links to YouTube videos leaves little doubt of the IRA’s interest in leveraging
Google’s video platform to target and manipulate US audiences.

These combined sources provide a glimpse into the cross-platform strategy of the IRA, and reveal that
other technology companies may have additional records on IRA activity. The provided dataset only
includes data provided by Twitter, Facebook, and Google. Although it is reasonable to assume that the
core of the IRA’s effort was conducted on these platforms, posts on these platforms provide links to
others (notably Medium, PayPal, Reddit, Tumblr, and Pinterest). Many kinds of social media platforms
have acknowledged that their internal investigations yielded IRA-related activity, but such activities are
not evaluated here.

Platforms that provided data to the SSCI have used different approaches and scopes when selecting the
data to be shared. For instance, Twitter’s data contribution clearly covers activity in multiple languages,
but Facebook’s data contribution focuses on activity only in English. Facebook chose not to disclose
Profiles or Groups discovered throughout the course of their internal investigation and only shared
organic post data from a small number of Pages with the Committee. As discussed earlier, Google’s data
contribution was by far the most limited in context and least comprehensive of the three. Any cross-
platform analysis must take these different limits into account before drawing conclusions on differences
in how these platforms may have been used by the IRA.

Table 3 shows how much IRA activity (or engagement with IRA activity, in the case of Facebook ad
clicks) increased in the six months after the 2016 election, across social media platforms.

                                                                                                             8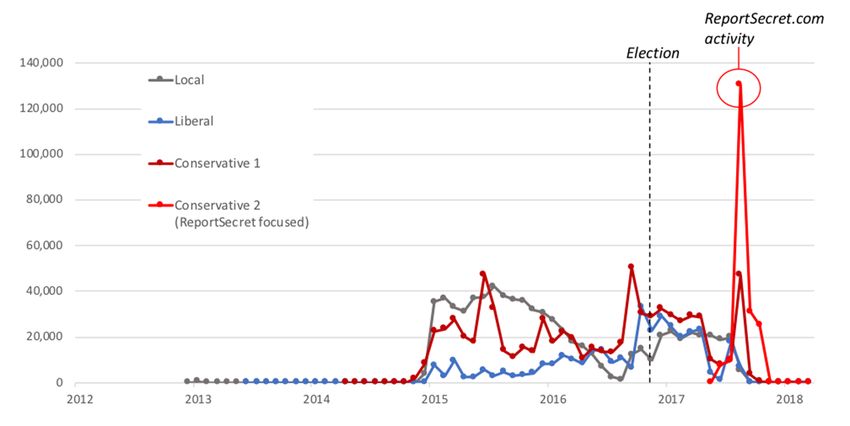
Twitter as a Training Ground for Political Polarization Efforts
The IRA began posting on Twitter in 2009 in Russian language and focused on a domestic Russian
audience. The earliest accounts tweeting in English and targeting a US audience began operating in
2013, but at a low level. English language tweet activity increased somewhat in early 2014, before
ramping up dramatically at the end of 2014 into 2015 (Figure 2).

Looking at timeline of activity across all platforms in Figure 2, it appears that the IRA initially targeted
the US public using Twitter, which it had used domestically in Russia for several years. But as the IRA
ramped up US operations toward the end of 2014, this dataset suggests that the IRA began leveraging
other platforms in sequence: YouTube (here measured via Twitter citations of YouTube content),
Instagram, and lastly Facebook.

The latter part of Figure 2, from 2017 onwards, also highlights the different timing and stages of the
platform’s own disruption efforts. As a result of internal investigations and subsequent takedowns,
Facebook-related activity stops in abrupt stages, and the activity continues on Twitter before being
similarly disrupted over nine months later. Google’s disruption efforts are impossible to audit and
contrast with Facebook’s and Twitter’s efforts given the sparse data provided.

Across Facebook, Instagram, and Twitter, the data shows consistency in the different communities the
IRA targeted and the topics of their organic posts and tweets, which consistently target audiences across
the US political spectrum. In contrast, the YouTube videos provided by Google were predominantly
used to target African Americans, although given Google’s limited provision of data, little can be said
about the full scope of IRA activities involving its products.

Vignette: A Campaign Across Platforms, the Case of Black Matters US
One such campaign, Black Matters US, offers a window into how these platforms were leveraged for
different strategic goals and used against one another once detection efforts disrupted the IRA’s
campaign. Black Matters US maintained an online presence across multiple platforms: Twitter,
Facebook, Instagram, YouTube, Google+, Tumblr, and even PayPal, which it used to encourage
donations to the group. These different accounts were used in concert to promote each other’s posts and
events. The Black Matters Twitter account (@blackmattersus), for instance, persistently posted news
stories from the associated website and promoted events organized through the Black Matters Facebook
page. Through these links, readers could convert their online activity into offline rallies and protests.

When the Black Matters Facebook page was shut down in August 2016, organizers started a new
Facebook page a few days later simply called “BM”, which employed a new audience-building strategy
around more positive themes of black affirmation and black beauty, seemingly to avoid further detection
and suspension. This style of messaging was refined further through an associated @blackmattersus
Instagram account.

However, unlike the older Black Matters, the BM page was keen to redirect traffic to the associated
website and its new “Meet Up” feature rather than to keep its audience engaged on the Facebook
platform where its efforts had previously been detected and suspended. It is also after this initial
suspension on Facebook that the IRA turned to Google Ads to promote the associated Black Matters US
website, with ads leveraging text, image, and video formats. These ads sought to promote the Black
Matters US website, including messages that provoke fear, ranging from statements such as “We are in

                                                                                                               9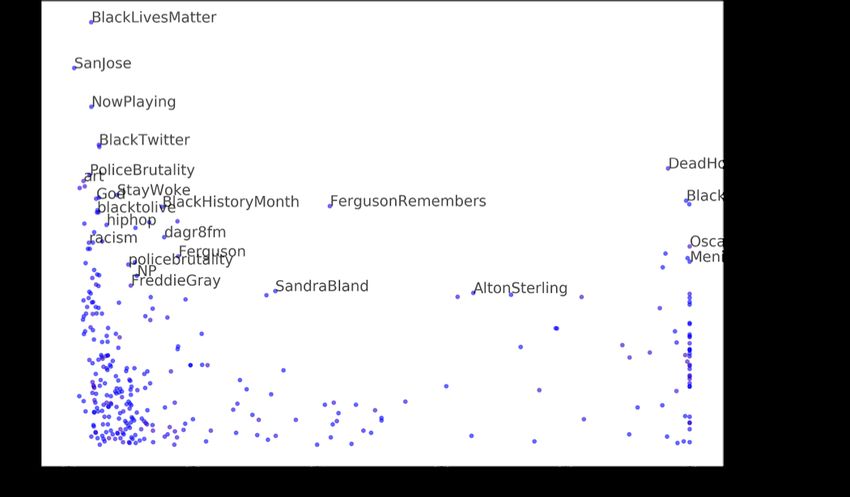
danger!” to ad text reading: “Cops kill black kids. Are you sure that your son won't be the next?”
Following the initial suspension of the Black Matters Facebook page, the IRA also leveraged the Black
Matters US Twitter account to complain about its suspension on the platform and to accuse Facebook of
“supporting white supremacy.” More details on the case of Black Matters US are presented in Appendix
F.

Despite the IRA’s sophistication, their efforts to pose as US citizens on social media reveals mistakes
that enable the detection. For instance, the use of Russian phone carriers and IP addresses for St.
Petersburg are evident in the account metadata for user profiles the IRA had created. US technology
firms’ differential responses also become apparent upon analyzing the data. We clearly observe a
belated and uncoordinated response from the platforms that provided the data. In some cases, activity on
one platform was detected and suspended months before similar action was taken against related activity
on another platform.

       Table 3: Increase in IRA Activity in the Six-Month Period after the 2016 US Election

               Social Media Platform (Activity Metric)            Increase in Activity (%)
            Instagram (Number of Posts)                                  238
            Facebook (Number of Posts)                                    59
            Twitter (Number of Tweets)                                    52
            YouTube (Number of Citations on Twitter)                      84
            Facebook (Number of Ad Clicks)                                45

                     Source: Authors’ calculations based on data provided by the SSCI.

                                                                                                     10
Figure 2: The Cross-Platform IRA Activity, for All Platforms, Monthly Totals (Twitter on Right
Axis)
Note: Facebook, Instagram and YouTube relative to the primary left axis, Twitter relative to the secondary right
axis.
Source: Authors’ calculations based on data provided by the SSCI
11IRA Activity and Key Political Events in the US
Having explored the cross-platform activity of the IRA, in this section we provide a detailed analysis of
the evolution of IRA activity volume over time on Facebook and Instagram.
We find that numerous events related to US politics between 2015 and 2017 are matched with
significant increases in IRA activity. Several, but not all, spikes in ad and post volume happen on, or
very soon after, the dates of important political events. Figures Figure 3-Figure 7 reveal the pacing of
IRA account activity, with bursts of activity on a number of occasions:
• the third Democratic primary debate and the sixth Republican primary debate (both in January
2016);
• the presidential candidate debates between Hilary Clinton and Donald Trump (autumn 2016);
• election day (November 8, 2016);
• the dates of the post-election Russian hacking investigation (December 29 and 30, 2016).
Broadly, over the entire 2015-2017 period, the volume of activity in Facebook ads, Facebook posts, and
Instagram posts increased from the Democratic and Republican National Conventions in July 2016 to
voting day in November 2016.
In these figures, ad volume is measured in terms of how many ads were live on a given day, for daily
analyses, or month, for monthly analyses. Post volume is measured in terms of the number of posts
uploaded on a given date or month.
Figure 3 shows that ad volume increased steeply during the first part of the primaries (February to May
2016), peaking in May, the month when candidates Ted Cruz and John Kasich suspended their
campaigns and Trump crossed the delegate threshold for the GOP nomination. After this period, volume
dipped temporarily but started increasing again in the month of the Democratic and Republican National
Conventions and continued increasing until the month of the election, between July and November
2016. Figure 3 shows a sharp drop in ad volume in the summer of 2017, a surprising pattern, which we
speculate might be due to Facebook blocking the IRA from purchasing further ads, although this was not
explicitly stated in the data provided by Facebook. Facebook announced in August and September of
2017 that they were shutting down accounts by “threat actors” and IRA Facebook ads and pages (Shane
& Goel, 2017; Shinal, 2017). Figure 3 also shows that the months with the most ad activity were long
after the 2016 election (April and May 2017), and the third most active month being the month of the
election itself, November 2016.
In more detail, Figure 4 shows the volume of ads on a daily basis, allowing us to examine whether peaks
in ad volume occurred around important political events. Important political events were compiled using
news articles listing key political events during the 2016 US election cycle, based primarily on the
following sources: ABC News, Reuters, the Guardian, Time magazine, CNN, and the New York Daily
News (Stracqualursi, 2016; Allen, 2016; Gambino & Pankhania 2016; Teague Beckwith, 2018; CNN
Library, 2018; Daily News Projects, 2018).
Figure 4 reveals that the day with the highest ad volume was the day after the first presidential debate
(September 26, 2016), and volume remained relatively high for several days after. Not all peaks directly
followed an important political event such as a candidate debate. The second highest peak was on April
1213, 2016, a day that did not feature significant news events directly related to ongoing campaigns.
However, there were a few important events listed on this date by the New York Times, including a
battery charge against Trump’s campaign manager, Corey Lewandowski. The third highest peak
occurred three days after Ted Cruz suspended his campaign (May 3, 2016), and again activity remained
relatively high for several days afterwards. The next five peaks happened post-election, in April 2017.
There is also a peak on January 14, 2016, the day of the 6th Republican debate.
However, it is likely that the organic posts on Facebook, not the ads, had the most reach. Figure 5
indicates that up to June 2015 there are very few organic posts, often just a single post per day, even
after the launch of the Clinton and Sanders campaigns in April 2015. Activity picks up in early June,
before the Jeb Bush and Trump campaigns were launched in June 2015. It also shows that post volumes
tended to rise over time, and from around October 2016 onwards organic post volumes picked up
considerably. Volumes peaked in December 2016 and stayed high in early 2017 until they started
dropping somewhat after May 2017. However, this drop is nowhere as dramatic as that exhibited by
Facebook ads in the same period, in Figure 3. Monthly volumes in Figure 5 still remain around or above
the 3,000 posts mark, far from dropping to zero, which is considerably higher than the average monthly
volume for 2016 (around 2,400 units) and for 2015 (360 units), per Table 1. Indeed, volumes pick up
again in August 2017. As discussed previously, we speculate that this modest drop might have been due
to Facebook banning some of these accounts.
Figure 6 shows how peaks in the daily volume of Facebook posts relate to important political events. We
see some local spikes in Facebook posts after the final presidential debate between Clinton and Trump,
and also on Election Day. However, the biggest spikes overall were on December 29 and 30, 2016 after
the Obama administration announced that it was investigating Russian meddling in the US election and
Putin stated that he would not respond with sanctions against the US. There is also a drop in activity on
New Year’s Eve and New Year’s Day, though we did not see one over Christmas holidays. The volume
of organic posts rose again on January 2, 2017.
Finally, we examine the daily volume of organic posts on Instagram, shown in Figure 7. In terms of
overall temporal trends in volume, Figure 7 shows that, on Instagram, post volumes showed four phases
over time. First, post volumes pick up early, already from the first few months of 2015, in contrast to the
Facebook posts which did not pick up until June 2015 (Figure 6), and increase until September 2015. In
the next phase, there is a drop which also covers the primaries, in contrast to Facebook ads and posts,
which showed some increases during the first part of the primaries. Next, there is a rise from the end of
the primaries through the Democratic and Republican National Conventions, all through the elections
and past them becoming steeper in 2017, and then reaching a peak in May 2017. In the final part, there
is a drop from May 2017. The drop becomes particularly severe from August 2017, with a sharp two-
stage fall till the volume becomes negligible in October 2017. We speculate that this sharp drop might
be due to Instagram detecting and deleting these accounts. This drop is similar to the steep drop seen in
summer 2017 for Facebook ads (Figure 3), and somewhat in contrast to the summer trends for Facebook
posts (Figure 6) where, even though post volume dropped somewhat, it still remained above the 5,000
units mark (far from negligible), and picked up again in August 2017 (as shown in Appendix A).
Figure 6 reveals that there were large spikes of activity related to key public moments in Clinton’s
campaigning: on June 30 2015, the day of the first release of Clinton’s emails; on September 4 2015,
during the Clinton Benghazi investigation; on October 5 2015, the day after Clinton’s appearance on
Saturday Night Live. The highest peaks overall are concentrated in 2017, however, showing again that,
13on Instagram, IRA activities did not cease after the 2016 election but became substantially more
vigorous. Indeed, the 95 days with the highest volume overall are in 2017, and 197 of the 200 highest
peaks are in 2017. In addition to the pre-election peaks discussed above, others include two relatively
high spikes after the 6th Republican debate and before the Iowa caucuses (January 15 and 19, 2016).
Appendix A contains additional time plots of IRA activity.
14Figure 3: The Volume of Facebook Ads, Monthly Totals
Tallest peak,
Iowa caucuses, Primaries Dem. and Election post-election
1,500 primaries start end Rep. NCs Sudden and
1,250 sharp drop in
summer 2017
1,000
750
500
250
0
2015 2016 2017
Increase in ad volume Increase in ad volume from the
during the primaries National Conventions until the
election
Source: Authors’ calculations based on data provided by the SSCI.
Figure 4: The Volume of Facebook Ads, Daily Totals
Highest peak one day after the first presidential
debate (Sep. 26 2016), and high activity for
several days after
Iowa caucuses, Primaries Dem. and Election Fourth tallest peaks in
150
primaries start end Rep. NCs Apr-May 2017
125 Spike on day of Sixth
Republican debate
100
75
50
25
0
2015 2016 2017
Peak 3 days after Cruz campaign suspension,
and high activity for several days after
Source: Authors’ calculations based on data provided by the SSCI.
15Figure 5: The Volume of Facebook Posts, Monthly Totals
6,000 Iowa caucuses, Primaries Dem. and Election
primaries start end Rep. NCs
5,000
4,000
3,000
2,000
1,000
0
2015 2016 2017
Practically no posts, not even after Clinton and Sanders
campaigns launch (04-2015), activity only starts shortly
before Trump and Bush campaigns launch (06-2015).
Figure 6: The Volume of Facebook Posts, Daily Totals
Spikes on Dec 29 and 30, 2016: Obama admin
Russia retaliations for election meddling; Putin
says will not respond with US sanctions
500
Iowa caucuses, Primaries Dem. and Election
primaries start end Rep. NCs
Spike on
400 election day
300
200
100
Big drop on New Year’s eve
and New Year’s day.
0
2015 2016 2017
Spike after third Spike after the third
democratic debate. (final) presidential Increase in post volumes from
debate election time onward
Source: Authors’ calculations based on data provided by the SSCI.
Figure 7: The Volume of Instagram Posts, Daily Totals
16Large and increasing volumes
Spike (Jun. 30), day of Clinton Iowa caucuses, Primaries Dem. and Election of activity after the election
500 primaries start end Rep. NCs
email release by State Dept.
400 Spikes after 6th Rep.
debate and before the
Iowa caucuses (Jan.
300 15, 29)
200
100
0
2015 2016 2017
Spike (Sept. 4), during Clinton Benghazi Spike (Oct. 5), Clinton on SNL, after Clinton
investigation, day after Trump’s loyalty apology for emails (in Sept.), after Oregon
Two stages of sharp drops
pledge to Republican party shooting (1 Oct.), before the Dem. debate
Source: Authors’ calculations based on data provided by the SSCI.
17The IRA’s Advertising Campaign against US Voters
People, Groups, and Networks Targeted by the IRA
Facebook allows businesses to advertise on its platform through its Ads Manager software. The tool
provides advertisers with the capacity to easily target users based on their interests and behaviors.
“Interests” in this context refers to categories of content, such as “Veterans”, “Mexico” or “Malcolm X”,
which Facebook’s Ads Manager can use to target audiences. The interests targeted the most by the ads
are visualized in Figure 8. Our analysis of the interests shows that the IRA sought to segment Facebook
and Instagram users based on race, ethnicity, and identity. Once this segmentation was completed, the
IRA then ran multiple ad campaigns targeting different groups between 2015 and 2017. These
campaigns were connected to Facebook pages controlled by the IRA, where they posted related organic
content.
Our analysis here focuses on ads purchased on Facebook and Instagram. The IRA also purchased ads on
Google. The data shared by Google with the SSCI suggests the IRA’s ads sought to redirect traffic
towards 38 different websites and URLs, leveraging a mix of text, display, and video formats. Without
additional context, these 38 different links do not tell a clear story, and point to disparate efforts: 5 of
these URLs point to YouTube videos, while another points to a website hosting information about
voting in the Kenyan election targeted at Kenyan audiences, while another targeted residents of Johns
Creek in Georgia (with a budget of $666), and others targeted Canadians with ads encouraging
donations to Justin Trudeau’s campaign. The lack of context, metadata, and documentation prevents any
further analysis of advertising products offered by Google that were purchased by the IRA.
Data on 3,517 ads on Facebook and Instagram released by the HPSCI were analyzed. The data presented
here is based on a sample of 3,233 ads (91.9% completion). Of these, 248 ads were not analyzed as a
result of text extraction errors due to the format in which the data were released (PDF). All findings in
this section are based on this sample.
We used the ForceAtlas 2 layout algorithm (Jacomy et al., 2014) to produce the network graph of
interests in Figure 8. ForceAtlas 2 lays out the graph such that densely connected nodes (in this case
“interests”) appear more closely together. We can already see specific clusters of interests that the IRA
had targeted: for example, the dense connections between “Mexico”, “Chicano rap” and “Hispanidad”
interests suggest the IRA was intending to target Latin American Facebook and Instagram users.
In order to confirm that these were valid clusters of interests, we used a standard technique for the
detection of communities in network analysis (modularity, per Blondel et al., 2008). Using this
automated method, we detected a series of clusters of related ads that clearly targeted a specific segment
of Facebook and Instagram users. This was then validated through manual analysis of all of the interests,
resulting in a final set of 20 segments that we describe in detail in Table 4. Note that Table 4 is not based
on all of the ads studied (3,233 ads); it includes only those which targeted a single segment (2,855 ads).
The 378 ads that targeted multiple interest groups are analyzed in more detail in Appendix C.
We can see from Table 4 that the African American segment was targeted with the most ads. White
users were divided into liberal and conservative segments and targeted differently. A number of other
ethnic segments, including Latin Americans and Muslim Americans, were targeted with smaller
campaigns. By selecting interests in Facebook’s Ads Manager tool, large audiences (for example
18African Americans, and conservative voters) can be divided into smaller segments: for example,
allowing the IRA to target African Americans across mainstream political and cultural issues, but also
users with interests in Black Nationalism and identity, or with more specific interests in the prison
system (“Incarceration” segment). Conservatives voters were targeted based on their interests in
supporting veterans and police forces, particularly against Black Lives Matters, patriotism, the Second
Amendment, and immigration. Finally, ads targeting Internet culture—for example those with interests
in memes, comedy, funny pictures and music streaming—were geared towards attracting younger users.
We also saw some ads that targeted no interests, often involving paid promotion of Facebook posts to
those who had not already liked the page, intended to increase visibility with new audiences.
Facebook uses an auction system to price impressions for different segments, meaning different target
interests are priced differently, according to advertiser demand. We see from Table 4 that ads to African
Americans, Native Americans, Latin Americans, and youth were the cheapest, while ads to
conservatives, Muslim Americans, and LGBT users were the most expensive. If we look at the amount
spent in total, we see that a similar amount was spent on conservatives (a small number of expensive
ads) as was spent on targeting African Americans (a large number of cheap ads).
Polarizing Ad Content Sent by the IRA on Facebook and Instagram
We can see from our analysis of the dataset that IRA Facebook and Instagram ads and organic posts
were targeted at specific groups. The IRA messaging had two strategies. The first involved appealing to
the narratives common within a specific group, such as supporting veterans and police, or pride in race
and heritage, as a clickbait strategy to drive traffic to the Facebook and Instagram pages the IRA set up.
Based on an analysis of both ads and posts, we find that the IRA posted content on these pages to which
they drove traffic with ads. Then the pages posted content that intended to elicit outrage from these
groups. However, the main difference is between conservative voters and all other identity groups in the
audience segments summarized below is that where conservative voters were actively encouraged to get
behind Trump’s campaign. Other voters were encouraged to boycott the election, abstain from voting
for Clinton, or to spread cynicism about participating in the election in general.
We briefly outline below the strategies used against the main groups targeted on Facebook: African
Americans; conservative voters; LGBT and liberal voters; Mexican American voters; and Muslim
American voters.
African American voters. Messaging to African Americans sought to divert their political energy away
from established political institutions by preying on anger with structural inequalities faced by African
Americans, including police violence, poverty, and disproportionate levels of incarceration. These
campaigns pushed a message that the best way to advance the cause of the African American
community was to boycott the election and focus on other issues instead. This often happened through
the use of repetitive slogans. This accounts for the majority of content in the dataset that targeted this
group.
Conservative voters. Messaging to conservative voters sought to do three things: repeat patriotic and
anti-immigrant slogans; elicit outrage with posts about liberal appeasement of “others” at the expense of
US citizens; and encourage them to vote for Trump. Messaging to this segment of voters focused on
divisive, and at times prejudiced and bigoted, statements about minorities, particularly Muslims. Well
documented anti-Muslim tropes are present in both the ads and organic posts (for example claims about
19the burqa, blanket statements about Muslims as terrorists and sexual deviants). Messaging also focused
on pro-gun supporters and various strains of patriotic nationalism, in the form of Texan and Southern
identity. Veterans & policing were important subjects of IRA messaging, often in the context of
allegations of poor treatment of veterans by the Obama administration, in comparison to how well
refugees were allegedly treated. Often, the IRA used unsourced numbers to persuade their audiences of
this.
LGBT and liberal voters. Messaging to these groups utilized the same types of symbolic politics of
slogans encountered with African Americans. Here, ongoing current events seemed to play an important
role and were framed with antagonism towards groups that are perceived as anti-gay (for example
certain religious groups, certain segments of conservative voters). While there was a limited amount of
discussion that sought to drive some of these voters towards Bernie Sanders or third parties, patterns of
trying to reduce trust in the political system were more apparent. Claims meant to demerit Hillary
Clinton are occasionally peppered into this content, but are relatively infrequent. We interpret messaging
to this group as an attempt to increase polarization between liberals and conservatives around LGBT
rights, a well-known wedge issue between these groups.
Mexican American voters. Messaging to this group was limited until after the 2016 election, when the
Brown Power campaign, run by the IRA, began to gain momentum. There is the repetition of the same
themes as with African American voters, again geared towards increasing distrust and cynicism about
the US political system. Coverage of issues such as deportation and treatment of migrants, as well as
discrimination against them, were important themes. However, as is the case with African American
voters, the majority of content tends to focus on slogans about identity that might resonate with this
group.
Muslim American voters. Messaging to this group was somewhat different than that of other identity
groups. The main IRA page that targeted this community tended to promote positive narratives about
Islam and Muslims (for example the values of the religion and its members, its history, and
denouncements of terrorist attacks, as well as best wishes sent to victims of attacks in the US and
abroad). While this does mirror some of the common discourse of Muslim Americans, it does not use
the same kind of slogans that might resonate with Muslim Americans as was done with African
Americans or Mexican Americans. It does, however, repeat the themes of suspicion towards the US
government, particularly by drawing on US foreign policy. Some anti-Clinton content is peppered in, as
it was with LGBT and liberal voters, but there are also a few pro-Clinton messages in the organic posts.
Differential messaging to each of these target groups was designed to push and pull them in different
ways. What is clear is that all of the messaging clearly sought to benefit the Republican Party—and
specifically, Donald Trump. Trump is mentioned most in campaigns targeting conservative voters,
where the messaging encouraged these groups to support his campaign. The main groups that could
challenge Trump were then provided messaging that sought to confuse, distract, and ultimately
discourage members from voting. While the IRA strategy was a long-term one, it is clear that activity
between 2015 and 2016 was designed to benefit President Trump’s campaign.
States Targeted by IRA Ads
As well as allowing targeting of ads by interest, the Facebook Ad Manager allows targeting of ads by
location of the target user, including city, state, and country. We found from the data that location
targeting of ads was not used extensively by the IRA, with only 1,673 different instances of location
20targeting, by 760 ads. These ads were usually used to target African Americans in key metropolitan
areas with well-established black communities and flashpoints in the Black Lives Matter movement.
Some make reference, for example, to Ferguson, MO, and a smaller group of ads marketed rallies and
demonstrations to users living in particular places.
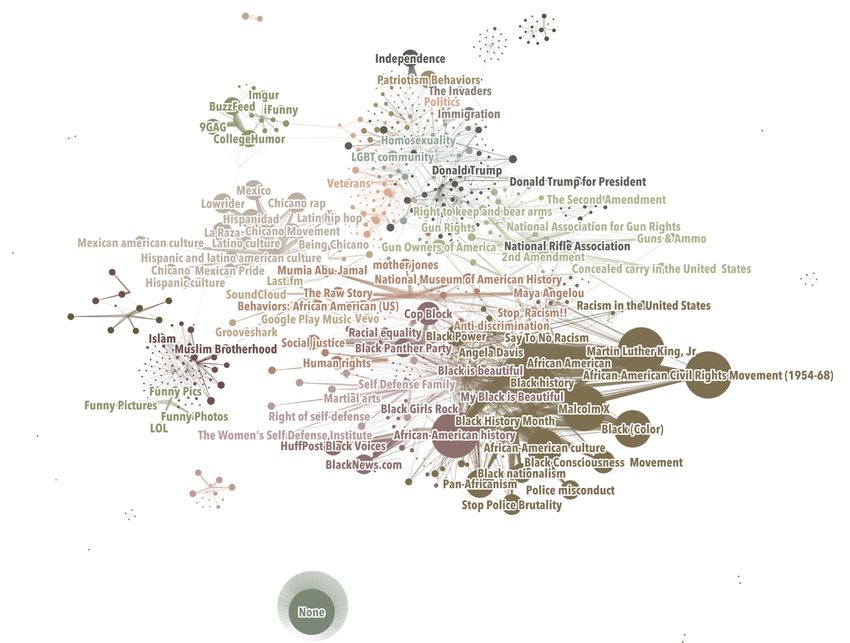
Figure 9 below provides a count of the number of times a location was targeted per state. Swing states
were targeted 543 times in total (out of 1,673 instances of location targeting). Swing states were defined
based on the FiveThirtyEight classification. These included Colorado, Florida, Iowa, Michigan,
Minnesota, Nevada, New Hampshire, North Carolina, Ohio, Pennsylvania, Virginia, Wisconsin (defined
as “Traditional swing states”), and Arizona, Georgia, Maine, and Utah (defined as “New swing states”).
See Silver, 2016. As well, there were 342 instances evident in the data in which areas with significant
African American populations were targeted. We believe the targeting had more to do with race than a
state’s role in the Electoral College or status as a swing state. For example, African Americans in
Ferguson, MO were targeted for the “Black Matters” campaign. African Americans in Baltimore, MD
and Oakland, CA were targeted for the “Blacktivist” campaign. Texan cities were targeted for
campaigns focusing on patriotism and pro-gun politics. However, more research is needed before we can
say whether or not the IRA campaigns overall had an effect in those states.
21Figure 8: Network Graph of
Ads and Interests Targeted
22
Note: This based on 3,233
ads. Only interests targeted
24 or more times by IRA ads
on Facebook or Instagram
are labeled. The size of each
interest node is based on the
number of times that interest
was targeted by an ad.
Source: Authors’ calculations
based on data released by
the HPSCI.Table 4: The Detected Audience Segments on Facebook, Total Spend, Impressions, and Clicks
Total Spent on User
Number of Average Cost User Clicks
Ads Targeting Impressions
Audience Segment Ads per Ad (per
Segment (per
Purchased (RUB) Segment)
(RUB) Segment)
African American Politics and Culture 841 761,745 905.76 13,594,144 1,417,209
Black Identity and Nationalism 246 588,744 2,393.27 2,221,453 146,375
Campus Politics 16 812 50.73 1,333 11
Conservative Politics and Culture 166 1,025,843 6,179.78 2,878,401 254,007
Immigration 60 81,611 1,360.18 162,939 26,980
Incarceration 10 19,746 1,974.63 45,552 4,779
Internet Culture 165 90,531 548.67 933,892 88,657
Latin American Culture 143 120,328 841.45 4,680,521 548,139
LGBT Rights & Social Liberalism 70 360,692 5,152.75 953,350 80,373
Music Streaming 61 3,131 51.33 10,206 41
Muslim American Politics and Culture 57 257,687 4,520.83 523,137 17,125
Native American History and Culture 18 5,729 318.28 34,884 4,276
None 753 888,121 1,179.44 4,005,747 346,070
Other 4 2,262 565.41 12,860 97
Patriotism 24 116,404 4,850.15 689,573 44,527
Pro-gun Politics 66 156,557 2,372.08 832,874 65,596
Self Defense 20 16,756 837.82 28,693 1,186
Social Justice 81 297,403 3,671.64 1,264,902 71,126
Texan Identity 11 39,480 3,589.12 60,965 4,386
Veterans & Policing 43 78,099 1,816.25 743,693 15,986
Total 2,855 4,911,680 1,720.38 33,679,119 3,136,946
Note: Spend is given in Rubles (RUB), as supplied in the data. Impressions are the number of placements on a user’s
screen, whether a web browser or mobile device. A click indicates that a user clicked on the link to the IRA-managed
Facebook page associated with the ad. As an indication, the yearly average exchange rate of RUB to USD for 2016 was
0.015 USD to 1 RUB (based on data from www.x-rates.com). The total ad spend of RUB 4,911,680 above corresponds
to approximately USD 73,711.
Source: Authors’ calculations based on data released by the HPSCI
23Figure 9: The IRA Ad Targets, By State
Note: This map shows state-level activity, and if an ad targeted users in multiple states, it was counted for each
state. An ad targeting CA, TX, and MD is counted for each of those states. The numbers therefore show the
number of times a particular state was targeted by an IRA ad on Facebook or Instagram, not the total number of
ads that targeted that state.
Source: Authors’ calculations based on data released by the HPSCI.
24How the IRA Targeted US Audiences on Twitter
In the dataset provided by Twitter, at least 57% of the IRA’s posts are in Russian, 36% are in English,
and the remainder are in several languages. Our analysis confirms that the early focus of the IRA’s
Twitter activity was the Russian public, targeted with messages in Russian from fake Russian users.
These misinformation activities began in 2009 and continued until Twitter began closing IRA accounts
in 2017. The IRA’s English-language, US-focused activity began in 2013. It increased dramatically at
the end of 2014 to a level sustained through the 2016 election, after which it increased again. US-
focused activity decisively increased over the level of Russian-focused activity only in mid-2017, well
after the US Presidential Election and shortly before Twitter suspended the majority of accounts in late
2017 (Figure 10).
The initial acceleration of the IRA’s US-focused Twitter campaigns at the end of 2014 began shortly
after the IRA’s largest sustained Twitter campaign, which supported Russian activities in the Ukraine
conflict from mid- to late 2014. This spike in Russian language activity was accompanied by an increase
in English language tweets, which the IRA had produced in small amounts (hundreds per year) since
2009, peaking at 148,177 in August 2014. Though in English, these tweets came primarily from
“motivational” accounts, while others pushed the hashtag “#UkranianLie”. IRA activity that involved
creating personas that mimicked segments of US audiences ramped up at the beginning of 2015,
concurrent with a second major Russian language campaign to support the objectives of the Russian
government in the Crimean and Donbass conflicts. Russian language IRA activity remained higher than
English activity targeted at US audiences until 2016, when they became roughly equal. This acceleration
is evident in Figures Figure 10 and Figure 11.
Researchers have analyzed how the IRA played both sides of an issue, sometimes going so far as to
organize opposing protests on either side of the same street, as the Facebook groups “Heart of Texas”
and “United Muslims of America” did in Texas in May 2016. The IRA used the same approach on
Twitter, constructing online “sock puppet” identities that mimicked a number of different types of
legitimate users.
This analysis reveals how sets of sock puppet accounts pretending to be members of particular
ideological segments operated as coherent teams. An analysis of mentions relationships among these
accounts reveals the primary configuration of embedded assets—sock puppets targeting specific
communities—constructed by the IRA (Figure 12). Furthermore, analysis of IP addresses associated
with the IRA accounts demonstrates that teams of accounts targeting both US liberals and conservatives
were operated from the same IP address, proving the IRA used the tactic of playing both sides of the
political spectrum against one another (see Appendices D, G, & H).
IRA Teams in Twitter Mentions Network
To better understand how the IRA’s Twitter accounts interacted with each other, we constructed a graph
of mentions relationships among them (Figure 12). Of the 3,841 accounts in the IRA dataset, we found
2,648 connected to at least one other IRA account. We used a force-directed layout algorithm
(Fruchterman-Reingold) to position nodes based on mentions arcs, revealing the structure of these
interactions. The resulting network (Figure 12) shows that sets of IRA accounts typically operated in
“teams” of co-mentioners that corresponded closely to their fictitious online identities. Team members
tended to mention teammates far more often than non-teammates, thus forming a number of coherent
communities of interaction.
25You can also read