Hospital utilization rates for influenza and RSV: a novel approach and critical assessment - Population Health Metrics
←
→
Page content transcription
If your browser does not render page correctly, please read the page content below
Johnson et al. Population Health Metrics   (2021) 19:31
https://doi.org/10.1186/s12963-021-00252-5

 RESEARCH                                                                                                                                             Open Access

Hospital utilization rates for influenza and
RSV: a novel approach and critical
assessment
Emily K. Johnson1* , Dillon Sylte1, Sandra S. Chaves2,3, You Li4, Cedric Mahe2,3, Harish Nair4, John Paget5,
Tayma van Pomeren5, Ting Shi4, Cecile Viboud6 and Spencer L. James1

  Abstract
  Background: Influenza and respiratory syncytial virus (RSV) contribute significantly to the burden of acute lower
  respiratory infection (ALRI) inpatient care, but heterogeneous coding practices and availability of inpatient data
  make it difficult to estimate global hospital utilization for either disease based on coded diagnoses alone.
  Methods: This study estimates rates of influenza and RSV hospitalization by calculating the proportion of ALRI due
  to influenza and RSV and applying this proportion to inpatient admissions with ALRI coded as primary diagnosis.
  Proportions of ALRI attributed to influenza and RSV were extracted from a meta-analysis of 360 total sources
  describing inpatient hospital admissions which were input to a Bayesian mixed effects model over age with
  random effects over location. Results of this model were applied to inpatient admission datasets for 44 countries to
  produce rates of hospital utilization for influenza and RSV respectively, and rates were compared to raw coded
  admissions for each disease.
  Results: For most age groups, these methods estimated a higher national admission rate than the rate of directly
  coded influenza or RSV admissions in the same inpatient sources. In many inpatient sources, International
  Classification of Disease (ICD) coding detail was insufficient to estimate RSV burden directly. The influenza inpatient
  burden estimates in older adults appear to be substantially underestimated using this method on primary
  diagnoses alone. Application of the mixed effects model reduced heterogeneity between countries in influenza and
  RSV which was biased by coding practices and between-country variation.
  Conclusions: This new method presents the opportunity of estimating hospital utilization rates for influenza and
  RSV using a wide range of clinical databases. Estimates generally seem promising for influenza and RSV associated
  hospitalization, but influenza estimates from primary diagnosis seem highly underestimated among older adults.
  Considerable heterogeneity remains between countries in ALRI coding (i.e., primary vs non-primary cause), and in
  the age profile of proportion positive for influenza and RSV across studies. While this analysis is interesting because
  of its wide data utilization and applicability in locations without laboratory-confirmed admission data,
  understanding the sources of variability and data quality will be essential in future applications of these methods.
  Keywords: Influenza, Respiratory syncytial virus, Acute lower respiratory infections, Inpatient admissions

* Correspondence: ekj15@uw.edu
1
 Institute of Health Metrics and Evaluation, University of Washington, Seattle,
USA
Full list of author information is available at the end of the article

                                          © The Author(s). 2021 Open Access This article is licensed under a Creative Commons Attribution 4.0 International License,
                                          which permits use, sharing, adaptation, distribution and reproduction in any medium or format, as long as you give
                                          appropriate credit to the original author(s) and the source, provide a link to the Creative Commons licence, and indicate if
                                          changes were made. The images or other third party material in this article are included in the article's Creative Commons
                                          licence, unless indicated otherwise in a credit line to the material. If material is not included in the article's Creative Commons
                                          licence and your intended use is not permitted by statutory regulation or exceeds the permitted use, you will need to obtain
                                          permission directly from the copyright holder. To view a copy of this licence, visit http://creativecommons.org/licenses/by/4.0/.
                                          The Creative Commons Public Domain Dedication waiver (http://creativecommons.org/publicdomain/zero/1.0/) applies to the
                                          data made available in this article, unless otherwise stated in a credit line to the data.
Johnson et al. Population Health Metrics     (2021) 19:31                                                                            Page 2 of 22

Background                                                                 administrative data on country-specific influenza and
Despite the large burden of lower respiratory infections                   RSV utilization. By comparing the results of the BIRD
globally [1], it is difficult to estimate the proportion of                project method to those produced by raw extraction of
the hospitalizations attributable to influenza and respira-                ICD-coded RSV and influenza admission rates, we can
tory syncytial virus (RSV) across countries or over time.                  estimate the potential under-attribution of ALRI to these
Heterogeneous coding practices in hospital records                         specific causes.
across countries limit the comparability of administrative
datasets from different locations and pose a challenge to                  Methods
producing global hospitalization estimates using influ-                    At a high level, this study estimates influenza and RSV
enza and RSV-coded inpatient admissions alone. With-                       admission rates by modeling the proportion of ALRI ad-
out the addition of laboratory test result data,                           missions that are due to influenza and RSV respectively,
administrative data may not accurately estimate in-                        and then multiplying these proportions by ALRI admis-
patient disease burden, further complicating efforts to                    sion rates from clinical administrative data. Figure 1
model burden at the population level. Absent accurate                      below is a detailed flowchart of the processing steps used
population estimates of the burden of specific respira-                    in this analysis, and each step is described in further de-
tory diseases, it will be challenging to conduct cross-                    tail in the following sections.
country comparison, a hallmark of linking health policies
(e.g., masking, vaccination campaigns) to outcomes.                        ALRI admissions calculation
  The Burden of Influenza and RSV Disease (BIRD) pro-                      We extracted admission counts for ALRI from 29 in-
ject has developed an alternative method that may be                       patient all-cause admission datasets covering 44 coun-
useful for producing estimates of county-specific influ-                   tries and containing hospitalizations spanning the years
enza and RSV burdens using administrative                                  1990 to 2017, stratified by age in years or age groups de-
hospitalization data. This method generates rates of in-                   pending on the source. These datasets included approxi-
fluenza and RSV-related acute lower respiratory illness                    mately 43 million admissions and represent all ICD-
(ALRI) hospitalizations across 44 countries by modeling                    coded inpatient admission data used in the Global Bur-
the proportion of ALRI hospitalizations specifically at-                   den of Disease Study, an international collaborative
tributable to RSV and influenza from literature estimates                  study led by the Institute for Health Metrics and Evalu-
of laboratory-confirmed influenza and RSV among ALRI                       ation (IHME) at the University of Washington and sup-
hospitalizations. The model can be applied to                              ported by over 4800 researchers in more than 140

 Fig. 1 Flowchart of ALRI admission processing and meta-analysis modeling. Flowchart of data processing and analysis conducted under this
 study. This diagram describes processing of ALRI admissions from clinical administrative data as well as the modeling and processing performed
 on RSV and Influenza meta-analysis proportions
Johnson et al. Population Health Metrics            (2021) 19:31                                                                            Page 3 of 22

countries [1]. Additional detail on inpatient data from                           Inpatient Sample (HCUP NIS) [3] are considered com-
IHME is listed in Additional file 1. Because only 11 of                           prehensive datasets and the scaling described above was
the 44 datasets utilized in this study recorded secondary                         not applied to these sources. Instead, counts of admis-
diagnoses, ALRI admissions were defined as those with a                           sions with a primary ALRI diagnosis in these sources
primary diagnosis code listed in Table 1 below.                                   were divided by the total population of that country to
  The majority of clinical datasets in this analysis contain                      produce rates of ALRI admission by BIRD age group
a subset of the country’s total inpatient utilization. For                        and year. Population estimates are produced as part of
these non-comprehensive clinical sources, counts of ALRI                          IHME’s GBD study and detailed information on the
admissions by age were divided by the total number of ad-                         methods to produce these estimates are available in re-
missions in the dataset to produce age-specific propor-                           lated publications [1].
tions of inpatient utilization that have a primary ALRI                             Most clinical administrative data is provided in age in
diagnosis. This proportion is multiplied by IHME’s total                          years or occasionally in various aggregated age bins. The
inpatient utilization envelope to approximate a compre-                           age groupings used for the BIRD analysis were at a
hensive rate of ALRI utilization by age and country. The                          higher level of aggregation than the majority of adminis-
envelope is produced using a spatio-temporal Gaussian                             trative sources used. Therefore, the final step in ALRI
process regression that smooths over geographic distance                          admission processing was to aggregate rate-space esti-
and year of hospitalization and that models admission rate                        mates to the BIRD analysis age groups, by summing
per capita by age using IHME’s healthcare access quality                          both the numerator and denominator so that the rates
indicator, supply of inpatient hospital beds, and all-cause                       of ALRI utilization are binned appropriately to match
mortality as predictive covariates. More detail on the en-                        the rest of the analysis.
velope estimation process, covariates used in the model,                            While many of the data sources used in this analysis
and results can be found in related Global Burden of Dis-                         are also used in creating annual GBD estimates, there
ease (GBD) publications [1].                                                      were some differences in data processing methods be-
  The UK Hospital Episode Statistics dataset [2] and                              tween the two projects that led to different estimates of
Healthcare Cost and Utilization Project National                                  rates of ALRI. GBD analysis adjusts inpatient data to

Table 1 Acute lower respiratory infection ICD codes
ICD Version                                   Code                                  Description
ICD-10                                        J10                                   Influenza due to identified seasonal influenza virus
ICD-10                                        J11                                   Influenza, virus not identified
ICD-10                                        J12                                   Viral pneumonia, not elsewhere classified
ICD-10                                        J13                                   Pneumonia due to Streptococcus pneumoniae
ICD-10                                        J14                                   Pneumonia due to Haemophilus influenzae
ICD-10                                        J15                                   Bacterial pneumonia, not elsewhere classified
ICD-10                                        J16                                   Pneumonia due to other infectious organisms, not elsewhere classified
ICD-10                                        J18                                   Pneumonia, organism unspecified
ICD-10                                        J20                                   Acute bronchitis
ICD-10                                        J21                                   Acute bronchiolitis
ICD-10                                        J22                                   Unspecified acute lower respiratory infection
ICD-9                                         466                                   Acute bronchitis and bronchiolitis
ICD-9                                         480                                   Viral pneumonia
ICD-9                                         481                                   Pneumococcal pneumonia
ICD-9                                         482                                   Other bacterial pneumonia
ICD-9                                         483                                   Pneumonia due to other specified organism
ICD-9                                         484                                   Pneumonia in infectious diseases classified elsewhere
ICD-9                                         485                                   Bronchopneumonia, organism unspecified
ICD-9                                         486                                   Pneumonia, organism unspecified
ICD-9                                         487                                   Influenza
ICD-9                                         488                                   Influenza due to identified avian influenza virus
ICD codes used to identify ALRI primary admissions. Note that all more detailed codes below those listed were also included
Johnson et al. Population Health Metrics   (2021) 19:31                                                                 Page 4 of 22

account for readmissions, potential missingness of sec-         The equation for the influenza and RSV MR-BRT
ondary inpatient diagnoses, unavailable outpatient data,      models is shown in Eq. 1 below. Detail on the assump-
and healthcare access and quality for every location. It      tions made by the mixed effects framework, the use of
aggregates inpatient data with claims and outpatient data     cubic splines on fixed effects, and estimation of the pos-
to produce estimates of individuals who received any          terior using maximum likelihood estimation are available
care for an ALRI diagnosis. Because this study was pri-       in related literature [357]. The MR-BRT framework is an
marily focused on inpatient diagnoses of influenza or         R wrapper for the open source mixed effects LimeTr
RSV, these additional corrections were not applied.           package, which could be used to replicate the modeling
                                                              methods described here [358].
Influenza and RSV proportion estimation

Influenza and RSV admission rates were estimated by
                                                                  ln pðflu jRSV   Þ;i; j       ¼ spline agei; j β1
modeling the proportion of admissions for ALRI that
were attributable to each cause respectively, and then es-                                       þ ln regioni; j β2
timating the proportion of total ALRI hospitalizations
                                                                                                 þ ln super regioni; j β3
represented by these diseases, stratified by age, year, and
country. The meta-analysis for this model included 156                                           þ Z i ui; j þ ϵij              ð1Þ
independent       studies     on       influenza-associated
hospitalization rates covering 46 countries with data be-        Where p(flu |RSV), i, j is the proportion of ALRI admis-
tween 1979 and 2015 for influenza [4–159], and 204            sions that are positive for flu or RSV in observation i for
studies on RSV admission rates covering 56 countries          study j, agei, j is computed using a spline based matrix
with data between 1982 and 2017 [4, 19, 73, 107, 133,         for age midpoint, regioni, j and super regioni, j are the
146, 160–356]. Sample size of the study, age range, and       fixed effects on GBD region and super region, Ziis a lin-
location in study cohort, total admissions for ALRI, and      ear map, ui, jare the random effects from meta-analysis
admissions for influenza and RSV respectively were ex-        study j at observation i, and ϵij are measurement errors
tracted from each study. The proportion of ALRI admis-        with a specified covariance.
sions due to influenza and RSV were calculated for each          A hierarchical method was chosen a priori for this
location, age, and year present in the input study data.      analysis as it allowed us to produce estimates for loca-
  A Bayesian regularized trimmed meta-regression (MR-         tions with little or no meta-analysis data while still ac-
BRT) model was generated using ALRI admission meta-           counting for location-specific randomness in meta-
analysis data to produce estimates of the proportion of       analysis estimates. In the final results of this analysis,
ALRI admissions due to each cause while accounting for        location-level estimates maintain age heterogeneity
within-study heterogeneity by age and location as well as     based on the differences of age patterns for ALRI admis-
error and bias between sources. Within the MR-BRT             sion rates by each location.
framework, the trend over age was modeled as a cubic             Bootstrapping was performed by taking 1000 samples
spline with linear tails on the youngest and oldest age       on the posterior of the MR-BRT model, and uncertainty
groups and an uninformative Gaussian prior. Linear tails      from the samples was propagated through the remainder
on the age ends were used to smooth behavior of the           of the estimation process as 95% credible intervals.
age pattern at the poles in cases of sparse data, which
can be highly unstable in MR-BRT modeling.                    Final admission rate estimation
  Location was used as a covariate at the IHME Global         Admission counts and rates for influenza and RSV were
Burden of Disease’s super-region and regional levels, to      calculated by multiplying the proportions from the influ-
account for potential geographic variation while inform-      enza and RSV mixed effects attribution models to annual
ing estimations for locations with sparse data by the         ALRI admission count estimates by age group and loca-
trend of those with a larger input evidence base. Region      tion. Seasonality was excluded from the scope of this
was used as a proxy for country-level heterogeneity in        analysis because seasonal information was not consist-
order to produce estimates where meta-analysis data           ently available in influenza and RSV meta-analysis litera-
was available and admissions data was not or vice versa.      ture. Each location with clinical data received the
IHME’s regional categorization by country is available in     attribution model fit for the corresponding GBD region,
related literature. Both region and super-region were         unless no input data for the model existed, in which case
modeled as a fixed effect with an uninformative Gauss-        an average of the models within the GBD super-region
ian prior on each. The hierarchical structure of the          was used. Uncertainty was quantified using the upper
super-regional and regional models results in child           and lower uncertainty interval from the fit of the mixed
models that follow the same age trend as those of the         effects model. Due to meta-analysis data sparsity in older
parents.                                                      ages for the RSV attribution mixed effects model,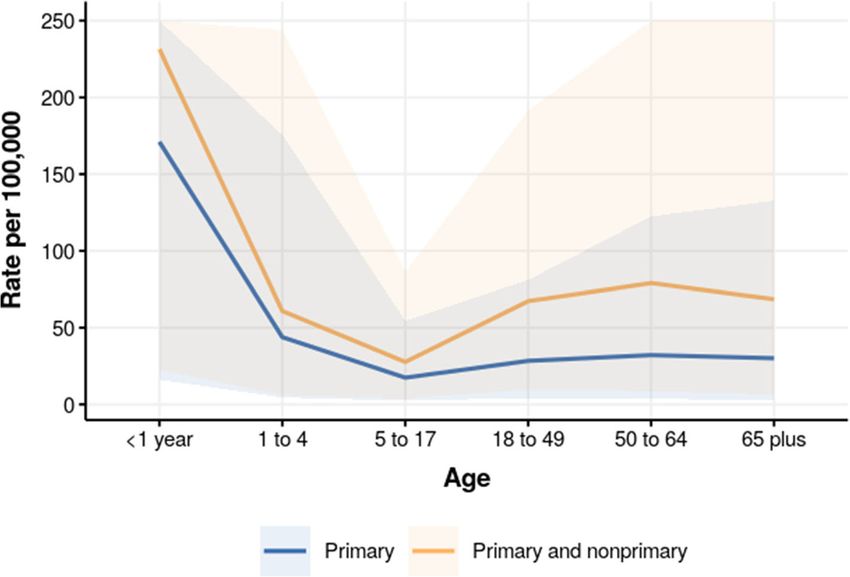
Johnson et al. Population Health Metrics (2021) 19:31 Page 5 of 22
admission rates and counts for RSV were only calculated Metadata about each of IHME’s inpatient data sources is
for children under five. available in Additional file 1. Only the inpatient sources
Influenza and RSV-coded primary admissions were ex- that were ICD-9 or ICD-10 coded were used in this ana-
tracted from a subset of clinical administrative datasets as lysis. While all sources listed had sufficient ICD detail to ex-
illustrative scenarios in order to compare results of the tract ALRI utilization rates, not all locations with inpatient
BIRD analysis to direct ICD extraction with no adjust- admission data have at least 4-digit ICD coding which is re-
ments. ICD codes used for this comparison can be found quired to identify RSV cases by ICD diagnosis alone (see
in Additional file 2. All locations used to illustrate the Additional file 2 for the list of 4-digit RSV codes).
comparison contained at least 4-digit ICD detail, which Figure 4 shows the proportion of ALRI admissions at-
was required to identify primary admissions for RSV. tributable to influenza and RSV at the super-regional level.
To assess the limitation of using primary diagnosis Due to limited meta-data availability in older ages for RSV
alone for ALRI admissions, we extracted non-primary as seen in the figure, admission rates for RSV were only
diagnosis detail from the HCUP NIS data which was estimated for the under 1 and 1 to 4 year age groups. Data
used to produce US estimates [3]. Diagnosis levels avail- for selected regions are tabulated in Table 2 below.
able in HCUP NIS vary by state, but all available diagno- In these results, influenza represents a significant pro-
sis detail up to the 30th inpatient diagnosis was included portion of ALRI admissions in individuals aged 15 to 55
for this analysis. We compared primary and non- years, and a lower proportion in the oldest and youngest
primary utilization for the year 2012 from this dataset, age groups. Conversely, RSV represents over 30% of all
and applied influenza-attributable proportion estimates ALRI admissions for infants under 1 year and over 18%
to the complete dataset in order to generate a compari- for infants aged 1–4, but the proportion of ALRI admis-
son of influenza rates that include non-primary hospital- sions attributable to RSV drops dramatically in age
izations. We focused specifically on influenza for this groups beyond the age of 5 years.
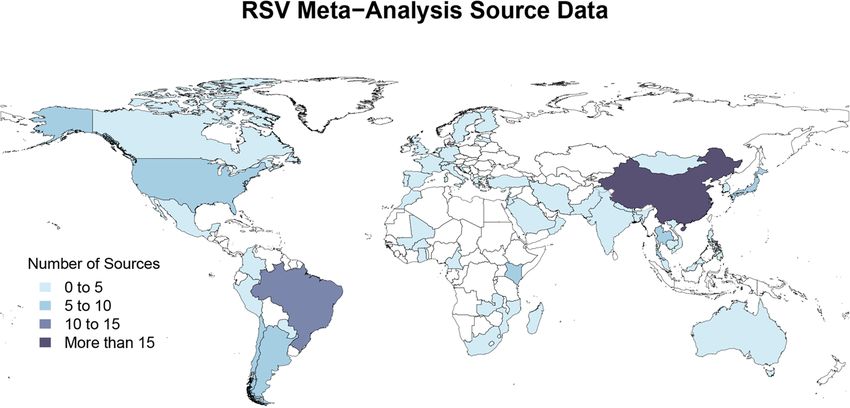
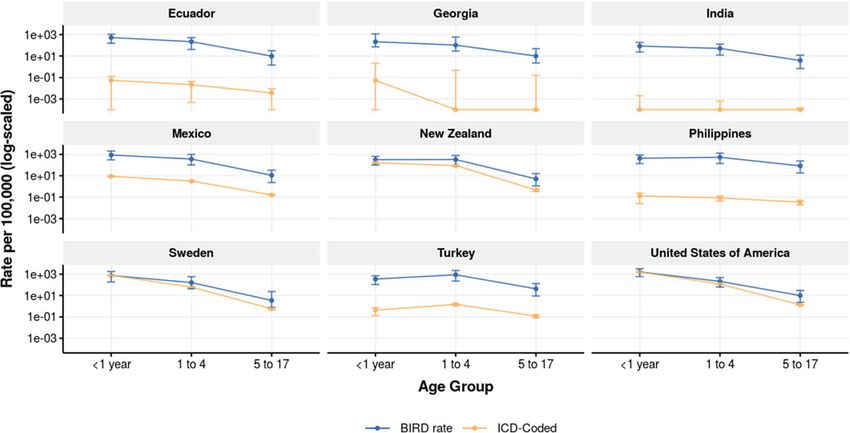
sub analysis because of the substantial ALRI utilization Comparisons of admission rates calculated through
as non-primary diagnosis in older ages, as there may be the BIRD analysis versus those coded directly with influ-
competing complications that would end up coded as enza and RSV ICD codes for locations with sufficient
primary discharge diagnosis in this population [359– ICD granularity are shown in Figs. 5 and 6, and tabu-
362]. lated in Tables 3 and 4. For almost all age groups, the
methods as described in this paper estimated a higher
Results national admission rate than the rate of directly coded
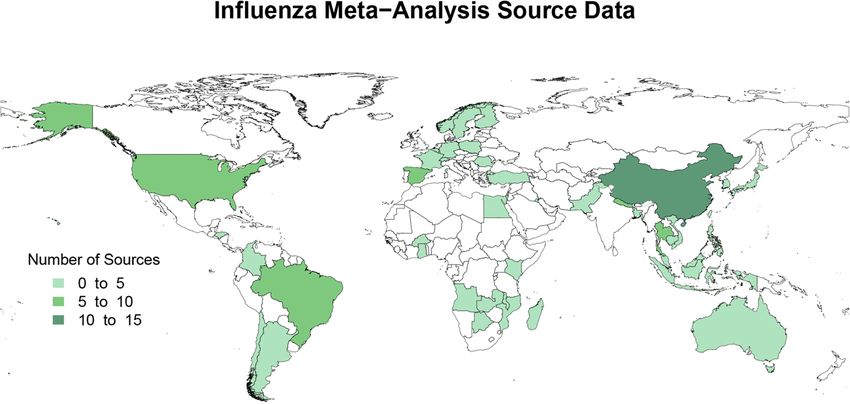
Figures 2 and 3 represent the number of sources of influenza or RSV admissions in the same inpatient
meta-analysis data for the proportion of ALRI admis- sources. Many inpatient data sources used at IHME are
sions attributable to influenza and RSV, respectively. coded only to three or four digits, in which case it is less
Meta-analysis sources varied in their age ranges and accurate or even not possible to estimate RSV admission
granularity, sample size, and the time range over which rates. Detail on inpatient clinical sources and ICD
studies were conducted. All meta-analysis sources were granularity is listed in Additional file 1, and the ICD
used to inform the meta-regression analyses as described codes used to determine influenza and RSV inpatient ad-
above. missions are listed in Additional file 2. The full dataset
Fig. 2 Map of influenza meta-analysis source data. Influenza meta-analysis data availability by countryJohnson et al. Population Health Metrics (2021) 19:31 Page 6 of 22 Fig. 3 Map of RSV meta-analysis source data. RSV meta-analysis data availability by country of BIRD estimates of influenza and RSV admissions by are shown in Fig. 7. The impact of non-primary age, year, and country are available in Additional file 3. diagnoses was a 1.4-fold increase in rates estimates As non-primary diagnoses were not available for the for children < 1 year, and nearly a 2.5-fold increase in majority of sources of inpatient admission data, only pri- rates estimated in the 18–49, 50 to 64, and 65 plus mary diagnosis was used to expand the number of use- age groups. able sources and retain consistency across locations. We conducted a sensitivity analysis comparing the average Discussion primary and non-primary admission rates for ALRI in While influenza and RSV-associated healthcare the USA from 2002 to 2012 to illustrate the potential utilization is acknowledged as a global problem, gaps in impact of limiting the analysis to ALRI as primary diag- quantifying the magnitude of this problem exist due to nosis only. lack in representative data availability across locations Influenza admission rates in the USA by primary- that makes assessing admission rates within or across only diagnosis and primary and non-primary diagnosis countries challenging. Traditional methods of burden Fig. 4 Proportion of ALRI admissions attributable to influenza and RSV. Influenza and RSV proportion models and meta-analysis input data for all IHME super-regions. Data point and model line colors reflect the GBD super region. Size of data points is scaled by the standard error of each datum
Johnson et al. Population Health Metrics           (2021) 19:31                                                            Page 7 of 22

Table 2 Proportion influenza and RSV positive by GBD super-region
GBD super region                           Age       Influenza positive proportion of ALRI   RSV positive proportion of ALRI
                                                     admissions (95% UI)                     admissions (95% UI)
Central Europe, Eastern Europe, and
Johnson et al. Population Health Metrics (2021) 19:31 Page 8 of 22
Table 2 Proportion influenza and RSV positive by GBD super-region (Continued)
GBD super region Age Influenza positive proportion of ALRI RSV positive proportion of ALRI
admissions (95% UI) admissions (95% UI)
South Asia 50 to 0.07 (0.01–0.27) 0.01 (0–0.03)
64
South Asia 65 0.01 (0–0.06) 0 (0–0)
plus
Southeast Asia, East Asia, and OceaniaJohnson et al. Population Health Metrics (2021) 19:31 Page 9 of 22 Fig. 6 RSV admission rate by BIRD analysis and ICD coding. RSV admission rate per 100,000 by age as produced by BIRD analysis (blue) and simple raw ICD code extraction (yellow). 95% CI shown for both estimates children aged 1–5 months, 11.3 (6.1–20.9) per 1000 in Estimates of the proportion of influenza-positive adults children 6–11 months, and 1.4 (0.9–2.0) per 1000 in age 65+ were also generally lower than existing litera- children 12–59 months old in World Bank High Income ture. Jain et al. estimate that 4% adults aged 65–79 years countries [363]. Reeves et al. found admission rates for and 5% adults 80 or older hospitalized for pneumonia in RSV of 35.1 (32.9–38.9) per 1000 in children under 1 select US cities test positive for influenza [32]. Monto year and 5.31 (4.46–6.59) per 1000 in children age 1–4 et al. report that 10.9% of adults aged 50 or older pre- years old in England [364]. Estimates from the BIRD senting with acute respiratory illness are influenza posi- analysis as shown in Table 4 are lower in high-income tive, in a study of families in Ann Arbor Michigan over settings for children under 1 year of age than either 3 years [69]. Our analysis estimates 1.9% (0.02–8.4) of study, but fall between estimates of older children as de- ALRI admissions in ages 65+ in IHME high-income set- scribed in the literature. Further discussion and compar- tings are influenza positive cases. While the upper isons of the results of the BIRD analysis for RSV to bound of this estimate more closely aligns with existing other RSV estimation methods are available in related published literature, the proportion positive estimated literature [365]. from the BIRD project is low because of data sparsity in Our estimated admission rates for influenza are gener- oldest ages. The age spline method used in the MR-BRT ally an underestimate of rates previously published, par- analysis depends on age midpoint of meta-analysis input ticularly in the 65+ age group [366, 367]. For the USA data instead of accounting for an age range, which nar- and Sweden at age 65+, the simple extracted ICD-coded rows the number of estimates representing older ages. admission rate from administrative datasets surpasses Inclusion of additional meta-analysis data and incorpor- the rate produced by this study. The inclusion of non- ation of more sophisticated age range splitting could primary diagnoses did increase estimates for influenza in produce more robust proportion estimates in older ages. the USA by more than 50%. Nonetheless, these rates are The methodology employed by this analysis is compar- still lower than those produced by comparable studies in able to previous burden estimates for influenza produced the oldest age group. Previous studies estimate that any- by IHME in the application of a proportion model to es- where between 39.5 and 96.6% of all admissions across timates of total lower respiratory infection [368]. How- all ages for influenza have a primary diagnosis related to ever, estimates from the BIRD project were formed influenza, and the relative proportion of burden as a pri- using a categorical approach that did not account for the mary diagnosis in this analysis fall within that range relative risk of ALRI in cases of confirmed influenza or [359–362]. While using only the primary diagnosis RSV. Instead, the proportion of ALRI hospitalizations allowed us to maintain consistency with the 33 was assumed to be a proxy of total utilization. Addition- sources containing only primary diagnostic detail, ally, the BIRD analysis focuses exclusively on inpatient future iterations of this method should consider in- hospital utilization instead of incidence or mortality, clusion of non-primary diagnoses for more compre- which reduced the assumptions made about how trends hensive utilization estimation, if at the expense of in utilization can be extended to other metrics. Finally, geographic coverage. the hierarchical method of modeling proportion positive
Johnson et al. Population Health Metrics        (2021) 19:31                                                          Page 10 of 22

Table 3 Influenza rates by BIRD analysis and ICD code extraction for select locations
Country                              Age group                 BIRD rate per 100,000 (95% UI)   ICD-coded rate per 100,000 (95% UI)
Ecuador                              < 1 year                  64.5 (6–260.9)                   9.8 (9.1–10.6)
Ecuador                              1 to 4                    56.5 (4.3–210)                   5.5 (5.2–5.8)
Ecuador                              5 to 17                   22.1 (2.2–75.5)                  1.5 (1.4–1.6)
Ecuador                              18 to 49                  12.8 (1.7–39.6)                  1.8 (1.7–1.8)
Ecuador                              50 to 64                  10 (1–39.1)                      2.4 (2.2–2.6)
Ecuador                              65 plus                   10.5 (0.8–42.7)                  3.4 (3.1–3.7)
Georgia                              < 1 year                  50.3 (6.5–375.9)                 16.2 (9.7–22.7)
Georgia                              1 to 4                    54 (7.3–385.5)                   22.5 (18.8–26.1)
Georgia                              5 to 17                   46.2 (8–219.6)                   6.8 (5.6–8)
Georgia                              18 to 49                  23.5 (4–87.6)                    2.8 (2.4–3.3)
Georgia                              50 to 64                  19.8 (2.4–107.2)                 2.8 (2.1–3.5)
Georgia                              65 plus                   7.9 (0.9–64.8)                   2.8 (2–3.6)
India                                < 1 year                  11.1 (1–46.4)                    0.6 (0.6–0.7)
India                                1 to 4                    14.9 (1.5–59.8)                  1.1 (1.1–1.1)
India                                5 to 17                   10.5 (1.2–35.1)                  0.2 (0.2–0.2)
India                                18 to 49                  16.6 (2–47.7)                    3.7 (3.7–3.7)
India                                50 to 64                  10.2 (1–40.8)                    3.8 (3.7–3.8)
India                                65 plus                   5.9 (0.5–25.4)                   3.9 (3.8–3.9)
Mexico                               < 1 year                  98.4 (10.3–458.1)                4.3 (4.1–4.5)
Mexico                               1 to 4                    87 (9.3–388.3)                   7.1 (7–7.2)
Mexico                               5 to 17                   22.8 (3–74)                      1.9 (1.9–2)
Mexico                               18 to 49                  6.6 (0.9–21.6)                   0.8 (0.8–0.8)
Mexico                               50 to 64                  8.4 (0.9–33.2)                   1.5 (1.4–1.5)
Mexico                               65 plus                   7.3 (0.7–32.7)                   1.3 (1.2–1.4)
New Zealand                          < 1 year                  58 (6–231.5)                     15.7 (13.3–18.1)
New Zealand                          1 to 4                    131.6 (13.6–482.9)               46.7 (44.6–48.8)
New Zealand                          5 to 17                   18.1 (2.7–54)                    5.7 (5.3–6.1)
New Zealand                          18 to 49                  25.4 (3.8–66.7)                  5.7 (5.5–6)
New Zealand                          50 to 64                  13.6 (1.5–50.1)                  5.5 (5.1–5.9)
New Zealand                          65 plus                   11.3 (1–50.2)                    10.5 (9.8–11.2)
Philippines                          < 1 year                  104.4 (11.4–394.8)               11.6 (10.7–12.5)
Philippines                          1 to 4                    288.2 (32.6–1024)                53.7 (52.6–54.7)
Philippines                          5 to 17                   390.7 (60.8–1007.2)              66.2 (65.5–66.8)
Philippines                          18 to 49                  110.6 (18.8–267.5)               16.3 (16–16.6)
Philippines                          50 to 64                  91.4 (10.7–310.1)                14.5 (14–15)
Philippines                          65 plus                   42.5 (3.9–179.1)                 12.3 (11.6–13.1)
Sweden                               < 1 year                  128.5 (11.1–523.3)               25.2 (22.8–27.7)
Sweden                               1 to 4                    60.1 (6.9–294.4)                 22.3 (21.2–23.5)
Sweden                               5 to 17                   11.6 (1.8–82.7)                  4.8 (4.5–5.1)
Sweden                               18 to 49                  12 (2.1–63.8)                    3.5 (3.3–3.6)
Sweden                               50 to 64                  5.5 (0.7–41.9)                   5.9 (5.6–6.2)
Sweden                               65 plus                   5.8 (0.6–41.7)                   16.9 (16.2–17.5)
Turkey                               < 1 year                  50.8 (4.9–205.6)                 1.3 (0.8–1.8)
Turkey                               1 to 4                    284.7 (28–1137)                  8.4 (7.8–9)
Johnson et al. Population Health Metrics           (2021) 19:31                                                                                 Page 11 of 22

Table 3 Influenza rates by BIRD analysis and ICD code extraction for select locations (Continued)
Country                                 Age group                  BIRD rate per 100,000 (95% UI)                     ICD-coded rate per 100,000 (95% UI)
Turkey                                  5 to 17                    130.3 (16.5–400.1)                                 2.2 (2.1–2.4)
Turkey                                  18 to 49                   28.9 (4.1–83.5)                                    2.3 (2.2–2.4)
Turkey                                  50 to 64                   23.2 (2.4–90.7)                                    2.6 (2.4–2.8)
Turkey                                  65 plus                    15.3 (1.4–68.9)                                    5.6 (5.2–6.1)
United States of America                < 1 year                   168.4 (16.2–714.1)                                 139.5 (138.4–140.7)
United States of America                1 to 4                     43.4 (4.4–175.8)                                   36.1 (35.8–36.4)
United States of America                5 to 17                    16.6 (2.3–54.5)                                    7.2 (7.1–7.3)
United States of America                18 to 49                   27.8 (4.1–80.9)                                    4.8 (4.8–4.8)
United States of America                50 to 64                   31.6 (3.4–122.6)                                   9.6 (9.5–9.6)
United States of America                65 plus                    27 (2.5–122.6)                                     32 (31.8–32.2)
BIRD estimates of rates of influenza admission as compared to the rate from a raw ICD code extraction. BIRD and raw coded rate are produced across all years of
available data for each country

by region and super-region was a novel approach used                                Availability of inpatient admissions data in some lower-
in burden analysis to allow for estimates in locations                              to middle-income countries and meta-analysis data for
with sparser meta-analysis data to have more robust pro-                            RSV in older children and adults limited the scope of
portion estimates over age. IHME’s GBD global influ-                                this analysis, and additional sources of both types of data
enza admission rate estimates were higher than most of                              would improve accuracy of estimates. Availability of in-
those predicted for countries included in BIRD analysis,                            patient data and proportion meta-analysis at a seasonal
at 123.8 per 100,000 (CI: 48.5–300.2) across all ages as                            or monthly granularity would allow for more relevant
compared to BIRD all-age rates of 29.7 per 100,000 (CI:                             analysis during peak influenza and RSV seasons. Add-
3.64–101.7) in the USA to 195.81 (183.88–207.74) in the                             itionally, we encountered technical limitations in hand-
Philippines.                                                                        ling of meta-analysis with point estimates for proportion
  This study met limitations that are consistent with any                           positive spanning large age ranges, and in the assump-
analysis developed from clinical administrative data.                               tion made that influenza and RSV proportions across

Table 4 RSV rates by BIRD analysis and ICD code extraction for select locations
Country                                 Age group                  BIRD Rate per 100,000 (95% UI)                     ICD-coded rate per 100,000 (95% UI)
Ecuador                                 < 1 year                   525.9 (154.2–1069.9)                               0.1 (0–0.1)
Ecuador                                 1 to 4                     216.4 (40.5–508.3)                                 0 (0–0)
Georgia                                 < 1 year                   214.2 (71.2–1163.1)                                0.1 (0–2)
Georgia                                 1 to 4                     102.9 (28.6–595.6)                                 0 (0–0.5)
India                                   < 1 year                   83.4 (23.3–184.1)                                  0 (0–0)
India                                   1 to 4                     50.3 (12.1–127.4)                                  0 (0–0)
Mexico                                  < 1 year                   865.6 (306.8–2077.7)                               8.8 (8.4–9.1)
Mexico                                  1 to 4                     364.3 (101.4–992.8)                                3.2 (3.1–3.3)
New Zealand                             < 1 year                   318.3 (100.4–646.3)                                163.3 (155.6–171)
New Zealand                             1 to 4                     327.7 (82.2–781.2)                                 89.4 (86.5–92.2)
Philippines                             < 1 year                   429.4 (135.6–876.1)                                0.1 (0–0.2)
Philippines                             1 to 4                     536.1 (138.8–1306.9)                               0.1 (0–0.1)
Sweden                                  < 1 year                   750.8 (184–1744.6)                                 758.7 (746.1–771.3)
Sweden                                  1 to 4                     160.8 (43.1–581.1)                                 62 (60.2–63.9)
Turkey                                  < 1 year                   347.8 (107–711.8)                                  0.4 (0.1–0.7)
Turkey                                  1 to 4                     875 (224.2–2177)                                   1.5 (1.2–1.7)
United States of America                < 1 year                   1623.6 (595.2–3201.2)                              1557 (1553.2–1560.8)
United States of America                1 to 4                     209.2 (61.6–469.9)                                 118.4 (117.9–118.9)
BIRD estimates of rates of RSV admission as compared to the rate from a raw ICD code extraction. BIRD and raw coded rate are produced across all years of
available data for each country
Johnson et al. Population Health Metrics     (2021) 19:31                                                                                   Page 12 of 22

 Fig. 7 Primary versus nonprimary influenza admission rate in the USA, 2012. Influenza admission rate by diagnosis position, in US HCUP NIS data.
 Uncertainty is capped in order to show estimated age pattern

countries will follow the same pattern over age. Finally,                  provide accurate estimates of rates of disease and where
the rates estimated in this analysis represent utilization                 surveillance data are not available. However, the method
rates of influenza and RSV present in individuals who                      shows much uncertainty when considering influenza in
have a primary admission diagnosis of acute lower re-                      older adults that could be a function of considerable het-
spiratory infection. Accounting for non-inpatient care                     erogeneity in ALRI coding between countries (i.e., as pri-
including urgent or emergency departments and adjust-                      mary vs secondary cause), and in the age profile of
ments for non-primary diagnosis when ALRI is not the                       proportion positivity for influenza and RSV across stud-
primary reason for visit would further improve the esti-                   ies. While this method is interesting because it is based
mates produced by this analysis.                                           on clinical administrative data that is available from
  In addition to addressing the limitations described, fu-                 many countries globally, additional refinement of admis-
ture iterations of this methodology could be expanded                      sion processing methodology and inclusion of more data
to estimates of incidence or prevalence from utilization                   over ages would enable greater comparability to existing
by accounting for health care access and care-seeking                      influenza and RSV utilization literature.
behavior. Furthermore, deeper investigation of
goodness-of-fit of the proportion models through out of                    Abbreviations
                                                                           ALRI: Acute lower respiratory infections; RSV: Respiratory syncytial virus;
sample estimation would provide additional validation                      ICD: International Classification of Disease; BIRD: Burden of Influenza and RSV
for the methods proposed here and potentially identify                     Disease; IHME: Institute for Health Metrics and Evaluation; GBD: Global
additional areas for refinement of the proportion                          Burden of Disease; MR-BRT: Bayesian regularized trimmed meta-regression;
                                                                           HCUP NIS: Healthcare Cost and Utilization Project National Inpatient Sample
models.

Conclusions                                                                Supplementary Information
                                                                           The online version contains supplementary material available at https://doi.
Because of heterogeneity in coding practices between                       org/10.1186/s12963-021-00252-5.
countries and limited availability of data at sufficient
granularity for precise burden estimation, there are few                     Additional file 1. IHME Inpatient Data Metadata. Description of data:
reliable sources of influenza and RSV hospital utilization                   Detailed information including number of years of data, length of ICD
                                                                             codes, and total number of inpatient admissions for each source of
or incidence that are provided on a global scale. The ap-                    clinical administrative data used in this study. All data is in the custody of
plication of meta-analysis for proportion positive to                        the Institute of Health Metrics and Evaluation, and is available in the
overall ALRI utilization is a non-traditional means of es-                   Global Health Data Exchange (ghdx.healthdata.org).
timation that indicate promise in other applications                         Additional file 2. Influenza and RSV ICD Codes. Description of data: The
                                                                             ICD-9 and ICD-10 codes used to identify influenza and RSV admissions
where direct measurement of ICD diagnoses cannot
Johnson et al. Population Health Metrics (2021) 19:31 Page 13 of 22
from raw ICD extraction, to compare against the utilization rates pro- Edinburgh, Edinburgh, UK. 5Netherlands Institute for Health Services Research
duced by the BIRD study. (Nivel), Utrecht, Netherlands. 6Fogarty International Center, National Institutes
of Health, Bethesda, USA.
Additional file 3. Influenza and RSV Inpatient Admission Rates for All
Country-Years of Clinical Administrative Data. Description of data: Tabu- Received: 26 October 2020 Accepted: 31 March 2021
lated inpatient admission rates with uncertainty for all ages and years
available for each country included in the BIRD analysis. Countries where
clinical administrative data from IHME was available are all included in
this dataset.
References
1. James SL, Abate D, Abate KH, Abay SM, Abbafati C, Abbasi N, et al. Global,
Acknowledgements regional, and national incidence, prevalence, and years lived with disability
Thanks to Wil Van Cleve, Greg Roth and Zachary Jones who contributed to for 354 diseases and injuries for 195 countries and territories, 1990–2017: a
the production of this manuscript. systematic analysis for the Global Burden of Disease Study 2017. Lancet.
2018;392(10159):1789–858.
Authors’ contributions 2. United Kingdom - England Hospital Episode Statistics (HES) | GHDx . [cited
EJ contributed to data extraction, led data analysis and interpretation, and 2020 Mar 6]. Available from: http://ghdx.healthdata.org/series/united-
drafted the manuscript. DS contributed to data extraction and analysis and kingdom-england-hospital-episode-statistics-hes
provided critical review of the manuscript. SC designed the study, 3. United States Nationwide Inpatient Sample | GHDx. [cited 2020 Mar 6].
contributed to data interpretation, and provided critical review of the Available from: http://ghdx.healthdata.org/series/united-states-nationwide-
manuscript. CC designed the study, contributed to data interpretation, and inpatient-sample
provided critical review of the manuscript. YL contributed to data extraction, 4. He Y, Lin GY, Wang Q, Cai XY, Zhang YH, Lin CX, et al. A 3-year prospective
analysis, and interpretation and provided critical review of the manuscript. study of the epidemiology of acute respiratory viral infections in
CM designed the study, contributed to data interpretation, and provided hospitalized children in Shenzhen, China. Influenza Other Respir Viruses.
critical review of the manuscript. HN designed the study, contributed to data 2014;8(4):443–51.
interpretation, and provided critical review of the manuscript. JP designed 5. Zhang Q, Guo Z, Bai Z, MacDonald NE. A 4 year prospective study to
the study, contributed to data analysis, and interpretation and provided determine risk factors for severe community acquired pneumonia in
critical review of the manuscript. TP contributed to data analysis and children in southern China. IPediatr Pulmonoli. 2013;48(4):390–7.
interpretation and provided critical review of the manuscript. TS contributed 6. Lindblade KA, Arvelo W, Gray J, Estevez A, Frenkel G, Reyes L, et al. A
to data extraction and provided critical review of the manuscript. CV comparison of the epidemiology and clinical presentation of seasonal
designed the study, contributed to data interpretation and provided critical influenza A and 2009 pandemic influenza A (H1N1) in Guatemala. IPLoS
review of the manuscript. SJ designed the study, contributed to data Onei. 2010;5(12):15826.
interpretation, and provided critical review of the manuscript. All authors 7. Hammitt LL, Kazungu S, Morpeth SC, Gibson DG, Mvera B, Brent AJ, et al. A
have read, provided comments, and approved this manuscript. preliminary study of pneumonia etiology among hospitalized children in
Kenya. IClin Infect Disi. 2012;54(Supp 2):190–9.
Funding 8. Maruyama T, Niederman MS, Kobayashi T, Kobayashi H, Takagi T,
The BIRD project was supported by a grant from the Foundation for D’Alessandro-Gabazza CN, et al. A prospective comparison of nursing
Influenza Epidemiology (www.ghisn.org). The funding source for this project home-acquired pneumonia with hospital-acquired pneumonia in non-
was not involved in study design, data extraction and analysis, interpretation intubated elderly. IRespir Medi. 2008;102(9):1287–95.
of results or drafting of the manuscript. Sandra S Chaves and Cedric Mahe 9. Vong S, Guillard B, Borand L, Rammaert B, Goyet S, Te V, et al. Acute lower
contributed to the, interpretation of results and writing up of the manuscript respiratory infections in 5 year -old hospitalized patients in Cambodia, a
and report as members of the Foundation. low-income tropical country: clinical characteristics and pathogenic
etiology. IBMC Infect Disi. 2013;97.
Availability of data and materials 10. Hijazi Z, Pacsa A, El-Gharbawy F, Chugh TD, Essa S, El Shazli A, et al. Acute
Inpatient admissions datasets and influenza meta-analysis data as used in this lower respiratory tract infections in children in Kuwait. IAnn Trop Paediatri.
analysis are available via IHME’s Global Health Data Exchange (GHDx), http:// 1997;17(2):127–34.
ghdx.healthdata.org/ [2, 3, 369–390]. 11. Rahman M, Huq F, Sack DA, Butler T, Azad AK, Alam A, et al. Acute lower
RSV meta-analysis data is available through the Edinburgh Datashare, https:// respiratory tract infections in hospitalized patients with diarrhea in Dhaka.
datashare.is.ed.ac.uk/handle/10283/3611 [365]. Bangladesh IRev Infect Disi. 1990;12(Suppl 8):899–906.
12. Guerrier G, Goyet S, Chheng ET, Rammaert B, Borand L, Te V, et al. Acute
Declarations viral lower respiratory tract infections in Cambodian children: clinical and
epidemiologic characteristics. IPediatr Infect Ji. 2013;32(1):8–13.
Ethics approval and consent to participate 13. García CS, Docón AM, Piñero JA, Miguelez SA, Bendicho MAI. Aetiology of
Not applicable. bronchiolitis in hospitalised children in South-East Spain. IAn Pediatr Barci.
2012;77(6):386–90.
Consent for publication 14. Sangil A, Calbo E, Robles A, Benet S, Viladot ME, Pascual V, et al. Aetiology
Not applicable. of community-acquired pneumonia among adults in an H1N1 pandemic
year: the role of respiratory viruses. IEur J Clin Microbiol Infect Disi. 2012;
Competing interests 31(10):2765–72.
Sandra S Chaves and Cedric Mahe are employees of Sanofi Pasteur, but the 15. Quandelacy TM, Viboud C, Charu V, Lipsitch M, Goldstein E. Age- and sex-
content of this paper is not representative of the views of their organization. related risk factors for influenza-associated mortality in the United States
Spencer L James is an employee of Genentech, a subsidiary of Roche, but between 1997-2007. IAm J Epidemioli. 2014;179(2):156–67.
was an employee of IHME during his involvement in the grant. Cecile 16. Gowin E, Bartkowska-Sniatkowska A, Jonczyk-Potoczna K, Wysocka-
Viboud is an employee of the NIH, but this study does not necessarily Leszczynska J, Bobkowski W, Fichna P, et al. Assessment of the usefulness of
represent the views of the NIH or the US government. All other authors multiplex real-time PCR tests in the diagnostic and therapeutic process of
declare no competing interests. pneumonia in hospitalized children: a single-center experience. Biomed Res
Int. 2017;2017:8037963.
Author details 17. Nascimento-Carvalho CM, Araujo-Neto CA, Ruuskanen O. Association
1
Institute of Health Metrics and Evaluation, University of Washington, Seattle, between bacterial infection and radiologically confirmed pneumonia
USA. 2Foundation for Influenza Epidemiology, Fondation de France, Paris, among children. IPediatr Infect Ji. 2015;34(5):490–3.
France. 3Vaccine Epidemiology and Modeling Department, Sanofi Pasteur, 18. Grijalva CG, Zhu Y, Williams DJ, Self WH, Ampofo K, Pavia AT, et al.
Lyon, France. 4Centre for Global Health, Usher Institute, University of Association between hospitalization with community-acquired laboratory-Johnson et al. Population Health Metrics (2021) 19:31 Page 14 of 22
confirmed influenza pneumonia and prior receipt of influenza vaccination. 38. Woolpert T, Brodine S, Lemus H, Waalen J, Blair P, Faix D. Determination of
JAMA. 2015;314(14):1488–97. clinical and demographic predictors of laboratory-confirmed influenza with
19. Wolf DG, Greenberg D, Shemer-Avni Y, Givon-Lavi N, Bar-Ziv J, Dagan R. subtype analysis. IBMC Infect Disi. 2012;12:129.
Association of human metapneumovirus with radiologically diagnosed 39. Moreno L, Krishnan JA, Duran P, Ferrero F. Development and validation of a
community-acquired alveolar pneumonia in young children. IJ Pediatri. clinical prediction rule to distinguish bacterial from viral pneumonia in
2010;156(1):115–20. children. IPediatr Pulmonoli. 2006;41(4):331–7.
20. Kelly MS, Smieja M, Luinstra K, Wirth KE, Goldfarb DM, Steenhoff AP, et al. 40. Levy NS, Nguyen TQ, Westheimer E, Layton M. Disparities in the severity of
Association of respiratory viruses with outcomes of severe childhood influenza illness: a descriptive study of hospitalized and nonhospitalized
pneumonia in Botswana. IPLoS Onei. 2015;10(5):0126593. novel H1N1 influenza-positive patients in New York City: 2009-2010
21. Reechaipichitkul W, Thavornpitak Y, Sutra S. Burden of adult pneumonia in influenza season. IJ Public Health Manag Practi. 2013;19(1):16–24.
Thailand: a nationwide hospital admission data 2010. IJ Med Assoc Thaii. 41. Shu LH, Xu JJ, Wang S, Zhong HQ, Dong XY, Jiang K, et al. Distribution of
2014;97(3):283–92. pathogenic microorganisms and its relationship with clinical features in
22. Tran DN, Trinh QD, Pham NTK, Vu MP, Ha MT, Nguyen TQN, et al. Clinical children with community-acquired pneumonia. IChin J Contemp Pediatri.
and epidemiological characteristics of acute respiratory virus infections in 2015;17(10):1056–61.
Vietnamese children. IEpidemiol Infecti. 2015:1–10. 42. Guo RN, Zheng HZ, Huang LQ, Zhou Y, Zhang X, Liang CK, et al.
23. Lee JE, Choe K-W, Lee SW. Clinical and radiological characteristics of 2009 Epidemiologic and economic burden of influenza in the outpatient setting:
H1N1 influenza associated pneumonia in young male adults. IYonsei Med Ji. a prospective study in a subtropical area of China. IPLoS Onei. 2012;7(7):
2013;54(4):927–34. 41403.
24. Galindo-Fraga A, Ortiz-Hernandez AA, Ramírez-Venegas A, Vazquez RV, 43. Li H, Wei Q, Tan A, Wang L. Epidemiological analysis of respiratory viral
Moreno-Espinosa S, Llamosas-Gallardo B, et al. Clinical characteristics and etiology for influenza-like illness during 2010 in Zhuhai, China. IVirol Ji. 2013;
outcomes of influenza and other influenza-like illnesses in Mexico City. IInt J 143.
Infect Disi. 2013;17(7):510–7. 44. Sung RYT, Cheng AFB, Chan RCK, Tam JS, Oppenheimer SJ. Epidemiology
25. Ishida T, Tachibana H, Ito A, Tanaka M, Tokioka F, Furuta K, et al. Clinical and Etiology of Pneumonia in Children in Hong Kong. IClin Infect Disi. 1993;
characteristics of severe community-acquired pneumonia among younger 17(5):894–6.
patients: an analysis of 18 years at a community hospital. IJ Infect 45. Khor CS, Sam IC, Hooi PS, Quek KF, Chan YF. Epidemiology and seasonality
Chemotheri. 2014;20(8):471–6. of respiratory viral infections in hospitalized children in Kuala Lumpur,
26. Hong KW, Cheong HJ, Choi WS, Lee J, Wie SH, Baek JH, et al. Clinical Malaysia: a retrospective study of 27 years. IBMC Pediatri. 2012;12:32.
courses and outcomes of hospitalized adult patients with seasonal influenza 46. Minodier L, Arena C, Heuze G, Ruello M, Amoros JP, Souty C, et al.
in Korea, 2011-2012: hospital-based Influenza morbidity & mortality (HIMM) Epidemiology and viral etiology of the influenza-like illness in corsica during
surveillance. IJ Infect Chemotheri. 2014;20(1):9–14. the 2012-2013 Winter: an analysis of several sentinel surveillance systems.
27. Mathur S, Dubey T, Kulshrestha M, Agarwal H, Mathur G, Mathur A, et al. IPLoS Onei. 2014;9(6):100388.
Clinical profile and mortality among novel influenza A (H1N1) infected 47. Liu WK, Liu Q, Chen DH, Liang HX, Chen XK, Chen MX, et al. Epidemiology
patients: 2009-2010 Jodhpur, Rajasthan pandemic. IJ Assoc Physicians Indiai. of acute respiratory infections in children in Guangzhou: a three-year study.
2013;61(9):627–32. IPLoS Onei. 2014;9(5):96674.
28. Singh V, Sharma BB, Patel V, Poonia S. Clinical profile of pneumonia and its 48. Kim JK, Jeon JS, Kim JW, Rheem I. Epidemiology of respiratory viral infection
association with rain wetting in patients admitted at a tertiary care institute using multiplex rt-PCR in Cheonan, Korea (2006-2010). IJ Microbiol
during pandemic of influenza A (H1N1) pdm09 virus infection. IIndian J Biotechnoli. 2013;23(2):267–73.
Chest Allied Scii. 2014;56(1):21–6. 49. Vallés J, Martin-Loeches I, Torres A, Diaz E, Seijas I, López MJ, et al.
29. Hara K, Yahara K, Gotoh K, Nakazono Y, Kashiwagi T, Imamura Y, et al. Epidemiology, antibiotic therapy and clinical outcomes of healthcare-
Clinical study concerning the relationship between community-acquired associated pneumonia in critically ill patients: a Spanish cohort study.
pneumonia and viral infection in northern Thailand. IIntern Medi. 2011;50(9): IIntensive Care Medi. 2014;40(4):572–81.
991–8. 50. Koksal I, Bayraktar O, Yilmaz G, Caylan R, Aydin K, Sucu N, et al. Etiological
30. Maruyama T, Gabazza EC, Morser J, Takagi T, D’Alessandro-Gabazza C, agents of community-acquired pneumonia in adult patients in Turkey; a
Hirohata S, et al. Community-acquired pneumonia and nursing home- multicentric, cross-sectional study. ITuberk Toraksi. 2010;58(2):119–27.
acquired pneumonia in the very elderly patients. IRespir Medi. 2010;104(4): 51. Liu YF, Gao Y, Chen MF, Cao B, Yang XH, Wei L. Etiological analysis and
584–92. predictive diagnostic model building of community-acquired pneumonia in
31. Viasus D, Marinescu C, Villoslada A, Cordero E, Galvez-Acebal J, Farinas MC, adult outpatients in Beijing, China. IBMC Infect Disi. 2013;13:309.
et al. Community-acquired pneumonia during the first post-pandemic 52. Ferronato AE, Gilio AE, Ferraro AA, Md P, Vieira SE. Etiological diagnosis
influenza season: a prospective, multicentre cohort study. IJ Infecti. 2013; reduces the use of antibiotics in infants with bronchiolitis. Clinics (Sao
67(3):185–93. Paulo). 2012;67:1001–6.
32. Jain S, Self WH, Wunderink RG, Fakhran S, Balk R, Bramley AM, et al. 53. Yang X, Yao Y, Chen M, Yang X, Xie Y, Liu Y, et al. Etiology and clinical
Community-acquired pneumonia requiring hospitalization among U.S. characteristics of influenza-like illness (ILI). Outpatients Beijing. PLoS One.
adults. Engl J Medi. 2015;373(5):415–27. 2010;7(1):28786.
33. Peci A, Winter AL, Gubbay JB, Skowronski DM, Balogun EI, De Lima C, 54. Yu X, Lu R, Wang Z, Zhu N, Wang W, Julian D, et al. Etiology and clinical
et al. Community-acquired respiratory viruses and co-infection among characterization of respiratory virus infections in adult patients attending an
patients of Ontario sentinel practices. Influenza Other Respir Viruses. emergency department in Beijing. IPLoS Onei. 2012;7(2):32174.
2009;7:559–66. 55. Tajima T, Nakayama E, Kondo Y, Hirai F, Ito H, Iitsuka T, et al. Etiology and
34. Hoo Lee J, Hyung KY. Comparison of clinical characteristics between clinical study of community-acquired pneumonia in 157 hospitalized
healthcare-associated pneumonia and community-acquired pneumonia in children. IJ Infect Chemotheri. 2006;12(6):372–9.
patients admitted to secondary hospitals. Braz J Infect Dis Off Publ Braz Soc 56. O’Callaghan-Gordo C, Bassat Q, Morais L, Díez-Padrisa N, Machevo S,
Infect Dis. 2012 Aug;16(4):321–8. Nhampossa T, et al. Etiology and epidemiology of viral pneumonia among
35. Papenburg J, Hamelin ME, Ouhoummane N, Carbonneau J, Ouakki M, hospitalized children in rural Mozambique: a malaria endemic area with
Raymond F, et al. Comparison of risk factors for human metapneumovirus high prevalence of human immunodeficiency virus. IPediatr Infect Ji. 2011;
and respiratory syncytial virus disease severity in young children. IJ Infect 30(1):39–44.
Disi. 2012;206(2):178–89. 57. Ishiguro T, Takayanagi N, Yamaguchi S, Yamakawa H, Nakamoto K,
36. Gern JE, Pappas T, Visness CM, Jaffee KF, Lemanske RF, Togias A, et al. Takaku Y, et al. Etiology and factors contributing to the severity and
Comparison of the etiology of viral respiratory illnesses in inner-city and mortality of community-acquired pneumonia. IIntern Medi. 2013;52(3):
suburban infants. IJ Infect Disi. 2012;206(9):1342–9. 317–24.
37. Li QH, Gao WJ, Li JY, Shi LA, Hao XJ, Ge SW, et al. Detection of respiratory 58. Schlaudecker EP, Heck JP, Macintyre ET, Martinez R, Dodd CN, McNeal MM,
viruses in children with acute lower respiratory tract infection: an analysis of et al. Etiology and seasonality of viral respiratory infections in rural
5,150 children. IChin J Contemp Pediatri. 2016;18(1):51–4. Honduran children. IPediatr Infect Ji. 2012;31(11):1113–8.Johnson et al. Population Health Metrics (2021) 19:31 Page 15 of 22
59. Tupasi TE, Lucero MG, Magdangal DM, Mangubat NV, Sunico ME, Torres CU, pneumonia admitted to the intensive care unit: results from the Severe
et al. Etiology of acute lower respiratory tract infection in children from Influenza Pneumonia Surveillance (SIPS) project. IEur J Clin Microbiol Infect
Alabang, Metro Manila. IRev Infect Disi. 1990;12(Suppl 8):929–39. Disi. 2013;32(5):705–10.
60. Forgie IM, O’Neill KP, Lloyd-Evans N, Leinonen M, Campbell H, Whittle HC, 80. Marcone DN, Durand LO, Azziz-Baumgartner E, Vidaurreta S, Ekstrom J,
et al. Etiology of acute lower respiratory tract infections in Gambian Carballal G, et al. Incidence of viral respiratory infections in a prospective
children: I Acute lower respiratory tract infections in infants presenting at cohort of outpatient and hospitalized children aged ≤5 years and its
the hospital. IPediatr Infect Ji. 1991;10(1):33–41. associated cost in Buenos Aires, Argentina. IBMC Infect Disi. 2015;15:447.
61. Forgie IM, O’Neill KP, Lloyd-Evans N, Leinonen M, Campbell H, Whittle HC, 81. Lahti E, Peltola V, Waris M, Virkki R, Rantakokko-Jalava K, Jalava J, et al.
et al. Etiology of acute lower respiratory tract infections in Gambian Induced sputum in the diagnosis of childhood community-acquired
children: II Acute lower respiratory tract infection in children ages one to pneumonia. Thorax. 2009;64(3):252–7.
nine years presenting at the hospital. IPediatr Infect Ji. 1991;10(1):42–7. 82. Mardy S, Ly S, Heng S, Vong S, Huch C, Nora C, et al. Influenza activity in
62. John TJ, Cherian T, Steinhoff MC, Simoes EA, John M. Etiology of acute Cambodia during 2006-2008. IBMC Infect Disi. 2009;9:168.
respiratory infections in children in tropical southern India. IRev Infect Disi. 83. Zimmerman RK, Rinaldo CR, Nowalk MP, Gk B, Thompson MG, Moehling KK,
1991;13(Suppl 6):463–9. et al. Influenza and other respiratory virus infections in outpatients with
63. Holter JC, Muller F, Bjorang O, Samdal HH, Marthinsen JB, Jenum PA, et al. medically attended acute respiratory infection during the 2011-12 influenza
Etiology of community-acquired pneumonia and diagnostic yields of season. IInfluenza Respir Virusesi. 2014;8(4):397–405.
microbiological methods: a 3-year prospective study in Norway. IBMC Infect 84. Laguna-Torres VA, Sánchez-Largaespada JF, Lorenzana I, Forshey B, Aguilar
Disi. 2015;15:64. P, Jimenez M, et al. Influenza and other respiratory viruses in three Central
64. Shibli F, Flatau E, Nitzan O, Chazan B, Edelstein H, Raz R, et al. Etiology of American countries. IInfluenza Respir Virusesi. 2011;5(2):123–34.
community-acquired pneumonia in hospitalized patients in Northern Israel. 85. Onyango CO, Njeru R, Kazungu S, Achilla R, Bulimo W, Welch CSR, et al.
IIsr Med Assoc Ji. 2010;12(8):477–82. Influenza surveillance among children with pneumonia admitted to a district
65. Johansson N, Kalin M, Tiveljung-Lindell A, Giske CG, Hedlund J. Etiology of hospital in coastal Kenya, 2007-2010. IJ Infect Disi. 2012;206(Suppl 1):61–7.
community-acquired pneumonia: increased microbiological yield with new 86. Radin JM, Katz MA, Tempia S, Talla Nzussouo N, Davis R, Duque J, et al.
diagnostic methods. IClin Infect Disi. 2010;50(2):202–9. Influenza surveillance in 15 countries in Africa, 2006-2010. J Infect Dis. 2012;
66. Hartung TK, Chimbayo D, Oosterhout JJG, Chikaonda T, Doornum GJJ, Claas 206:14–21.
ECJ, et al. Etiology of suspected pneumonia in adults admitted to a high- 87. Tessmer A, Welte T, Schmidt-Ott R, Eberle S, Barten G, Suttorp N, et al.
dependency unit in Blantyre. Malawi IAm J Trop Med Hygi. 2011;85(1):105–12. Influenza vaccination is associated with reduced severity of community-
67. Lin Y, Fu Y, Xu M, Su L, Cao L, Xu J, et al. Evaluation of a PCR/ESI-MS acquired pneumonia. IEur Respir Ji. 2011;38(1):147–53.
platform to identify respiratory viruses from nasopharyngeal aspirates. IJ 88. Mermond S, Zurawski V, D’Ortenzio E, Driscoll AJ, DeLuca AN, Deloria-Knoll
Med Viroli. 2015;87(11):1867–71. M, et al. Lower respiratory infections among hospitalized children in New
68. Kelly PM, Kotsimbos T, Reynolds A, Wood-Baker R, Hancox B, Brown SGA, Caledonia: a pilot study for the Pneumonia Etiology Research for Child
et al. FluCAN 2009: initial results from sentinel surveillance for adult Health project. IClin Infect Disi. 2012;54:180–9.
influenza and pneumonia in eight Australian hospitals. IMed J Austi. 2011; 89. Martín-Loeches I, Bermejo-Martin JF, Vallés J, Granada R, Vidaur L, Vergara-
194(4):169–74. Serrano JC, et al. Macrolide-based regimens in absence of bacterial co-
69. Monto AS, Malosh RE, Petrie JG, Thompson MG, Ohmit SE. Frequency of infection in critically ill H1N1 patients with primary viral pneumonia.
acute respiratory illnesses and circulation of respiratory viruses in IIntensive Care Medi. 2013;39(4):693–702.
households with children over 3 surveillance seasons. IJ Infect Disi. 2014; 90. Sundaram ME, Meece JK, Sifakis F, Gasser RA, Belongia EA. Medically
210(11):1792–9. attended respiratory syncytial virus infections in adults aged? 50 years:
70. Hernandez-Bou S, Novell CB, Alins JG, García-García JJ. Hospitalized children clinical characteristics and outcomes. IClin Infect Disi. 2014;58(3):342–9.
with influenza A H1N1 (2009) infection: a Spanish multicenter study. IPediatr 91. Henrickson KJ, Hoover S, Kehl KS, Hua W. National disease burden of
Emerg Carei. 2013;29(1):49–52. respiratory viruses detected in children by polymerase chain reaction.
71. von Baum H, Schweiger B, Welte T, Marre R, Suttorp N, Pletz MWR, et al. IPediatr Infect Ji. 2004;23(1 Suppl):11–8.
How deadly is seasonal influenza-associated pneumonia? The German 92. Lynfield R, Davey R, Dwyer DE, Losso MH, Wentworth D, Cozzi-Lepri A, et al.
Competence Network for Community-Acquired Pneumonia. IEur Respir Ji. Outcomes of influenza A(H1N1)pdm09 virus infection: results from two
2011;37(5):1151–7. international cohort studies. IPLoS Onei. 2014;9(7):101785.
72. Lu G, Li J, Xie Z, Liu C, Guo L, Vernet G, et al. Human metapneumovirus 93. Fitter DL, Freeman NM, Buteau J, Magloire R, Sessions WM, Guo L, et al.
associated with community-acquired pneumonia in children in Beijing, Pandemic H1N1 influenza surveillance in Haiti, July-December 2009.
China. IJ Med Viroli. 2013;85(1):138–43. IInfluenza Respir Virusesi. 2013;7(5):772–5.
73. Sung RYT, Chan PKS, Tsen T, Li AM, Lam WY, Yeung ACM, et al. 94. Peng Y, Shu C, Fu Z, Li QB, Liu Z, Yan L. Pathogen detection of 1 613 cases
Identification of viral and atypical bacterial pathogens in children of hospitalized children with community acquired pneumonia. IChin J
hospitalized with acute respiratory infections in Hong Kong by multiplex Contemp Pediatri. 2015;17(11):1193–9.
PCR assays. IJ Med Viroli. 2009;81(1):153–9. 95. Williams JV, Edwards KM, Weinberg GA, Griffin MR, Hall CB, Zhu Y, et al.
74. Hasan R, Rhodes J, Thamthitiwat S, Olsen SJ, Prapasiri P, Naorat S, et al. Population-based incidence of human metapneumovirus infection among
Incidence and etiology of acute lower respiratory tract infections in hospitalized children. IJ Infect Disi. 2010;201(12):1890–8.
hospitalized children younger than 5 years in rural Thailand. IPediatr Infect 96. Nasreen S, Luby SP, Brooks WA, Homaira N, Al Mamun A, Bhuiyan MU, et al.
Ji. 2014;33(2):45–52. Population-based incidence of severe acute respiratory virus infections among
75. Palmu AA, Saukkoriipi A, Snellman M, Jokinen J, Torkko P, Ziegler T, et al. children agedYou can also read