Portable Raman leaf clip sensor for rapid detection of plant stress - Nature
←
→
Page content transcription
If your browser does not render page correctly, please read the page content below
www.nature.com/scientificreports
OPEN Portable Raman leaf‑clip sensor
for rapid detection of plant stress
Shilpi Gupta1,4, Chung Hao Huang2,4, Gajendra Pratap Singh1, Bong Soo Park2,
Nam‑Hai Chua1,2* & Rajeev J. Ram1,3*
Precision agriculture requires new technologies for rapid diagnosis of plant stresses, such as nutrient
deficiency and drought, before the onset of visible symptoms and subsequent yield loss. Here, we
demonstrate a portable Raman probe that clips around a leaf for rapid, in vivo spectral analysis of
plant metabolites including carotenoids and nitrates. We use the leaf-clip Raman sensor for early
diagnosis of nitrogen deficiency of the model plant Arabidopsis thaliana as well as two important
vegetable crops, Pak Choi (Brassica rapa chinensis) and Choy Sum (Brassica rapa var. parachinensis). In
vivo measurements using the portable leaf-clip Raman sensor under full-light growth conditions were
consistent with those obtained with a benchtop Raman spectrometer measurements on leaf-sections
under laboratory conditions. The portable leaf-clip Raman sensor offers farmers and plant scientists
a new precision agriculture tool for early diagnosis and real-time monitoring of plant stresses in field
conditions.
Motivated by food insecurity arising from a growing global p opulation1–3 and climate c hange4–6, Precision Agri-
culture has been proposed as a strategy to increase agriculture productivity while enhancing sustainability. One
important objective of Precision Agriculture is to determine the state of plant health before symptomatic mani-
festation and yield loss arising from abiotic or biotic stresses, i.e. to distinguish the stressed phenotype from the
unstressed phenotype. However, characterizing plant phenotypes is costly and time consuming and presents a
bottleneck in crop management as well as in the screening of progeny in crop breeding p rograms7. Technologies
for rapid stress phenotyping can contribute to enhanced productivity of major food crops around the world8.
To address this need, optical techniques have been explored extensively for agricultural phenotyping. Optical
imaging is used to measure plant morphology and structure (height, size, leaf area, etc.)9,10. Reflectance spectros-
copy has been used to assess chemical constituents (e.g. chlorophyll and carotenoids) of plant leaves rapidly and
non-destructively11,12. These nondestructive measurements allow repeated measurements for the quantification
of a plant’s dynamic response including growth and stress r esponse13,14. However, changes in the reflectance or
transmittance are similar for several abiotic s tresses15–17 as well as general stress r esponse18–21. Stress markers
associated with changes in spectral reflectance also take time to accumulate; moreover, these markers may not
allow for early stress detection to mitigate yield loss. Raman spectroscopy offers the possibility of a specific and
early diagnostic t ool18,22–29.
In recent years, there has been growing interest in Raman spectroscopy as a high-content phenotyping tool for
Precision Agriculture. Handheld Raman spectrometers have been used to monitor plant health and development,
early diagnosis of disease, and biotic and abiotic stresses in plants18,22–29. In the reported literature for plant Raman
spectroscopy18,28–31, either a leaf sample was collected from plants and stored until spectrum acquisition20,26–28 or
whole plants were positioned around a spectrometer and leaves were placed on a sample holder without physi-
cal detachment from the p lant18,29,30. Here, we demonstrate a leaf-clip based Raman probe that allows for rapid,
reproducible in vivo measurements on plants growing in plant rooms and farms.
Raman spectroscopy measures the shift in the energy of a scattered photon resulting from the interaction
of the photon with the vibrational or rotational states associated with the covalent bonds in the constituent
molecules31,32. A Raman spectrum can be treated as a chemical fingerprint for different compounds as each peak
in the Raman spectrum corresponds to a particular Raman active vibration of a molecule. However, this inelastic
Raman scattering process is weak when compared to Rayleigh scattering or with direct absorption of photons.
Leaf-clip sensors have previously only been used to assess leaf absorption (transmittance) or fluorescence. The
1
Disruptive & Sustainable Technologies for Agricultural Precision, Singapore-MIT Alliance for Research and
Technology, 1 Create Way, #03‑06/07/8 Research Wing, Singapore 138602, Singapore. 2Temasek Life Science
Laboratory, 1 Research Link, National University of Singapore, Singapore 117604, Singapore. 3Research
Laboratory of Electronics, Massachusetts Institute of Technology, 77 Massachusetts Avenue, 36‑491, Cambridge,
MA 02139, USA. 4These authors contributed equally: Shilpi Gupta and Chung Hao Huang. *email: chua@
mail.rockefeller.edu; rajeev@mit.edu
Scientific Reports | (2020) 10:20206 | https://doi.org/10.1038/s41598-020-76485-5 1
Vol.:(0123456789)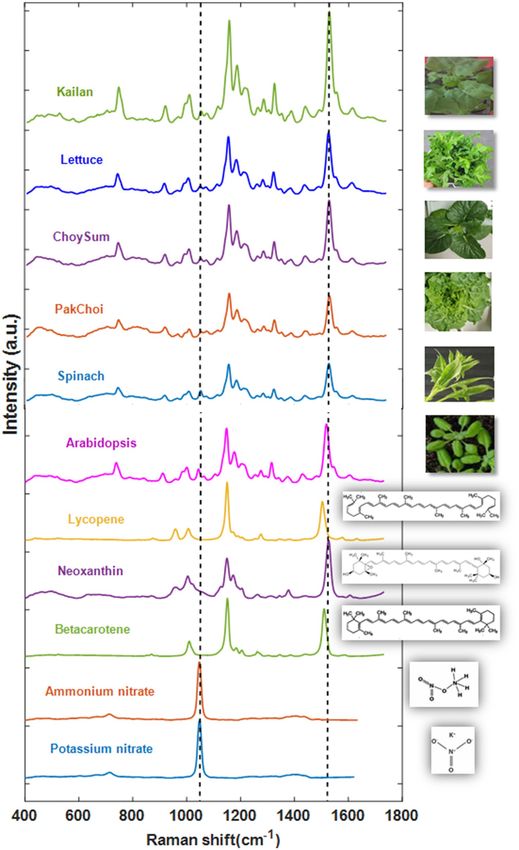
www.nature.com/scientificreports/
leaf-clip format for optical sensing was first introduced by I nada33,39 and transmission based leaf-clip sensors have
been commercialized by several vendors34,35. These leaf-clip sensors for chlorophyll are affected by leaf anatomy,
cuticle reflectance, leaf veins, and the flatness of leaves36,37. Variability in the transmission and absorption of light
due to leaf heterogeneity requires careful calibration for each plant species.
Instrumentation for portable Raman leaf‑clip. The leaf-clip Raman sensor demonstrated here uses a
Raman fiber probe connected to a portable Raman instrument using an 830 nm excitation laser. The leaf-clip
simultaneously: (1) maintains the probe-to-leaf sample distance, (2) gently holds the leaf so as to suppress rela-
tive beam displacement over the leaf surface, (3) blocks ambient light, (4) blocks the transmitted laser radiation
rendering the device eye-safe, and (5) provides a comfortable handhold. As described below the multiplicity
of analytes observable in the Raman spectra allows us to establish internal references that make Raman-based
diagnostics less sensitive to variations in transmission and absorption as previously described leaf-clip sensors.
The leaf-clip Raman sensor consists of a 3D printed clip that is built around a fiber-based Raman probe assem-
bly. An anodized aluminium Raman probe (InPhotonics) (4.2″ × 1.5″ × 0.5″) with 1.5″ long stainless-steel tip is
used for sample illumination and light collection optics. The Raman p robe38 incorporates a minimum number
of optical components in a small, robust probe-head for optimum performance and experimental versatility.
Infrared laser excitation light at 830 nm is supplied through a 105 µm core fiber. The probe assembly includes thin
film filters to remove amplified spontaneous emission from the excitation source. This excitation light is focused
onto the sample through a focusing lens and window with a useful working distance of 7.5 mm. Back-scattered
Raman light is collected by the same lens and transmitted through an excitation blocking filter. Figure 1a shows
the Raman spectra of the plant leaf sample illuminated by 830 nm laser with different laser power. Varying the
laser power from 75 mW (minimum) to 405 mW (maximum) shows no significant difference in the acquired
Raman spectra. Here, typical operating conditions utilize 130 mW of 830 nm laser excitation at the sample.
The leaf-clip interface was designed to quickly and reproducibly place the leaf at a fixed distance from the
collection lens in the fiber probe. Stereolithographic 3D printing of methacrylate photopolymers was used to
create a holder for the fiber probe and the leaf (Fig. 1c,d). The probe is held firmly in place with set-screws and
the leaf is held in place by a 3D printed clip with embedded magnets. Opposing magnets are used to hold the
leaf steady without otherwise damaging the leaf tissue. The clip also blocks leakage of daylight into the Raman
probe and incorporates a tilted surface to block the transmitted laser light for eye-safe operation and suppress
back-reflection into the fiber probe.
The laser (Innovative Photonic Systems USA, 830 nm excitation) and spectrometer (Avantes HSC Symmetri-
cal Czerny-Turner, 100 mm focal length, NA: 0.13 optical bench and a TE cooled 1024 × 58 back thinned CCD
detector) were integrated into a single, portable instrument box with software controls by TechnoSpex Pte Ltd
(Fig. 1b). The spectral span of the instrument was 100 cm−1 to 2000 cm−1 and the spectral resolution was 10 cm−1.
Reference benchtop Raman instrument. Reference Raman measurements were performed in the labo-
ratory and spectra were acquired using Kymera 328i spectrograph (Andor, UK) employing a 600 g mm−1 optical
grating and 830 nm excitation. We measured the Raman spectra of leaf sections placed on a 100 µm thick fused
silica slide, from two locations per leaf (one on each side of the midvein) from the entire cross-section of a leaf39.
In Ref.39, nitrate measurements using this benchtop Raman instrument were validated against chemical analysis
of nitrate40 for several plant species. Further validation was acquired by measurements of wild-type Arabidopsis
thaliana as well as mutants affected in metabolic pathways associated with nitrogen uptake. R eference39 also
demonstrates that time-series Raman spectra provide early diagnosis of nitrogen deficiency and can be used to
guide crop management.
Spectral analysis. The designed Raman leaf-clip sensor is demonstrated for in vivo and in situ acquisition
of Raman spectra under growing conditions for a wide range of vegetable plants (Kailan, Lettuce, Choy Sum,
Pak Choi, and Spinach) as well as the model plant Arabidopsis thaliana. For each sample, 5 spectra were col-
lected with an integration time of 10 s per sample spot. Cosmic ray events were identified in the 10 s spectra
and removed. After cosmic ray removal, the individual 10 s spectra were smoothed across wavelength using the
Savitzky-Golay filter function (MATLAB Inc., USA). Savitzky-Golay filter is used to smooth spectra in order to
reduce the impact of noise on statistical classification41,42. A representative sample spectrum was created by tak-
ing the mean value of the five filtered and smoothed spectra at each wavelength. The sample spectrum resulting
from this processing contained Raman and fluorescence signal. To generate the Raman spectrum presented in
the results section any residual fluorescence was removed by performing a positive residual style polynomial
subtraction as described in reference42. All the processing was done in the MATLAB programming language.
The Raman spectrometer provides a built-in frequency reference as attenuated 830 nm laser light is observed
in the Raman spectra. Calibration of the Raman shift was also checked using polystyrene with a well-known
Raman spectrum43.
A preliminary experiment was performed for phytonutrients (carotenoids) and macronutrient (nitrogen)
standards, as well as Arabidopsis thaliana plants and 5 different leafy vegetable plants as shown in Fig. 2. Based
on our Raman spectrum of carotenoid chemical standards, we identified the 1520 cm−1, 1150 cm−1 and 1004 cm−1
peaks to be present in all tested carotenoids (Fig. 2). The observed Raman peak at 1520 cm−1 is due to a C=C
stretching vibration (ν1), the 1150 cm−1 peak is a C–C stretching vibration (ν2), and the weak peak at 1004 cm−1
is due to C-CH3 stretching (ν3)44. Furthermore, the measured Raman spectrum of potassium nitrate (KNO3) and
ammonium nitrate (NH4NO3) showed a peak at 1046 cm−1 indicating that this Raman shift (associated with the
symmetrical stretching of nitrate) is indeed the nitrate peak39 (Fig. 2).
Scientific Reports | (2020) 10:20206 | https://doi.org/10.1038/s41598-020-76485-5 2
Vol:.(1234567890)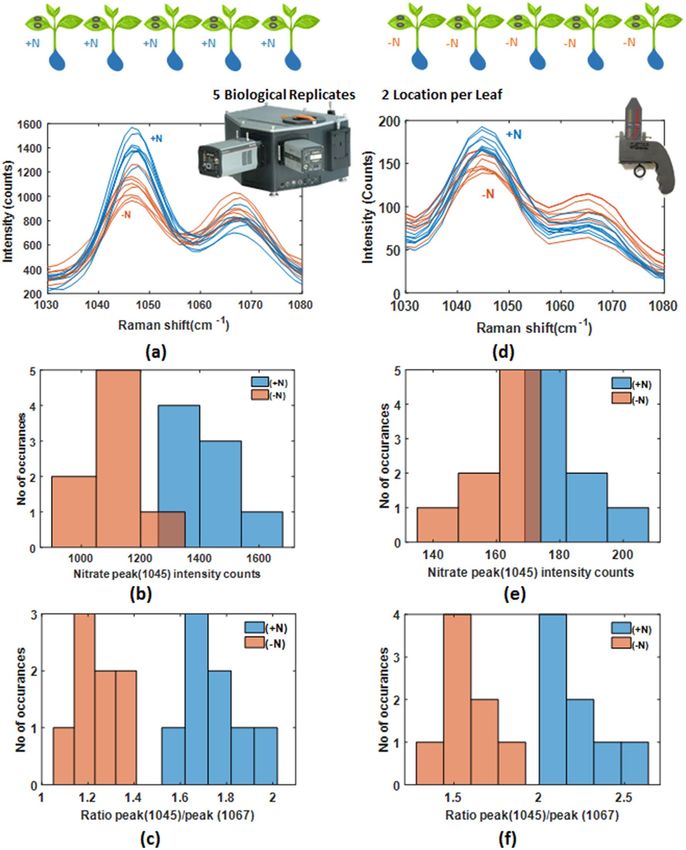
www.nature.com/scientificreports/

                                  Figure 1.  Portable leaf-clip Raman sensor and its use on plants. (a) Raman spectra of Arabidopsis under
                                  different laser power 75 mW (minimum), 130 mW (used in experiments), 240 mW and 405 mW (maximum).
                                  (b) Schematic of the portable Raman spectrometer, (c) Raman Leaf-Clip sensor clipped with plant, (d) the leaf-
                                  clip Raman sensor used for analysis of early nitrogen deficiency in leafy vegetables.

                                      For the Raman analysis, 3-week old, Arabidopsis thaliana, Lettuce (Lactuca sativa), Pak Choi (Brassica rapa
                                  chinensis), and Choy Sum (Brassica rapa var. parachinensis) plant, were grown in hydroponic media and Kailan
                                  (Brassica oleracea var. alboglabra) and Spinach (Spinacia oleracea) grown in soil were chosen, which have differ-
                                  ent leaf shapes, sizes, and textures. The Arabidopsis thaliana leaf was small (1.5–4 cm), smooth and covered with
                                  unicellular hairs, whereas Pak Choi, Choy Sum and Lettuce leaf were bigger, and surfaces were semi savoyed to
                                  heavily savoyed (crinkled). Similarly, the Spinach leaf was triangular or ovate in shape with a very smooth surface
                                  and Kailan leaf was thick, oblong, and glossy (coated with wax). The Raman Leaf-Clip Sensor was able to acquire
                                  Raman spectra from all the different types of plant leaves with reproducible results. The Raman spectra of plants
                                  leaves shows several common Raman peaks. The vibrational bands and their assignments for Arabidopsis thaliana
                                  and leafy vegetable plants are listed in Table 1.

Scientific Reports |   (2020) 10:20206 |               https://doi.org/10.1038/s41598-020-76485-5                                                  3

                                                                                                                                              Vol.:(0123456789)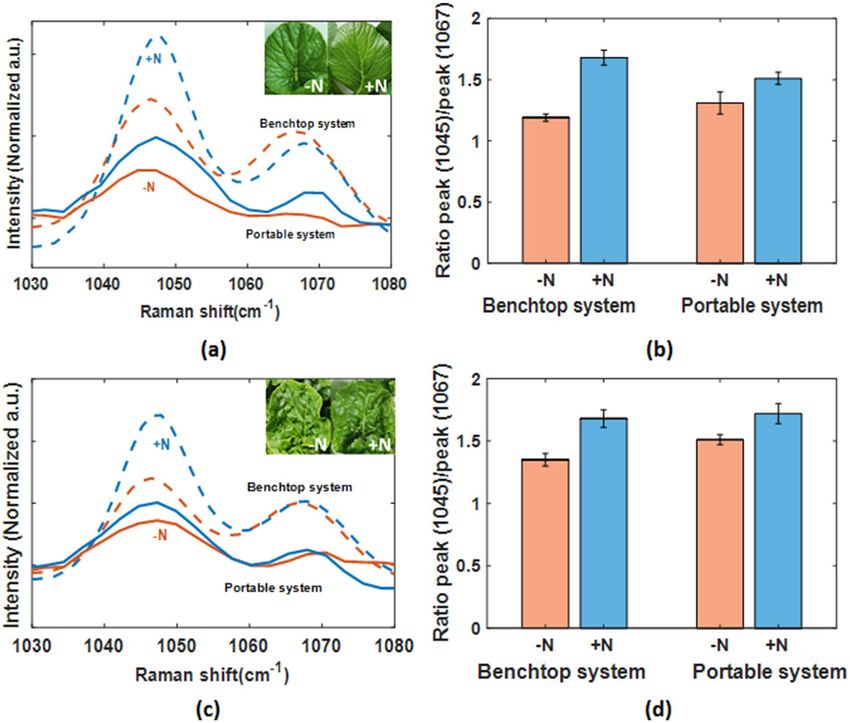
www.nature.com/scientificreports/
Figure 2. Raman spectroscopic analysis of leafy vegetables (Kailan, Lettuce, Choy Sum, Pak Choi, Spinach),
Arabidopsis and Phytonutrients (Lycopene, Neoxanthin and Beta Carotene) and macronutrient (Nitrate peak by
100 mM NH4NO3 and KNO3) of plants by standard pure chemicals.
Scientific Reports | (2020) 10:20206 | https://doi.org/10.1038/s41598-020-76485-5 4
Vol:.(1234567890)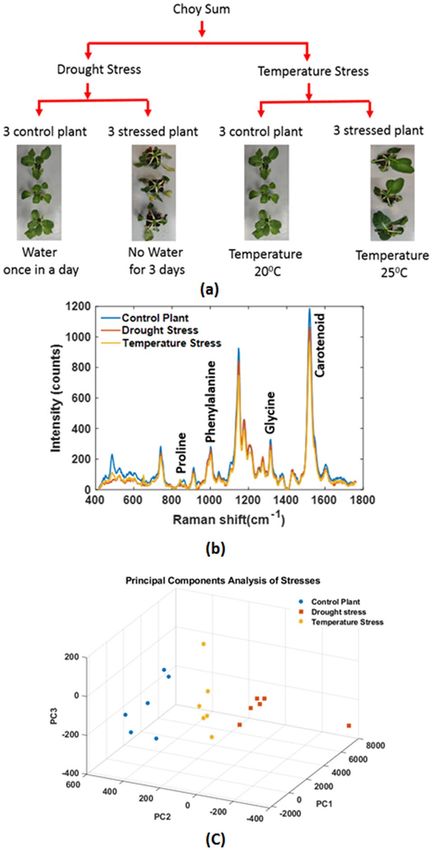
www.nature.com/scientificreports/
Band (Raman peak cm−1) Vibrational mode Assignment
1604 ν(C–C) aromatic ring + σ(CH) Lignin20,27
1520 –C=C– (in-plane) Carotenoid20,27,43
1320 δCH2 bending Cellulose, Lignin20,27
1150 C–C stretching; v(C–O–C), Carotenoid27,43
1046 NO3 stretching Nitrate38
1004 ν3 (C–CH3 stretching) Carotenoids20,43
1003 ν3 (C–CH3 stretching) phenylalanine ring stretching mode Phenylalanine20,43
747 γ(C–O–H) of COOH Pectin20,27
Table 1. Vibrational bands and their assignments for Arabidopsis thaliana, and leafy vegetable plants.
Plant materials and plant growth. Arabidopsis thaliana WT (Col-0), Pak Choi (Brassica rapa chinen-
sis) and Choy Sum (Brassica rapa var. parachinensis) were grown in Temasek Life Science Laboratory. Seeds
were germinated on 0.8% agar media containing Murashige and Skoog (MS) salts, 0.5 g L−1 MES and 10 g L−1
sucrose. Arabidopsis and vegetables were grown at 22 °C with 60% relative humidity in long-day conditions
(16 h light/8 h dark) under white light at 100 μmol m−2 s−1 in a growth chamber. Plants were grown in either + N
or −N medium by modified Hoagland’s solution containing 2 mM C aCl2 and 3 mM KCl (pH 5.8) instead of
2 mM Ca(NO3)2 and 3 mM KNO3 (pH 5.8).
In order to demonstrate the broad applicability of the Raman leaf-clip, additional experiments on soil based
plants grown under drought and heat stress conditions were performed. Choy Sum (Brassica rapa var. parachin-
ensis) were grown in the DiSTAP Laboratory. Seeds were germinated on 0.8% agar media at 25 °C in a growth
chamber. After germination Choy Sum vegetables plant were grown in soil at 20 °C with 60% relative humidity
in long-day conditions (16 h light/8 h dark) under white light at 100 μmol m−2 s−1 in a plant room. Three week
old Choy Sum plants grown in the control condition were kept in drought and high-temperature stress for 3 days.
These plants were used to acquire Raman spectra.
Monitoring stress response. The Raman Leaf-Clip Sensor was used for early detection of nitrogen sta-
tus in plants. Nitrogen (N) plays a key role in plant growth and the entire life cycle of a plant. It is the main
plant macronutrient needed for chlorophyll production and other plant cell components e.g. amino acid, nucleic
acids, and protein b iosynthesis45. Nitrogen limitation promotes premature leaf senescence and a reduction in
chlorophyll lowering yield and biomass. If the available nitrogen exceeds the plant’s nutritional needs then the
excess is eliminated by runoff and infiltration into the water table leading to pollution of aquatic ecosystems.
Thus, the optimization of nitrogen deficiency has become the object of intense importance for plant health as
well as its environmental and economic impact46,47.
We choose the model plant Arabidopsis thaliana where metabolic pathways are well studied and two leafy
vegetable plants belonging to the Brassicacea family: Pak Choi (Brassica rapa chinensis) and Choy Sum (Brassica
rapa var. parachinensis) for the experiment. Three-week-old plants were grown under sufficient (+ N; complete)
or nitrogen-deficient (−N) hydroponic media. After 5 days, leaf yellowing which reflects senescence induced by
nitrogen starvation was not yet visible in plants grown under nitrogen-deficient conditions. However, despite
the similarity in visible plant phenotype and chlorophyll content, chemical analysis showed the nitrate content
of −N plants was decreased, compared to + N plants. These plants were used to acquire Raman spectra from
portable system as well as benchtop system.
Statement of consent. The informed consent was obtained from the participant researcher for publica-
tion of photograph in the article (Fig. 1d).
Results and discussion
We first sought to test the fidelity of the Raman spectral measurements on the heterogeneous surface of the leaf.
Raman measurements with the leaf-clip probe are not guided by machine or human vision. Raman spectra were
acquired from Arabidopsis thaliana grown under sufficient (+N) and deficient (−N) condition of Nitrogen (N) as
described above. For each growth condition, 5 biological replicates were tested (a total of 10 plants). Two loca-
tions (left and right of centre) on a single leaf were measured on each plant. At each location, five Raman spectra
were acquired. In the Supplementary Information, we demonstrate that a nitrate Raman measurement from two
locations gives a comparable estimate of the nitrate peak ratio as a whole leaf map using 30 locations. In vivo and
in situ measurements with the leaf-clip Raman sensor and portable instrument were compared to experiments
performed against the benchtop system on 3 mm diameter leaf sections placed on a fused silica cover s lip39.
The region of Raman spectra between 1030 and 1080 cm−1 as shown in Fig. 3a,d indicates that the 1045 cm−1
peak with sufficient (+ N) and deficient (− N) condition are clearly distinguishable. Histograms of the 1045 cm−1
nitrate Raman peak intensity for 8 spectra from + N and − N Arabidopsis plants was plotted for both benchtop
leaf sections and portable, in vivo leaf-clip Raman instruments shown in Fig. 3b, e, respectively. The variability
in the intensity of the Raman peak is likely due to the excitation overlapping leaf veins or microscopic variations
in the surface orientation and reflection.
Scientific Reports | (2020) 10:20206 | https://doi.org/10.1038/s41598-020-76485-5 5
Vol.:(0123456789)www.nature.com/scientificreports/
Figure 3. Reproducibility of Raman spectra under Nitrogen sufficient (+ N) or deficient (− N) condition
in Arabidopsis. (a) Raman spectra of 8 samples each from + N and − N Arabidopsis plants were measured
by Benchtop Raman spectrometer (Region of Raman spectra between 1030 and 1080 cm−1 is shown) (b)
Histogram of 1045 cm−1 Nitrate Raman peak of 8 samples each from + N and − N Arabidopsis plants by
Benchtop Raman spectrometer, (c) Histogram of ratio of 1045 cm−1 Nitrate Raman peak to 1067 cm−1 adjacent
peak (1045 cm−1/1067 cm−1) of 8 samples each from + N and − N Arabidopsis plants by Benchtop Raman
spectrometer, (d) Raman spectra of 8 samples each from + N and − N Arabidopsis plants were measured by
Portable Raman spectrometer (Region of Raman spectra between 1030 and 1080 cm−1 is shown) (e) Histogram
of 1045 cm−1 Nitrate Raman peak of 8 samples each from + N and − N Arabidopsis plants by Portable
Raman spectrometer, (f) Histogram of ratio of 1045 cm−1 Nitrate Raman peak to 1067 cm−1 adjacent peak
(1045 cm−1/1067 cm−1) of 8 samples each from + N and − N Arabidopsis plants by Portable Raman spectrometer.
Scientific Reports | (2020) 10:20206 | https://doi.org/10.1038/s41598-020-76485-5 6
Vol:.(1234567890)www.nature.com/scientificreports/
Figure 4. Comparison of Raman spectra under Nitrogen sufficient (+ N) or deficient (− N) condition in
leafy vegetables (Choy Sum and Pak Choi), acquired by Benchtop Raman spectrometer and Portable Raman
spectrometer. (a) Raman spectra of + N and − N Choy Sum plants by Benchtop Raman spectrometer and
Portable Raman spectrometer (Data are mean values, of 3 biologically independent experiments shown in
region of Raman spectra between 1030 and 1080 cm−1), (b) comparison of ratio of 1045 cm−1 Nitrate Raman
peak to 1067 cm−1 adjacent peak (1045 cm−1/1067 cm−1) in + N and − N Choy Sum plants by Benchtop Raman
spectrometer and Portable Raman spectrometer, (c) Raman spectra of + N and − N Pak Choi plants by Benchtop
Raman spectrometer and Portable Raman spectrometer (Data are mean values, of 3 biologically independent
experiments shown in region of Raman spectra between 1030 and 1080 cm−1), (d) comparison of ratio of
1045 cm−1 Nitrate Raman peak to 1067 cm−1 adjacent peak (1045 cm−1/1067 cm−1) in + N and − N Pak Choi
plants by Benchtop Raman spectrometer and Portable Raman spectrometer.
We can improve the classification of Raman spectra from sufficient (+ N) and deficient (− N) conditions by
using the 1067 cm−1 peak as an internal reference. Histograms of the ratio of 1045 cm−1 to the 1067 cm−1 adjacent
peak (1045 cm−1/1067 cm−1) of Arabidopsis plants are presented in Fig. 3c, for the benchtop Raman system on
leaf sections, and in Fig. 3f for the leaf-clip Raman sensor on in vivo plants. This internal referencing results in a
smaller variation across biological replicates and leaf locations and gives a clear separation in the Raman intensity
ratio for sufficient and deficient nutrient conditions (Supplementary Table 1).
To calculate the signal to noise ratio (SNR) of both the benchtop and portable system, 30 spectra were col-
lected with an integration time of 10 s at same location from two biological replicates. The calculated value of
SNR of the nitrate peak (1045 cm−1) of Choy Sum plants is SNR = 5.15 and 5.31 for benchtop Raman system
and SNR = 2.51 and 3.31 for the portable system. Using the adjacent peak as an internal reference improved the
relative performance of the portable leaf-clip system, the SNR of the ratio of the nitrate peak 1045 cm−1 to the
1067 cm−1 adjacent peak (1045 cm−1/1067 cm−1) of Choy Sum plants is SNR = 6.28 and 6.38 for the benchtop
Raman system and SNR = 5.05 and 5.06 for the portable system. Despite the smaller light collection of the Raman
leaf clip and the utilization of miniature components in the portable instrument, the SNR for the peak ratios
are comparable between the in vivo measurements using the portable leaf-clip sensor and leaf samples in the
benchtop systems.
These results can be extended to vegetable crops. Raman spectra were acquired from 3 biological replicates
with 2 location at each leaf of same age for Pak Choi and Choy Sum (Fig. 4). For each leaf location, 5 spectra
were collected with an integration time of 10 s per spot. Every plant spectrum is a mean of 10 spectra. The
Scientific Reports | (2020) 10:20206 | https://doi.org/10.1038/s41598-020-76485-5 7
Vol.:(0123456789)www.nature.com/scientificreports/
Figure 5. The leaf-clip Raman sensor used for analysis of early diagnosis of drought and high temperature
stress in Choy Sum plant. (a) Schematic of the experimental plan, (b) Raman spectra of control plant and
stressed plant (c) Principal component analysis method to distinguish the control and different stress plant.
spectra obtained from + N plants and − N plants showed consistent decreases of nitrate peak intensity from + N
plants to − N plants. Here, we have shown that Raman spectroscopy can be used to establish the state of plant
health in a non-invasive manner by using the 1045 cm−1 Raman peak as a specific signature of nitrogen status
in Arabidopsis and vegetable crops.
To illustrate the applicability of the Raman Leaf-Clip Sensor to the diagnosis of other stress conditions, experi-
ments were performed on plants under drought and temperature stress conditions. Figure 5a shows the schematic
of the experimental plan. Figure 5b shows the Raman spectra of control plant and stressed plant which indicated
the variation of secondary metabolites of plants under stressed condition as early as 3 days. Principal component
analysis clearly distinguishes the control and plants experiencing the two stress conditions as shown in Fig. 5c.
Conclusion
Rapid quantification of the stress phenotype associated with nutrient deficiency has been demonstrated using
a portable leaf-clip Raman sensor. We have established the reproducibility of the leaf-clip based measurements
and demonstrated the diagnosis of nitrogen deficiency for the model plant Arabidopsis thaliana as well as two
important vegetable crops Pak Choi (Brassica rapa chinensis) and Choy Sum (Brassica rapa var. parachinensis).
Scientific Reports | (2020) 10:20206 | https://doi.org/10.1038/s41598-020-76485-5 8
Vol:.(1234567890)www.nature.com/scientificreports/
Spectra collected in vivo and in situ (under full light growing conditions) using the leaf-clip sensor are shown to
be comparable to those from leaf sections measured using a benchtop Raman spectrometer.
While we have focused on the early and specific diagnosis of nitrogen deficiency using the leaf-clip sensor,
there are peaks from other metabolites that are also clearly observed in Kailan, Lettuce, Choy Sum, Pak Choi,
and Spinach. We expect that the carotenoid and anthocyanin Raman spectra can be used to measure a wider
range of plant stress phenotypes—from drought, to heat and cold stress, to saline stress, and light s tress18. Indeed,
preliminary data for drought and heat stress have been presented. The simplicity and speed of these leaf-clip
Raman probes makes them suitable for field use by farmers as well as laboratory use by researchers for rapid
screening of cultivars for enhanced stress-tolerance.
Received: 12 June 2020; Accepted: 26 October 2020
References
1. Ray, D. K., Mueller, N. D., West, P. C. & Foley, J. A. Yield trends are insufficient to double global crop production by 2050. PLoS
ONE 8, e66428 (2013).
2. Mueller, N. D. et al. Closing yield gaps through nutrient and water management. Nature 490, 254–257 (2012).
3. Noya, I., González-García, S., Bacenetti, J., Fiala, M. & Moreira, M. T. Environmental impacts of the cultivation-phase associated
with agricultural crops for feed production. J. Clean. Prod. 172, 3721–3733 (2018).
4. Raza, A. et al. Impact of climate change on crops adaptation and strategies to tackle its outcome: A review. Plants 8, 1–29 (2019).
5. Rosenzweig, C. et al. Assessing agricultural risks of climate change in the 21st century in a global gridded crop model intercom-
parison. Proc. Natl. Acad. Sci. U. S. A. 111, 3268–3273 (2014).
6. Wheeler, T. & Von Braun, J. Climate change impacts on global food security. Science 341, 508–513 (2013).
7. Furbank, R. T. & Tester, M. Phenomics—technologies to relieve the phenotyping bottleneck. Trends Plant Sci. 16, 635–644 (2011).
8. Bai, G., Ge, Y., Hussain, W., Baenziger, P. S. & Graef, G. A multi-sensor system for high throughput field phenotyping in soybean
and wheat breeding. Comput. Electron. Agric. 128, 181–192 (2016).
9. Ge, Y., Bai, G., Stoerger, V. & Schnable, J. C. Temporal dynamics of maize plant growth, water use, and leaf water content using
automated high throughput RGB and hyperspectral imaging. Comput. Electron. Agric. 127, 625–632 (2016).
10. Neilson, E. H. et al. Utilization of a high-throughput shoot imaging system to examine the dynamic phenotypic responses of a C4
cereal crop plant to nitrogen and water deficiency over time. J. Exp. Bot. 66, 1817–1832 (2015).
11. Blackburn, G. A. Hyperspectral remote sensing of plant pigments. J. Exp. Bot. 58, 855–867 (2007).
12. Curran, P. J., Dungan, J. L. & Peterson, D. L. Estimating the foliar biochemical concentration of leaves with reflectance spectrometry:
Testing the Kokaly and Clark methodologies. Remote Sens. Environ. 76, 349–359 (2001).
13. Campbell, M. T. et al. Integrating image-based phenomics and association analysis to dissect the genetic architecture of temporal
salinity responses in rice. Plant Physiol. 168, 1476–1489 (2015).
14. Fahlgren, N. et al. A versatile phenotyping system and analytics platform reveals diverse temporal responses to water availability
in Seteria. Mol. Plant. 8, 1520–1535 (2015).
15. Chappelle, E. W., Kim, M. S. & McMurtrey, J. E. Ratio analysis of reflectance spectra (RARS): an algorithm for the remote estima-
tion of the concentrations of Chlorophyll A, Chlorophyll B, and Carotenoids in Soybean leaves. Remote Sens. Environ. 39, 239–247
(1992).
16. Peñuelas, J., Gamon, J. A., Fredeen, A. L., Merino, J. & Field, C. B. Reflectance indices associated with physiological changes in
nitrogen- and water-limited sunflower leaves. Remote Sens. Environ. 48, 135–146 (1994).
17. Blackmer, T. M., Schepers, J. S., Varvel, G. E. & Walter-Shea, E. A. Nitrogen deficiency detection using reflected shortwave radia-
tion from irrigated corn canopies. Agron. J. 88, 1 (1996).
18. Altangerel, N. et al. In vivo diagnostics of early abiotic plant stress response via Raman spectroscopy. Proc. Natl. Acad. Sci. U.S.A.
114, 3393–3396 (2017).
19. Carter, G. A. & Miller, R. L. Early detection of plant stress by digital imaging within narrow stress-sensitive wavebands. Remote
Sens. Environ. 50, 295–302 (1994).
20. Sanchez, L., Pant, S., Xing, Z., Mandadi, K. & Kurouski, D. Rapid and noninvasive diagnostics of Huanglongbing and nutrient
deficits on citrus trees with a handheld Raman spectrometer. Anal. Bioanal. Chem. 411, 3125–3133 (2019).
21. Farber, C. & Kurouski, D. Detection and identification of plant pathogens on maize kernels with a hand-held Raman spectrometer.
Anal. Chem. 90, 3009–3012 (2018).
22. Beganovic, A., Hawthorne, L. M., Bach, K. & Huck, C. W. Critical review on the utilization of handheld and portable Raman
spectrometry in meat science. Foods 8, 49 (2019).
23. Trebolazabala, J., Maguregui, M., Morillas, H., de Diego, A. & Madariaga, J. M. Portable Raman spectroscopy for an in-situ moni-
toring the ripening of tomato (Solanum lycopersicum) fruits. Spectrochim. Acta Part A Mol. Biomol. Spect. 180, 138–143 (2017).
24. Egging, V., Nguyen, J. & Kurouski, D. Detection and identification of fungal infections in intact Wheat and Sorghum grain using
a hand-held Raman spectrometer. Anal. Chem. 90, 1863–1891 (2018).
25. Yang, D. & Ying, Y. Applications of Raman spectroscopy in agricultural products and food analysis: A review. Appl. Spectrosc. Rev.
46, 539–560 (2011).
26. Sanchez, L., Ermolenkov, A., Tang, X. T., Tamborindeguy, C. & Kurouski, D. Non invasive diagnostics of Liberibacter disease on
tomatoes using a hand held Raman spectrometer. Planta 251, 64–70 (2020).
27. Farber, C., Shires, M., Ong, K., Byrne, D. & Kurous, D. Raman spectroscopy as an early detection tool for rose rosette infection.
Planta 250, 1247–1255 (2019).
28. Yeturu, S. et al. Handheld Raman spectroscopy for the early detection of plant diseases: Abutilon mosaic virus infecting Abutilon
sp. Anal. Methods 8, 3450–3457 (2016).
29. Butler, H. J., McAinsh, M. R., Adams, S. & Martin, F. L. Application of vibrational spectroscopy techniques to non-destructively
monitor plant health and development. Anal. Methods 7, 4059–4070 (2015).
30. Sanchez, L., Filter, C., Baltensperger, D. & Kurouski, D. Confirmatory non-invasive and non-destructive differentiation between
hemp and cannabis using a hand-held Raman spectrometer. RSC Adv. 10, 3212 (2020).
31. Raman, C. V. & Krishnan, K. S. New type of secondary radiation. Nature 121, 501–502 (1928).
32. Rostron, P., Gaber, S. & Gaber, D. Raman spectroscopy, review. Int. J. Eng. Technol. Res. 6, 2454 (2016).
33. Inada, K. Studies on a method for determining deepness of green color and chlorophyll content of intact crop leaves and its practical
applications. 1. Principle for estimating the deepness of green color and chlorophyll content of whole leaves. Proc. Crop. Sci. Soc.
Jpn. 32, 157–162 (1963).
34. Cerovica, Z. G., Masdoumierd, G., Ghozlena, N. B. & Latouchea, G. A new optical leaf-clip meter for simultaneous non-destructive
assessment of leaf chlorophyll and epidermal flavonoids. Physiol. Plant. 146, 251–260 (2012).
Scientific Reports | (2020) 10:20206 | https://doi.org/10.1038/s41598-020-76485-5 9
Vol.:(0123456789)www.nature.com/scientificreports/
35. Gabriel, J. L., Quemada, M., Alonso-Ayuso, M., Lizaso, J. I. & Lammerding, D. M. Predicting N status in maize with clip sensors:
Choosing sensor, leaf sampling point, and timing. Sensors 19, 3881 (2019).
36. Marenco, R. A., Antezana-Vera, S. A. & Nascimento, H. C. S. Relationship between specific leaf area, leaf thickness, leaf water
content and SPAD-502 readings in six amazonian tree species. Photosynthetica 47, 184–190 (2009).
37. Yamada, N. & Fujimura, S. Nondestructive measurement of chlorophyll pigment content in plant leaves from three-color reflectance
and transmittance. Appl. Opt. 30, 3964–3973 (1991).
38. Dochow, S. et al. Combined fiber probe for fluorescence lifetime and Raman spectroscopy. Anal. Bioanal. Chem. 407, 8291–8301
(2015).
39. Huang, C. H. et al. Early diagnosis and management of nitrogen deficiency in plants utilizing Raman spectroscopy. Front. Plant
Sci. 11, 663 (2020).
40. Cataldo, D. A. et al. Rapid colorimetric determination of nitrate in plant tissue by nitration of salicylic acid. Commun. Soil Sci.
Plant Anal. 6, 71–80 (1975).
41. Barton, S. J., Ward, T. E. & Hennelly, B. M. Algorithm for optical denoising of Raman spectra. Anal. Methods 10, 3759–3769 (2018).
42. Lieber, C. A. & Mahadevan-Jansen, A. Automated method for subtraction of fluorescence from biological Raman spectra. Appl.
Spectrosc. 57, 1363–1367 (2003).
43. Creely, C. M. et al. Dual wavelength optical tweezers for confocal Raman spectroscopy. Opt. Commun. 245, 465–470 (2005).
44. Gelder, J. D., Gussem, K. D., Vandenabeele, P. & Moens, L. Reference database of Raman spectra of biological molecules. J. Raman
Spect. 38, 1133–1147 (2007).
45. Muñoz-Huerta, R. F. et al. A review of methods for sensing the nitrogen status in plants: Advantages, disadvantages and recent
advances. Sensors 13, 10823–10843 (2013).
46. Masclaux-Daubresse, C. et al. Nitrogen uptake, assimilation and remobilization in plants: Challenges for sustainable and produc-
tive agriculture. Ann. Bot. 105, 1141–1157 (2010).
47. Kant, S. et al. Understanding plant response to nitrogen limitation for the improvement of crop nitrogen use efficiency. J. Exp. Bot.
62, 1499–1509 (2011).
Acknowledgements
This research was supported by the National Research Foundation (NRF), Prime Minister’s Office, Singapore
under its Campus for Research Excellence and Technological Enterprise (CREATE) program. The Disruptive
& Sustainable Technology for Agricultural Precision (DiSTAP) is an interdisciplinary research group (IRG) of
the Singapore MIT Alliance for Research and Technology (SMART) Centre supported by the National Research
Foundation (NRF), Prime Minister’s Office, Singapore under its Campus for Research Excellence and Techno-
logical Enterprise (CREATE) program.
Author contributions
S.G., C.H.H., G.P.S., B.S.P., N.H.C and R.J.R. designed the experiments. S.G., C.H.H., and G.P.S. executed the
experiments. All of the authors interpreted and discussed the data. S.G., G.P.S., B.S.P., N.H.C and R.J.R. wrote
the manuscript. S.G. and C.H.H. contributed equally to this work. Corresponding authors are N.H.C. and R.J.R.
Competing interests
The authors declare no competing interests.
Additional information
Supplementary information is available for this paper at https://doi.org/10.1038/s41598-020-76485-5.
Correspondence and requests for materials should be addressed to N.-H.C. or R.J.R.
Reprints and permissions information is available at www.nature.com/reprints.
Publisher’s note Springer Nature remains neutral with regard to jurisdictional claims in published maps and
institutional affiliations.
Open Access This article is licensed under a Creative Commons Attribution 4.0 International
License, which permits use, sharing, adaptation, distribution and reproduction in any medium or
format, as long as you give appropriate credit to the original author(s) and the source, provide a link to the
Creative Commons licence, and indicate if changes were made. The images or other third party material in this
article are included in the article’s Creative Commons licence, unless indicated otherwise in a credit line to the
material. If material is not included in the article’s Creative Commons licence and your intended use is not
permitted by statutory regulation or exceeds the permitted use, you will need to obtain permission directly from
the copyright holder. To view a copy of this licence, visit http://creativecommons.org/licenses/by/4.0/.
© The Author(s) 2020
Scientific Reports | (2020) 10:20206 | https://doi.org/10.1038/s41598-020-76485-5 10
Vol:.(1234567890)You can also read