Impact of Industrial Tuna Fisheries on Fish Stocks and the Ecosystem of the Pacific Ocean - John Sibert Pelagic Fisheries Research Program ...
←
→
Page content transcription
If your browser does not render page correctly, please read the page content below
Impact of Industrial Tuna Fisheries on Fish Stocks
and the Ecosystem of the Pacific Ocean
www.soest.hawaii.edu/PFRP/large_pelagics/large_pelagic_predators

 John Sibert
 Pelagic Fisheries Research Program
 University Hawaii
Thanks to the folks who actually do the work:
John Hampton        Oceanic Fisheries Programme, SPC, Noumea
Adam Langley
Pierre Kleiber      NOAA Pacific Island Fisheries Science Center, Honolulu
Mark Maunder        Inter-American Tropical Tuna Commission, La Jolla
Shelton Harley
Yukio Takeuchi      National Research Institute of Far Seas Fisheries, Shimizu
Momoko Ichinokawa
Tom Polacheck       CSIRO, Hobart
Alain Fonteneau     IRD, Sete
Outline
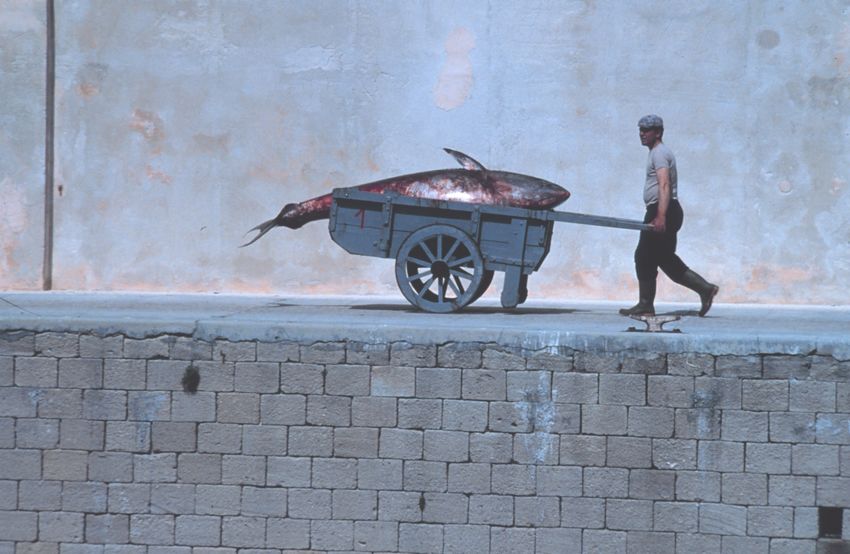
• History of industrial tuna fishing
• How do you estimate biomass?
• Data available
• Model components
• Results – analysis & synthesis
– Biomass trends
– Changes in size structure
– Changes in trophic structure
– Regime shifts?
• Fishery management options
• (Compare with CPUE analysis)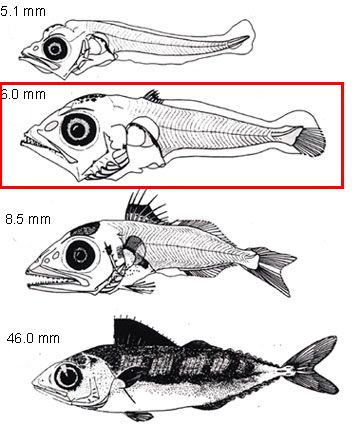
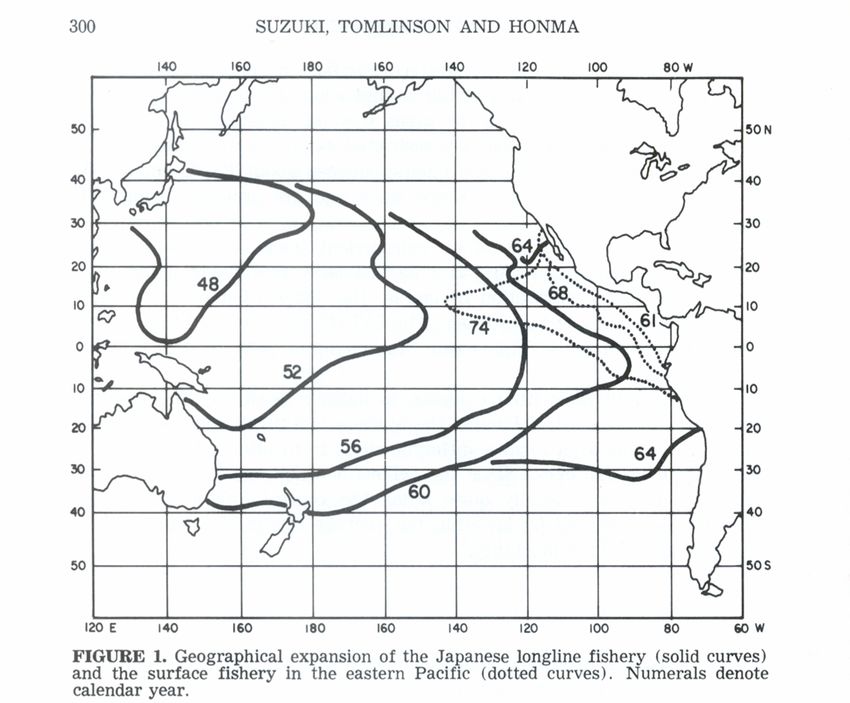
Expansion of Fishing Grounds
Increase in Catch

               By Species

               By Gear

               By Area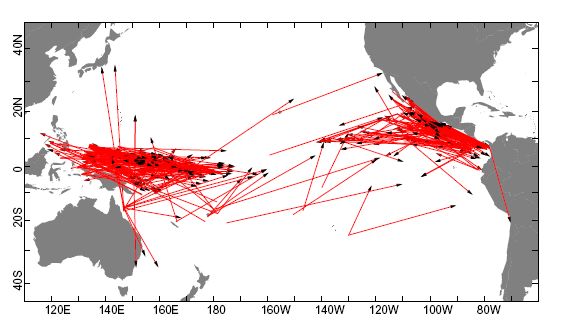
Estimating Biomass: Stock Assessment Models
 • Infer status of stock from analysis of fisheries data

 • Process
    – Demographic model of fish population
    – Model of fishing process

 • Stochastic components
    – Process error
    – Observation error

 • Likelihood

 • No explicit environmental forcing
Fisheries Data
• Spatially resolved time series starting in 1952
• Catch and effort by fishing gear and national flag
• Size: catch by length or weight
• Tag release and recapture
• Non-existent experimental design
– Inconsistent spatial resolution
– Changes in biomass confounded with changes in fishery
– Not all time-area strata sampledSimple Example – The Schaefer Model
dB B
= rB 1 − K − f B Demographic Model
dt
f = qE Fishing Mortality
Cb = fB Predicted Catch
`(C, E|r, K, q) = ∑(C − C)
b2 Likelihood
• Stock assessment models reconstruct biomass trajectories
• q can be set to 0 to explore potential biomass trajectories in absence of fishing
• Extremely simple example useful only heuristically and in restricted situations (e.g. EPO surface
fishery in the 1950s). Don’t try this at home!
dB
• Assumption of equillibrium dt = 0 leads directly to MSY concept
C C
• C = qEB implies E = qB i.e. E (or CPUE) is an index of abundance if q is constant.More Complex example – MULTIFAN-CL
http://www.multifan-cl.org
R log(ϕt )αr γtr a = 1; 1 ≤ t ≤ T
N0
1 < a < A; t = 1
0 = a,1,r
Natr Demographic Model
e−Za−1,t−1,r Na−1,t−1,r 1 < a < A; 1 < t ≤ T
−Za−1,t−1,r
e Na−1,t−1,r + e−Za,t−1,r Na,t−1,r a = A; 1 < t ≤ T
Zatr = ∑ f ∈ fr Fat f + Ma Total Mortality
Fat f = sa f qt f Et f eεt f Fishing Mortalty
Fat f −Z
Cbat f = Zatr 1 − e atr Natr Predicted Catch
h i2
ΘC = pC ∑t ∑ f log(1 + ∑Aa Cat f ) − log(1 + ∑Aa Cbat f ) LikelihoodSpatial Structure
120˚ 150˚ 180˚ 210˚ 240˚ 270˚
40˚ 40˚
1 2 7
20˚ 20˚
0˚
3 4 0˚
−20˚
8 −20˚
5 6
−40˚ −40˚
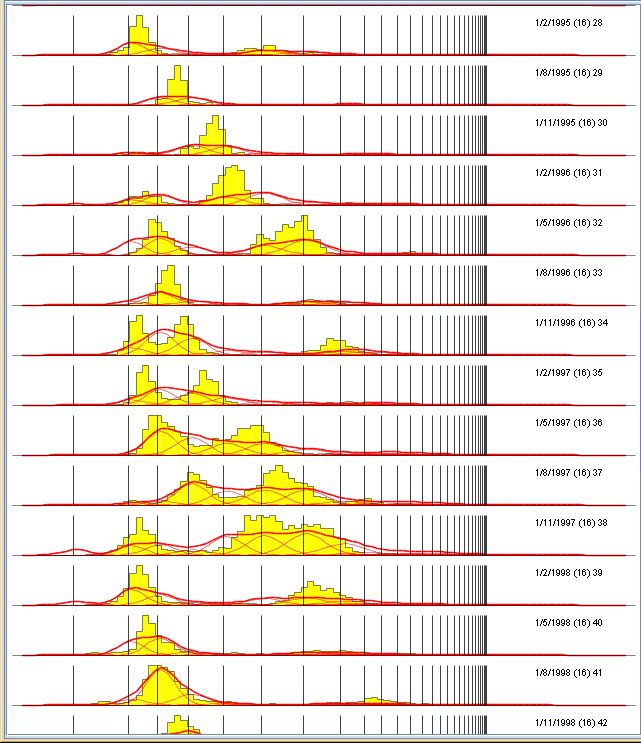
120˚ 150˚ 180˚ 210˚ 240˚ 270˚Size-frequency Information
Region 4 Purse Seine, Associated Region 1 Longline
n=2524Tagging Information
Movement MortalityMore Diagnostics
Growth “Effort Deviations” εt fAvailability of stock assessments
Current Assessments Needed Assessments
“Stock” Status “Stock” Status
WCPO Yellowfin∗ 3 Ono 0
EPO Yellowfin∗ 3 Mahi mahi 0
Southern Albacore∗ 3 Oceanic Whitetip Shark 0
Northern Albacore∗ 2
Pacific Bigeye∗ 3
WCPO Bigeye 3
WCPO Skipjack∗ 2
Pacific Swordfish 1
Pacific Blue Marlin 1
Pacific Blue Shark 1
3: current & defintive; 2: current, but needs work; 1: in progress or needs updating; 0: probably insufficient data
∗ Used in this presentationBiomass Trends
Impact of Fishery on Total Biomass
Changes in Size Spectra
Impact of Fishery on Size
Impact of Fishery on Spawning Biomass
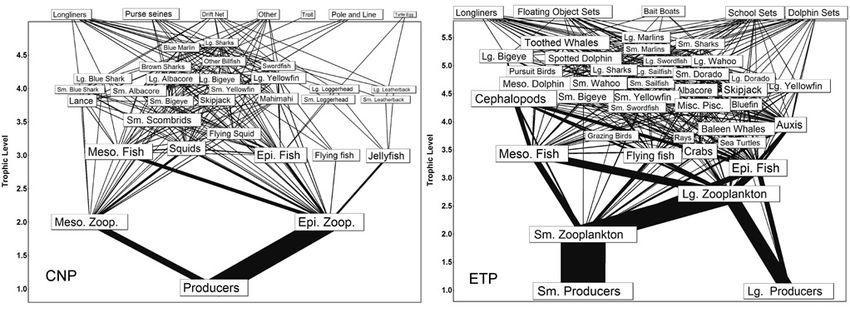
Ecopath Trophic Level Calculations
                                                         Central Pacific                           Eastern Tropical Pacific
                                                              Cox et al., 2002                               Olson & Watters, 2003
                            Species          Small     Weight (kg)      Length (cm)      Large     Small     Length (cm)               Large
                            Bigeye            3.82             39.0              123      4.06      4.53               80               5.17
                            Yellowfin         3.91             14.8               94      4.12      4.57               90               4.66
                            Albacore          3.96             13.3               87      4.10                                          4.60
                            Blue Shark        3.99                                        4.05
                            Blue Marlin                        44.0                       4.61
                            Swordfish                          10.0                       4.32      4.42              150               4.96
                            Skipjack          3.85             13.4               91                                                    4.57
                            “Marlins”                                                               5.22              150               5.32
                            “Sharks”                                                                5.23              150               4.93
                            Bluefin                                                                                                     4.37
                            Sailfish                                                                4.63              150               4.89
                            Average           3.91                                        4.21      4.77                                4.83

Cox, S., S. Martell, C. Walters, T. Essington, J. Kitchell, C. Boggs, and I. Kaplan. 2002. Reconstructing ecosystem dynammics in the central Pacific Ocean, 1952-1998. I.
Estimating population biomass and recritment of tunas and billfishes. Can. J. Fish, Aquat. Sci. 59:1724-1735.

Cox, S., T. Essington, J. Kitchell, S. Martell, C. Walters, C. Boggs, and I. Kaplan. 2002. Reconstructing ecosystem dynammics in the central Pacific Ocean, 1952-1998. II.
A preliminary assessment of the trophic impacts of fishing and effects on tuna dynamics. Can. J. Fish, Aquat. Sci. 59:1736-1747.

Olson, R. and G. Watters. 2003. A model of the pelagic ecosystem in the estaern tropical Pacific Ocean. IATTC Bulletin 22:135-218.
Eastern and Western Food Webs Hinke, J, I. Kaplan, K. Aydin, G. Watters, R. Olson and J. Kitchell. 2004. Visualizing the food-web effects of fishing for tunas in the Pacific Ocean. Ecology and Society 9:1-10. http://www.ecologyandsociety.org/vol9/iss1/art10
Eating your way to the top

http://www.flmnh.ufl.edu/fish/Gallery/Descript/YellowfinTuna/YellowfinTuna.html
Trophic Transisitions

      Ecopath Switch

        Ontogenetic

                       Central Pacific   Eastern Tropical Pacific
Impact of Fishery on Trophic Level (1) WCPO Ontogentic
Impact of Fishery on Trophic Level (2)

EPO Switch
Impact of Ecosystem on Fishery
Conclusions
• Impact of fisheries on biomass is variable
   – Expansion of the purse seine fishery had extended fishing mortality to all age classes
     of some species
   – Some stocks have declined to a point where management intervention is required
   – Some stocks appear to have increased in abundance

• Fish larger than 150cm have declined to about 20% of their predicted abundance in the
  absence of fishing

• Impact on trophic stucture within the guild of “top predators” is not detectable

• Fishery-independent trends in recruitment and biomass

• Estimated increase in skipjack biomass consistent with predictions from food web models
   – Further work on skipjack stock assessment should be given priority
   – Possiblities for assessments of mahi mahi, ono, and small tunas should be evaluated
Fishery Management Options • United States Domestic: F > MMSY (overfishng), but B > BMSY (not overfished) – US catch comprises approximately 0.5% longline and 5% purse seine yellowfin catch – US catch comprises approximately 1% longline bigeye catch • International – IATTC – WCPFC
The Claims

“... large predatory fish biomass today is only about 10% of pre-
industrial levels.”
Ransom A. Myers and Boris Worm. 2002. Rapid worldwide depletion of predatory fish communities Nature 423:280-283.

“I know that the human being and the fish can coexist.”
George W. Bush

   • Misinterpretation of CPUE
        – CPUE is not a reliable index of abundance
        – “Community” CPUE a bogus concept

   • Omits of most of data
Interpretation of Catch per Unit Effort (1)
Albacore South of the Equator
Taiwan
4
CPUE (Fish/100 Hooks)
3
2
1
Japan
0
1950 1960 1970 1980 1990 2000
Year
Hampton, J, J. Sibert, P. Kleiber, M. Maunder, S. Harley. 2005. Decline of Pacific tuna populations exaggerated? Nature 434:E1-E2.Interpretation of Catch per Unit Effort (2)
Yellowfin South of 10 South
CPUE (Fish/100 Hooks)
0 1 2 3 4 5 6
_
35% Decline by 2900 tonne removal
_
Total Catch (mt)
5000 10000
60% Decline by 8900 tonne removal
_
0
1950 1960 1970 1980 1990 2000
Year
Yellowfin Between 10 South and 10 North
4e+05
CPUE (Fish/100 Hooks)
2.0
Total Catch (mt)
2e+05
1.0
0e+00
0.0
1950 1960 1970 1980 1990 2000
YearSelective use of data (1)
Selective use of data (2)
You can also read