Anwendungen des Statistical Parametric Mapping (SPM) in der klinischen Ganganalyse - Dr. Ursula Trinler, BG Klinik Ludwigshafen ...
←
→
Page content transcription
If your browser does not render page correctly, please read the page content below
Anwendungen des Statistical Parametric Mapping
     (SPM) in der klinischen Ganganalyse

            Dr. Ursula Trinler, BG Klinik Ludwigshafen, ursula.trinler@bgu-ludwigshafen.de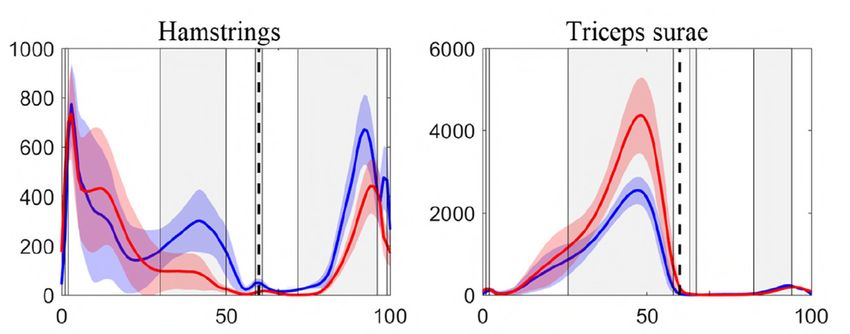
Was ist SPM?

                                    Was kann ich mit SPM machen?

                       Wie kann ich die Ergebnisse interpretieren?

                                  Wie kann man SPM durchführen?

03.04.2019   Ursula Trinler, Statistical Parametric Mapping             2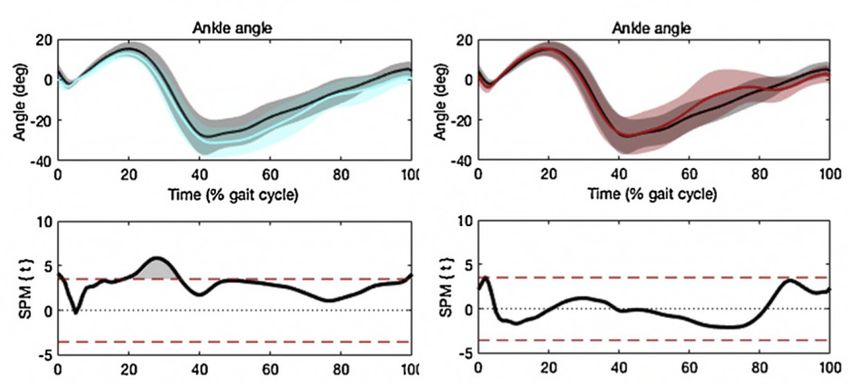
Gluteus medius
 Kraft [N]

03.04.2019   Ursula Trinler, Statistical Parametric Mapping        3
Definition aus Scholarpedia (http://www.scholarpedia.org/article/Statistical_parametric_mapping)

   Statistical parametric mapping is the application of Random Field Theory to make inferences about the
           topological features of statistical processes that are continuous functions of space or time.

      Statistical Parametric Maps (SPM) are images or fields with values that are, under the null hypothesis,
      distributed according to a known probability density function, usually the Student's t or F-distributions.

SPMs are interpreted as continuous statistical processes by referring to the probabilistic behaviour of random
                                                   fields.

 'Unlikely' topological features of the SPM, like peaks or clusters, are interpreted as regionally specific effects,
  attributable to the experimental manipulation. A General Linear Model is used to explain continuous (image)
                    data in exactly the same way as in conventional analyses of discrete data.

Random Field Theory (RFT) is used to resolve the multiple-comparison problem when making inferences over
  the volume analysed. RFT provides a method for adjusting p-values for the search volume and plays the
               same role for SPMs as the Bonferroni correction for discrete statistical tests.

03.04.2019                 Ursula Trinler, Statistical Parametric Mapping                                               4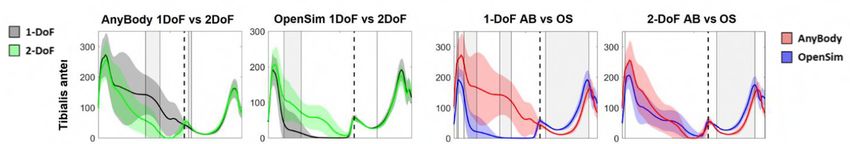
Definition aus Scholarpedia (http://www.scholarpedia.org/article/Statistical_parametric_mapping)
Statistical parametric mapping is the application of Random Field Theory to make inferences about the
topological features of statistical processes that are continuous functions of space or time.
SPM verwendet Random Field Theory (mathematische Vorgehensweise), um
Statistical Parametric Maps (SPM) are images or fields with values that are, under the null hypothesis,
statistische Rückschlüsse auf fortlaufende Daten in Raum oder Zeit zu ziehen.
distributed according to a known probability density function, usually the Student's t or F-distributions.
SPM definiert Cluster innerhalb der Daten, welche nach einer bestimmten
SPMs are interpreted as continuous statistical(tprocesses
Wahrscheinlichkeitsfunktion by referring
oder F) verteilt sind. to the probabilistic behaviour of random
fields.
Dabei wird ein „General Linear Model“ verwendet, um, wie bei herkömmlichen
Analysen
'Unlikely' topological featuresvon
ofdiskreten
the SPM,Daten, fortlaufende
like peaks Daten
or clusters, statistisch
are darlegen
interpreted zu
as regionally specific effects,
können (z.B. SPM{t}).
attributable to the experimental manipulation. A General Linear Model is used to explain continuous (image)
data in exactly
Random the same
Field Theory wirdway as in conventional
verwendet analyses
um hierbei den p-Wertofan
discrete data.
Mehrfachvergleiche anzupassen (wie eine Bonferroni Korrektur).
Random Field Theory (RFT) is used to resolve the multiple-comparison problem when making inferences over
the volume analysed. RFT provides a method for adjusting p-values for the search volume and plays the
same role for SPMs as the Bonferroni correction for discrete statistical tests.
03.04.2019 Ursula Trinler, Statistical Parametric Mapping 5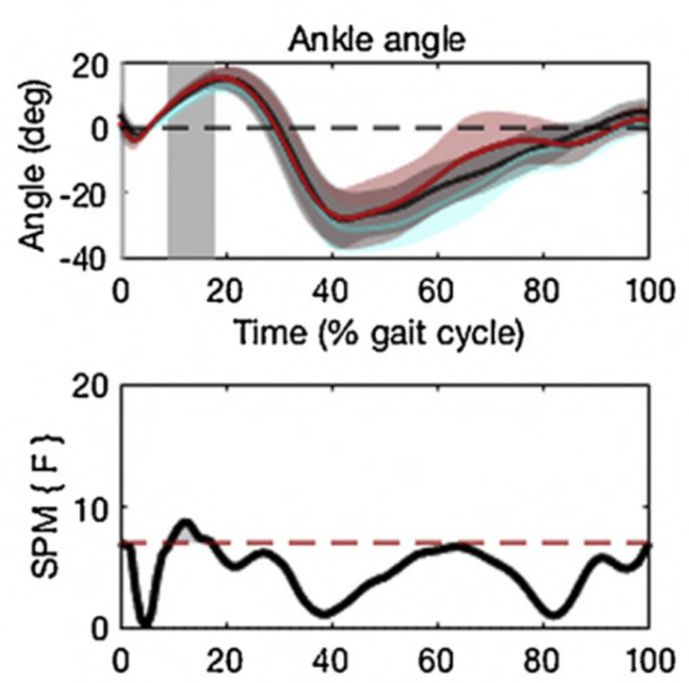
Analyse von biomechanischen Daten
               Beobachtung über einen bestimmten Zeitraum

                  Lokale Maxima- oder Minima einer Kurve                    Example ‘directed’ null hypothesis:
                            Lokale skalare Größe                            Controls and Patients exhibit identical
                                                                            maximum knee flexion at 30% stance.
                    („0D biomechanische Informationen“)
                             t-Test oder ANOVA

                                                             Example ‘non-directed’ null hypothesis:
                        Ganze Kurvenverläufe
                                                             Controls and Patients
                         zeitliche Komponente                Exhibit identical knee kinematics during
                 („1D biomechanische Informationen“)         stance phase.
                                  SPM
      verwendet Grundlagen klassischer Statistik (t-Test, ANOVA…)
Adler & Tayler 2007, Friston et al. 2007, Pataky 2012, Pataky et al. 2013
03.04.2019                 Ursula Trinler, Statistical Parametric Mapping                                             6
n-dimensionale Methode (1D, 2D, n-D Daten) um Analysen an glatten/geglätteten
(„smooth“) Datensätzen durchzuführen
Begrenzte („bounded“) Daten in Raum oder Zeit (z.B. definierte Standphase im Gang)
OBACHT: z.B. Stand vs. Schwungphase
Vorteil: Vermeidet Datenreduktion; Diskrete Daten müssen nicht definiert werden und Bias
wird so vermieden
Vorteil: Einfachere Visualisierung, Ergebnisse können direkt in den experimentellen Daten
angezeigt werden, so dass die räumlich-zeitliche Komponente direkt sichtbar wird. (Pataky
2010, Appendix D)
03.04.2019 Ursula Trinler, Statistical Parametric Mapping 7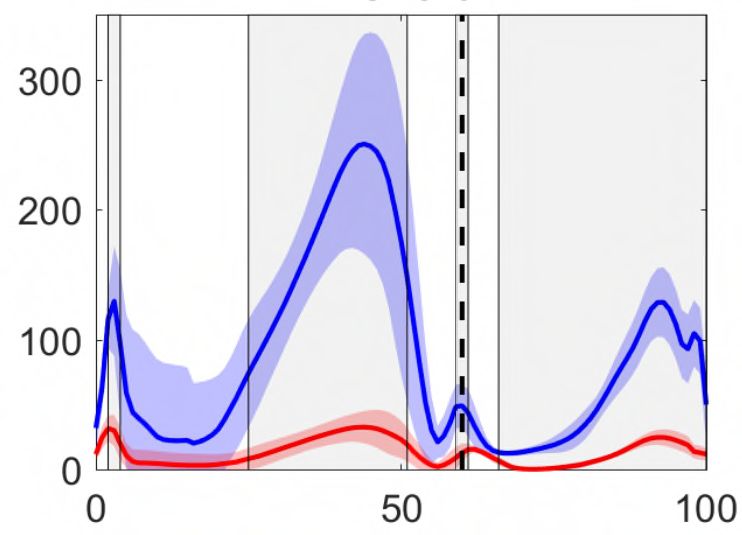
Adler & Tayloer 2007, Friston et al. 2007, Pataky 2012

03.04.2019   Ursula Trinler, Statistical Parametric Mapping                                                            8
Fragen?

03.04.2019   Ursula Trinler, Statistical Parametric Mapping   9
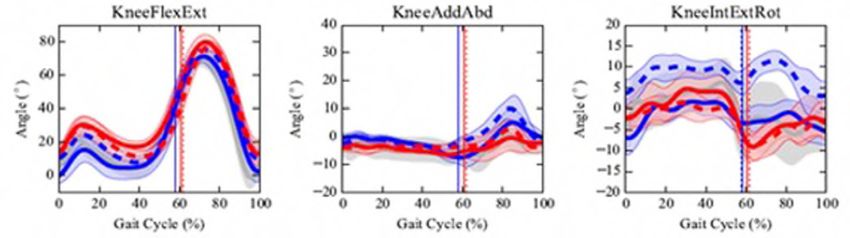
SPM two-tailed paired t-Test
                        Robinson et al. 2014, Sports Exerc. 46(7)

    Impact of Knee Modeling Approach on Indicators and Classification of Anterior Cruciate Ligament Injury Risk

                        Ursula Trinler, Statistical Parametric Mapping
03.04.2019                                                                                                        10
SPM two-tailed paired t-Test
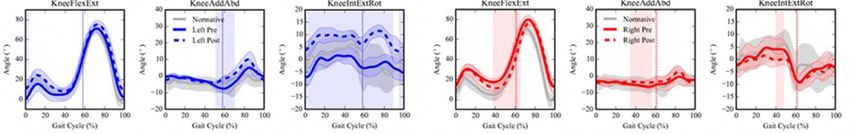
Trinler et al. 2019, J Biomech 86
Muscle force estimation in clinical gait analysis using AnyBody and OpenSim
Muscle force [N]
03.04.2019 Ursula Trinler, Statistical Parametric Mapping 11SPM repeated measures ANOVA mit post hoc Analyse
Nüesch et al. 2019, G&P 69
The effect of different running shoes on treadmill running mechanics and muscle activity assessed using SPM
Cloudsurfer (cyan) Cloudsurfer (cyan) Cloud (red)
Cloud (red) own shoe (black) own shoe (black)
own shoe (black)
03.04.2019 Ursula Trinler, Statistical Parametric Mapping 12SPM 2-way repeated measures ANOVA mit post hoc Analyse
Trinler et al. 2018, ESMAC 2018
Influence of ankle’s degree of freedom on muscle force estimation in different simulation environments
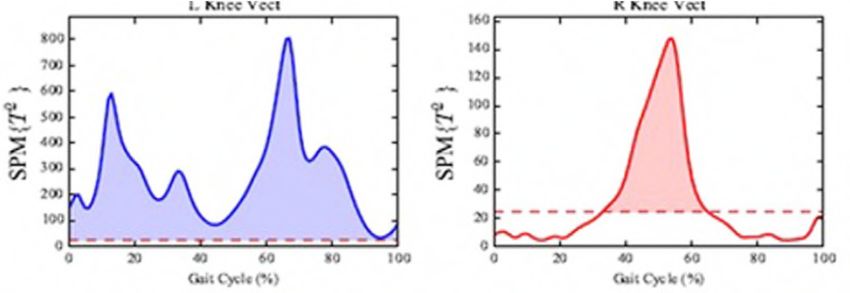
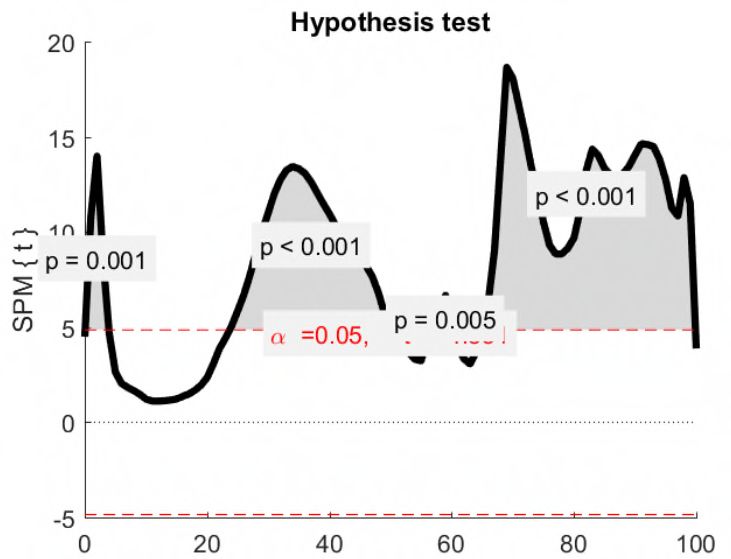
03.04.2019 Ursula Trinler, Statistical Parametric Mapping 13Beispiel SPM Hotelling's T² mit post hoc analysis
Donnelly et al. 2017, Clin Biomech 41:87-91.
Vector-field statistics for the analysis of time varying clinical gait data
03.04.2019 Ursula Trinler, Statistical Parametric Mapping 14Hompepage SPM1D
http://www.spm1d.org/
03.04.2019 Ursula Trinler, Statistical Parametric Mapping 15SPM und MATLAB
1. Daten in Matlab laden
Daten müssen in bestimmter Reihenfolge geordnet werden
Können z.B. in einem Excel oder Matlab File gespeichert sein
dataset = spm1d.data.uv1d.t2.SimulatedTwoLocalMax();
[YA,YB] = deal(dataset.YA, dataset.YB);
2. SPM durchführen
Test auswählen
spm = spm1d.stats.ttest2(YA, YB);
spmi = spm.inference(0.05, 'two_tailed',true, 'interp',true);
disp(spmi)
3. Graphen und Statistik plotten
close all
spmi.plot();
spmi.plot_threshold_label();
spmi.plot_p_values();
03.04.2019 Ursula Trinler, Statistical Parametric Mapping 16Tutorials, weitere Informationen
Homepage SPM1D. Todd Pataky
http://www.spm1d.org/
SMP Tutorial durch Jos Venrenterghem
https://www.youtube.com/watch?v=4WoDuBkUF9U&list=PL
a8HCd4pvpVZtc2zPwSelRWjEjcbYZfv4&index=1
Random Field Theory, Matthew Brett et al. (2003)
https://www.fil.ion.ucl.ac.uk/spm/doc/books/hbf2/pdfs/Ch14.
pdf
03.04.2019 Ursula Trinler, Statistical Parametric Mapping 17Vielen Dank
Literatur

         Adler, R.J., Taylor, J.E., 2007. Random Fields and Geometry. Springer.

         Donnelly CJ, Alexander C, Pataky TC, Stannage K, Reid S, Robinson MA (2017). Vector-field statistics for the analysis of time varying clinical
         gait data. Clin Biomech 41:87-91.

         Friston KJ, Ashburner JT, Kiebel SJ, Nichols TE, Penny WD 2007. Statistical parametric mapping: the analysis of functional brain images.
         Amsterdam: Elsevier/Academic Press.

         Nüesch C, Roos E, Egloff C, Pagenstert G, Mündermann A. (2019). The effect of different running shoes on treadmill running mechanics an
         muscle activity assessed using statistical parametric mapping (SPM). G&P 69:1-7

         Pataky TC. 2010. Generalized n-dimensional biomechanical field analysis using statistical parametric mapping. J Biomech. 43(10):1976–1982.

         Pataky, T.C., Robinson, M.A., Vanrenterghem, J., 2013. Vector field statistical analysis of kinematic and force trajectories. J. Biomech. 46 (14),
         2394–2401.

         Robionson MA, Donnelly CJ, Tsao J, Venrenterghem J. (2014). Impact of Knee Modeling Approach on Indicators and Classification of Anterior
         Cruciate Ligament Injury Risk. Med Sci Sports Exerc. 46(7):1269-76

         Trinler U, Alexander N, Baker R, Schwameder H (2018) O 106 – Influence of ankle’s degree of freedom on muscle force estimation in different
         simulation environments. G&P,65:S.1

         Trinler U, Schwameder H, Baker R, Alexander N. (2019) Muscle force estimation in clinical gait analysis using AnyBody and OpenSim. J
         Biomech 86:55–63.

03.04.2019                       Ursula Trinler, Statistical Parametric Mapping                                                                               19
You can also read