A link between pollen and thunderstorm asthma : What is happening in South East Queensland and Australia? - Divya Dwarakanath, BDS,MPH(Env health)
←
→
Page content transcription
If your browser does not render page correctly, please read the page content below
A link between pollen and thunderstorm asthma : What is
    happening in South East Queensland and Australia?

           Divya Dwarakanath, BDS,MPH(Env health)
         Allergy Research Group, Queensland University of Technology

                             PhD Researcher
                           ARC Discovery Project

                  divya.dwarakanath@qut.edu.au
Pollen & Thunderstorm asthma             SEQ & Australia update

• Processes contributing to pollen     • ARC Discovery project vision
  levels                               • Pollen season severity &
• Clinically important grasses in        descriptive analysis of pollen
  Australia                              1990’s -2018
• Factors influencing pollen allergy   • EVI ,Temperature, Wind
• Epidemic thunderstorm asthma           distribution, Humidity vs pollen
  phenomenon                           • Australian pollen monitoring
• Management of TA                       stations
Three processes : Pollen levels

        1                     2                    3
Production          Release               Distribution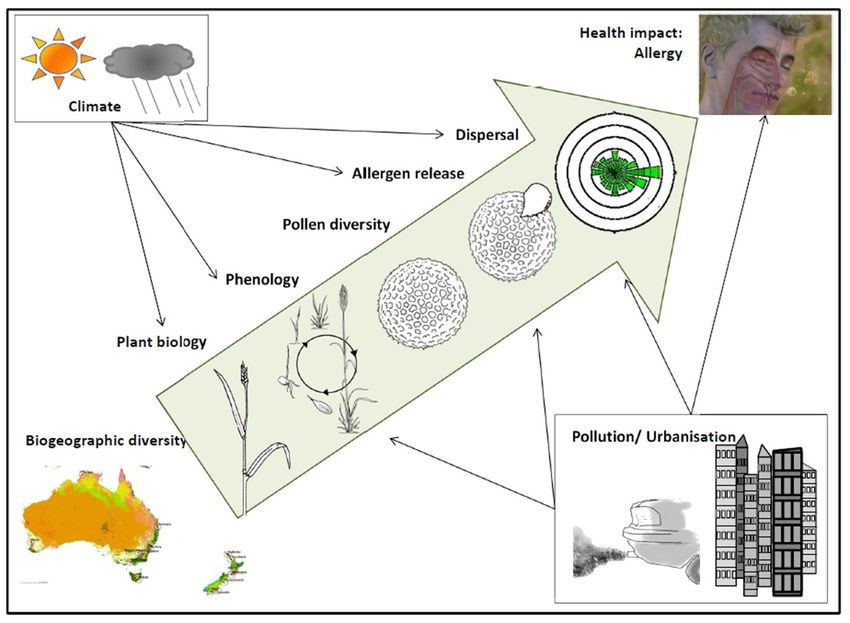
Clinically important grasses of Australia

              Chloridoideae Cynodonteae Cynodon dactylon                                        Bermuda
                                        (Bermuda)                                               Figure 1
    Subtropical grasses
                                       Paspaleae    Paspalum notatum
                                                    (Bahia)
                                                                            Zea mays
                          Panicoideae                                       (maize)
    Poaceae
     family                              Andropogonodae                                          Bahia
                                                                            Sorghum halepense
                                                                            (Johnson)            Figure 2

                  Pooideae
                                 Poeae                         Lolium perenne (Ryegrass)
      Temperate grasses
                                                                                                 Johnson
                                                               Phleum pratense                   Figure 3
                                                               (Timothy)

                               (Source : Davies et al, 2012)

                                                                                                Ryegrass
                                                                                                Figure 4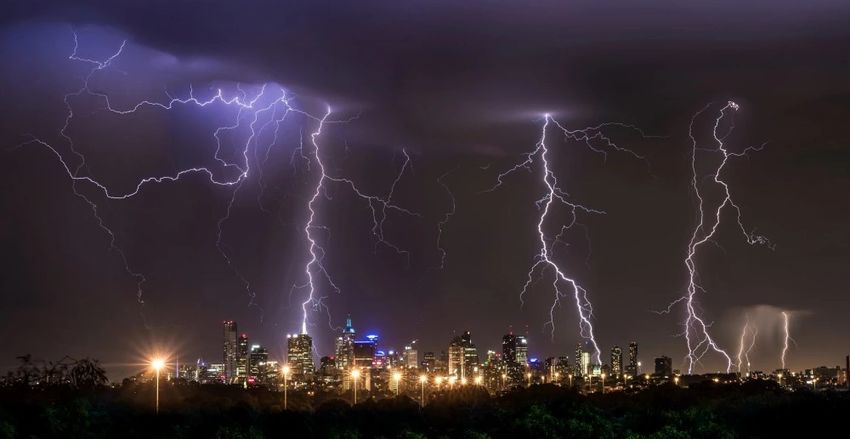
Climate affects distribution of grasses & allergic rhinitis

                                                          Figure: 2

                                              Subtropical species -
Climate and prevalence of hay fever
                                              Temperate species -

                                      [Source : Devis et al., 2017 (Fig 1);
                                      Medek et al.,2016 (Fig 2)]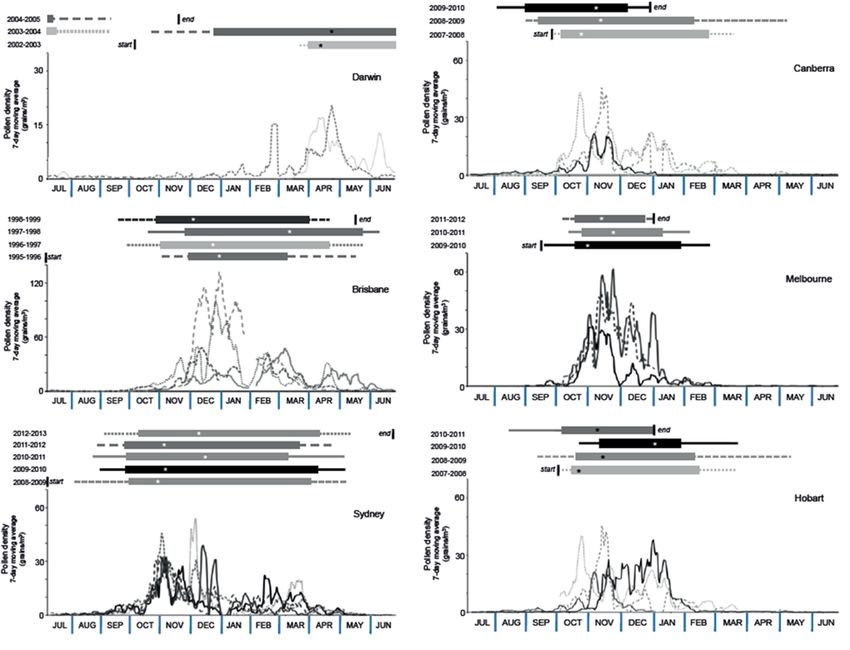
Factors influencing pollen allergy

                                     (Source: Davies et al.,2015)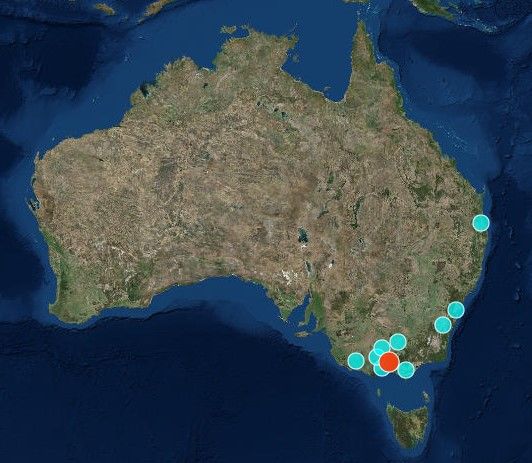
Epidemic Thunderstorm Asthma

“Epidemic thunderstorm asthma events are thought to be triggered by an uncommon
combination of high grass pollen levels and a certain type of thunderstorm, resulting in
large numbers of people developing asthma symptoms over a short period of time”.

                                                                                                    Microscopic structure of
                                                                                                    Poaceae pollen and
                                                                                                    ruptured pollen

                           (Source : Thunderstorm asthma, Better health Channel, retrieved from
                           https://www.betterhealth.vic.gov.au/health/conditionsandtreatments/ast
                           hma-thunderstorm)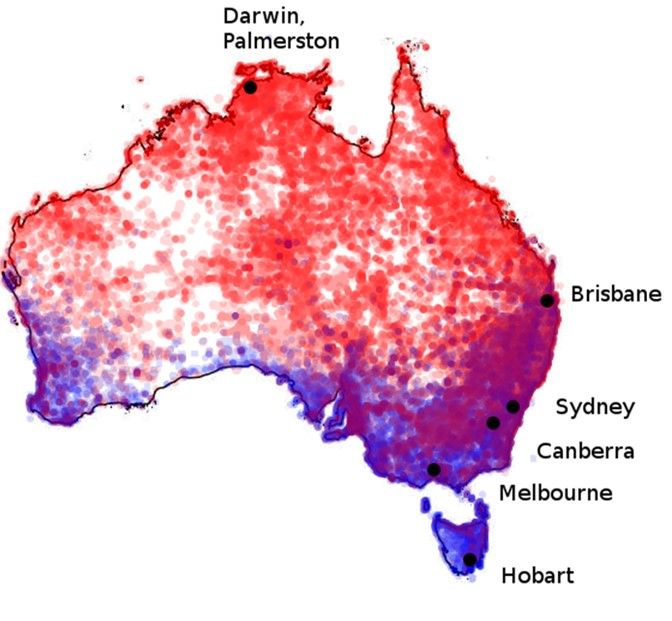
Thunderstorm Asthma events

             • High concentrations of allergenic
               material (grass pollen or fungal spores)
             • A thunderstorm outflow that sweeps up
               bioaerosols and suspends them near
               ground level in population centres
             • Formations of respirable-sized particles
               (
Symptom notifications

                                        1. Hay fever survey data on
                                           14th November 2016, a
                                           day with a low grass
                                           pollen count (two grains
                                           per cubic metre of air)

                                        1. 21ST November 2016,
                                           survey data, a day with
                                           extreme grass pollen
                                           count (102 grass pollen
                                           grains per cubic metre of
                                           air).

(Source: The University of Melbourne)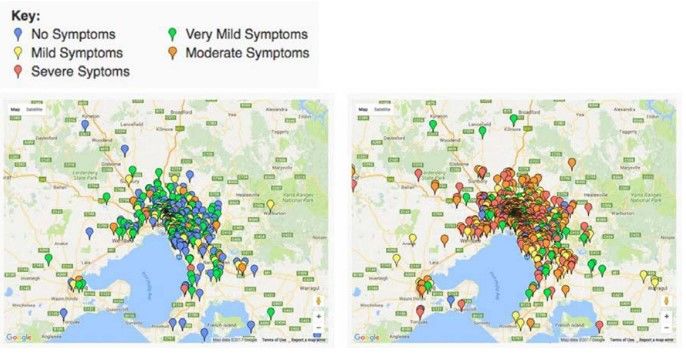
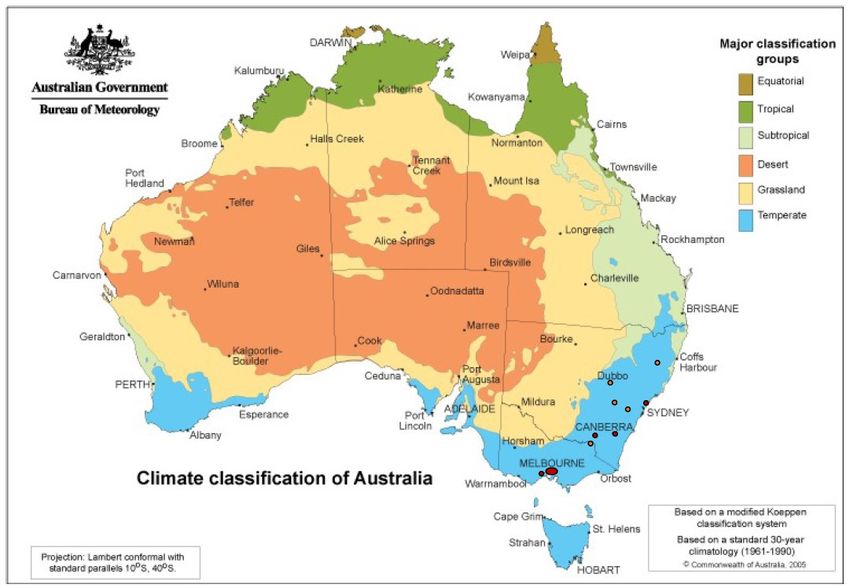
Thunderstorm asthma: temperate zones of Australia

       Koeppen Climate Classification zones with places in that have
       experienced thunderstorm asthma episodes (Davies et al., Allergy 2017)
Variability in grass pollen levels across Australia
Canberra
Darwin
Brisbane Melbourne
Hobart
Sydney
(Source :Beggs et al., 2015)Management of TA
Who are at the increased risk? How to prepare for this event?
• Understand the epidemic thunderstorm
• People with asthma asthma phenomenon
• People with a past history of asthma • Have an asthma action plan (where advised
• Those with undiagnosed asthma (i.e. people by your doctor) and /or have practical
who have asthma symptoms but have not knowledge of the 4 steps of asthma first aid
yet been diagnosed with asthma) • Have reliever medication appropriately
• People with seasonal hay fever (who may or available in grass pollen season and be
may not have asthma) aware of how to use it (ideally with a spacer)
• Be alert to and act on the development of
asthma symptoms as explained in your
asthma action plan if you have one, or if you
don’t, use asthma first aid
• Be aware of POLLEN AND THUNDERSTORM
FORECASTS.
(Source: Asthma Australia)ARC Discovery Project Vision
(Source: AUSTRALIAN RESEARCH COUNCIL Discovery Project DP170101630; 2017-
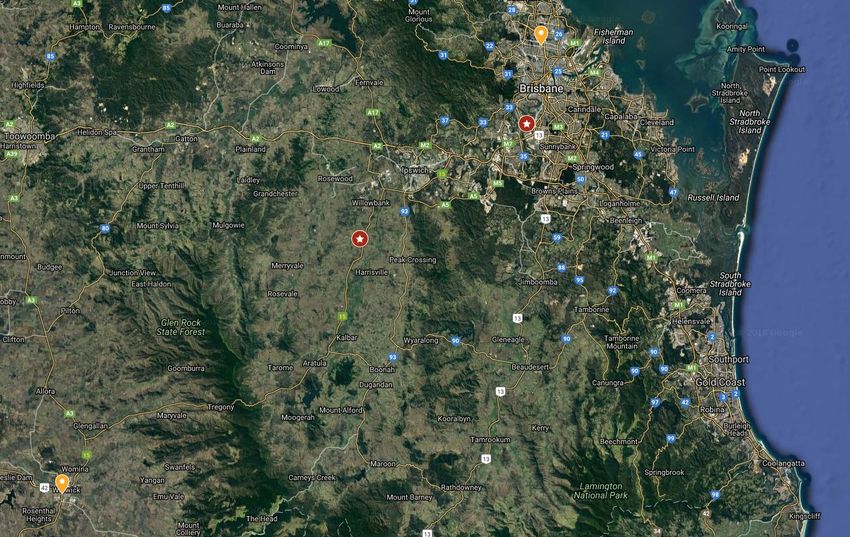
2019 )SEQ pollen monitoring sites
Grass pollen exposures and its impact on environmental public health

AIM 1 -To investigate the climate change impacts on grass
pollen distribution
•   Objective : Descriptive analyse and synthesis of temporal change Rocklea 1994-1999 vs 2016-2020)

AIM 2- To understand regional biogeographical variation in
pollen exposure
•   Objective : To understand the extent of spatial variability of pollen exposure
•   To examine influence of biogeographical source land areas to pollen measured in different locaitons (source, transport, deposition)

AIM 3- To investigate the health impacts associated with grass
pollen exposure
•   Objective : Point of care data pharma sales vs pollen data

•   Symptom score for BNE vs pollen data
Variability in grass pollen exposure and season severity
P r o p o r tio n o f d a y s %
400 300 100
N um b er of d ays
N um ber of days
E x tre m e > 1 0 0
300 H ig h > 5 0 , < 1 0 0
200 M o d e ra te 2 0 -4 9
200 50 L o w < 2 0
100
100
0 0 0
94
95
96
97
98
7
8
7
8
1
1
19
19
19
19
19
1
1
0
0
0
0
-2
-2
-2
-2
6
7
6
7
1
1
1
1
P r o p o r tio n o f d a y s %
0
0
0
0
2
2
2
2
100
E x tre m e > 1 0 0
H ig h > 5 0 , < 1 0 0
M o d e ra te 2 0 -4 9
Low < 20
50
0
7
890’s vs 20’s grass pollen data in Rocklea
Rocklea 1994-1999
Rocklea 2017-2018
Green et al. 2002. Grana
Airborne pollen of Brisbane, Australia
a five year record 1994-1999.
41: 242-250.
250
Grass pollen concentration
200
)
-3
(grains m
150
100
50
0
1/10/2017 1/11/2017 1/12/2017 1/01/2018 1/02/2018 1/03/2018 1/04/2018 1/05/2018
Date (d/mm/yyyy)90’s & 20s other pollen data in Rocklea
Rocklea 1994-1999
Rocklea 2017-2018
Green et al. 2002. Grana
Airborne pollen of Brisbane, Australia
a five year record 1994-1999.
41: 242-250.
Daily concentration of Myrtaceae, Cuprassaceae
100 250
Daily concentration of Asteraceae
and Casuarinaceae (grains m )
-3
80 200
60 150
(grains m )
40 100
-3
20 50
0 0
1/09/2017 1/11/2017 1/01/2018 1/03/2018 1/05/2018
Date (d/mm/yyyy)
Daily concentration of Myrtaceae, Cuprassaceae
100 250
Mutdapilly 2017-2018
Daily concentration of Asteraceae
)
-3
80 200
and Casuarinaceae (grains m
60 150
40 100 (grains m )
-3
20 50
0 0
1/09/2017 1/11/2017 1/01/2018 1/03/2018 1/05/2018
Date (d/mm/yyyy)Pollen season sum (Figure : Pollen Season sum as an offset from the 1990s average season sum. Missing values filled with season mean)
Grass pollen seasonality in Rocklea and Mutdapilly

                                                            grass
                                           38%              other

                                                     62%

                                                            grass
                                                            other
                                         46%

                                                      54%
Descriptive analysis of pollen seasons in Brisbane
Enhanced vegetation Index And Pollen
Enhanced vegetation Index And Pollen
Temperature vs pollen
Moving mean temperature
Wind Distribution at 3AM 1994-99 & 2015-18
Wind Distribution at 6AM 1994-99 & 2015-18
Wind Distribution at 9AM 1994-99 & 2015-18
Wind Distribution at 12PM 1994-99 & 2015-18
Humidity and pollen
Australian pollen monitoring stations

                            1.Victoria – 8 sites
                            2.NSW – 3 sites (1
                              main site)
                            3.QLD – 4 sites (1
                              main site)
                            4.WA – 1 site
                            5.SA – 1 site
                            6.Tasmania – 1 site
Standardized national pollen alert system for better
management of allergic respiratory health
AusPollen aims to provide allergy patients with accurate
local pollen count information.
(Source: Medek et al., 2017)www.pollenforecast.com.au
Partner Organisations
The AusPollen Partnership Project is supported (Sept 2016 – Aug 2020) by
NHMRC with matching in kind and cash contributions from partner
organisations.Acknowledgements
QUT Allergy Research Group
Prof Janet Davies, Dr Andelija Milic, Dr Beth-Addison Smith, Dr Bradley Campbell,
Dr Jacob Tickner, Thina Kailaivasan, Divya Dwarakanath, Marko Simunovic
ARC Discovery team (External supervisors)
Prof Alfredo Huete (UTS), Prof Paul Beggs (Macquarie)
Co –supervisor Prof Hillary Bambrick (QUT)
Funded by : QUT Centre for Children’s Health Research Scholarship and the
project is supported by ARC Discovery Grant DP170101630.
Assoc Prof Janet Davies (CIA), Queensland University of Technology, Brisbane Assoc Prof Bircan Erbas, La Trobe University, Melbourne
ProfConstance Katelaris, Campbelltown Hospital & Western Sydney University, Assoc Prof Ed Newbigin, The University of Melbourne, Melbourne
Sydney
Prof Alfredo Huete, University of Technology Sydney, Sydney Dr Elizabeth Ebert, Bureau of Meteorology, Melbourne
Dr Rieks van Klinken, Commonwealth Scientific and Industrial Research Prof Simon Haberle, The Australian National University, Canberra
Organisation, Brisbane
Dr Danielle Medek, Waitemata District Hospital, New Zealand Assoc Prof Paul Beggs, Macquarie University, SydneyYou can also read