FOUNDERS' DAY 2020: ADVERSITY, CHALLENGE, AND OPPORTUNITY
←
→
Page content transcription
If your browser does not render page correctly, please read the page content below
FOUNDERS’ DAY 2020:
             ADVERSITY, CHALLENGE, AND
                   OPPORTUNITY
Thank you for taking time to review and consider
these thoughts, ideas and reflections presented at
Founders Day, September 3, 2020. I have annotated
these slides with comments using the Adobe sticky    David L. Eisler, president
note function. If you will save this file to your    Sally DePew, director,
computer and open it with an Adobe product,
                                                     Budgetary Planning and Analysis
clicking on the yellow squares with the balloons
inside will open a comment box. As always I
appreciate hearing from you, please write me at
eislerd@ferris.edu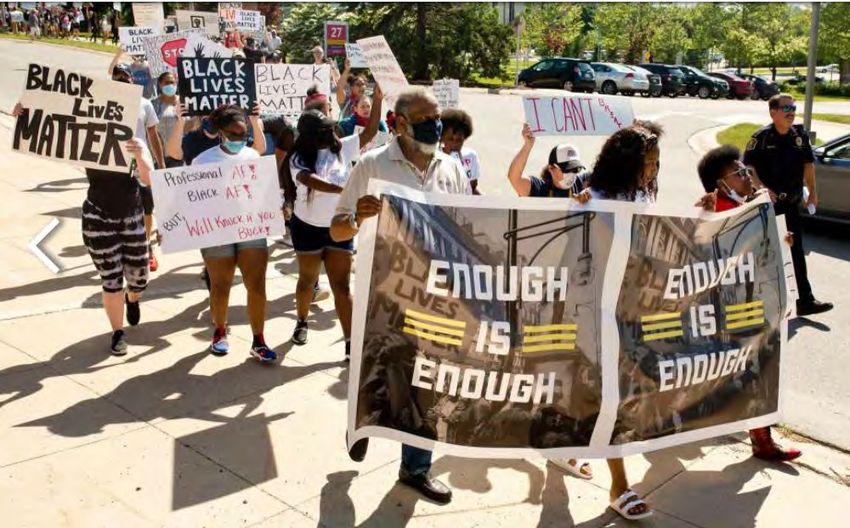
OUR FOUNDERS
WOODBRIDGE AND HELEN GILLESPIE
           FERRIS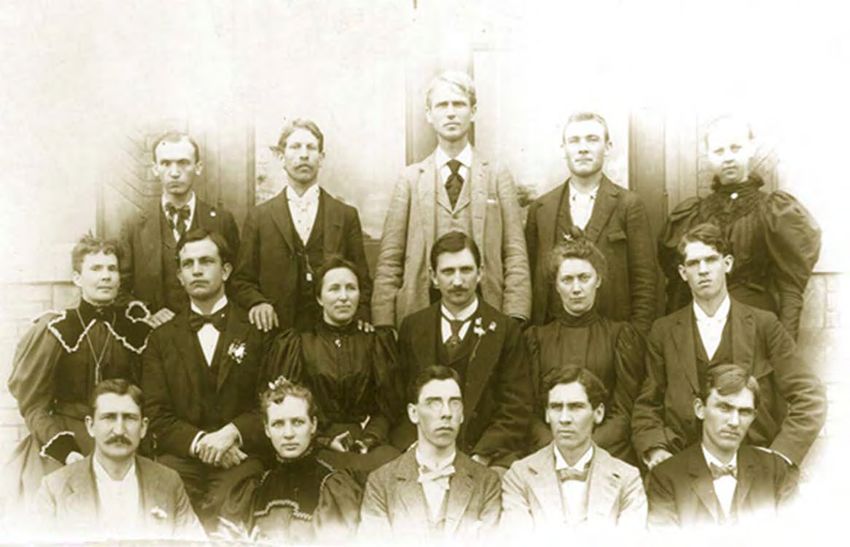
FIRST CLASS, BIG RAPIDS
  INDUSTRIAL SCHOOL
      SEPTEMBER 1, 1884
Woodbridge N. Ferris
“THE FERRIS INSTITUTE IS
THOROUGHLY DEMOCRATIC

THAT IS TO SAY, IT IS A
SCHOOL FOR ALL THE
PEOPLE REGARDLESS OF
RACE OR STATION.”
         W. N. FERRIS - 1906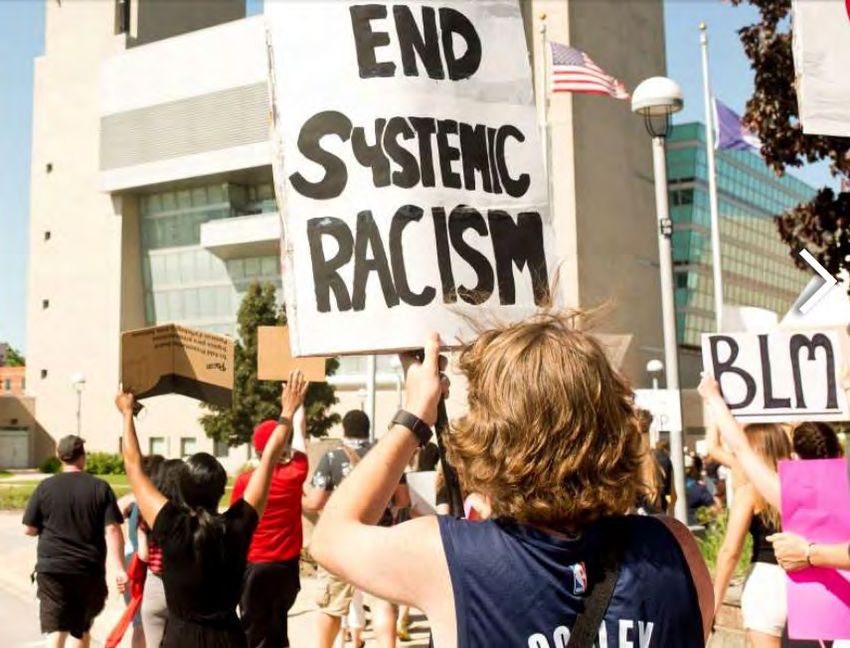
CHALLENGES
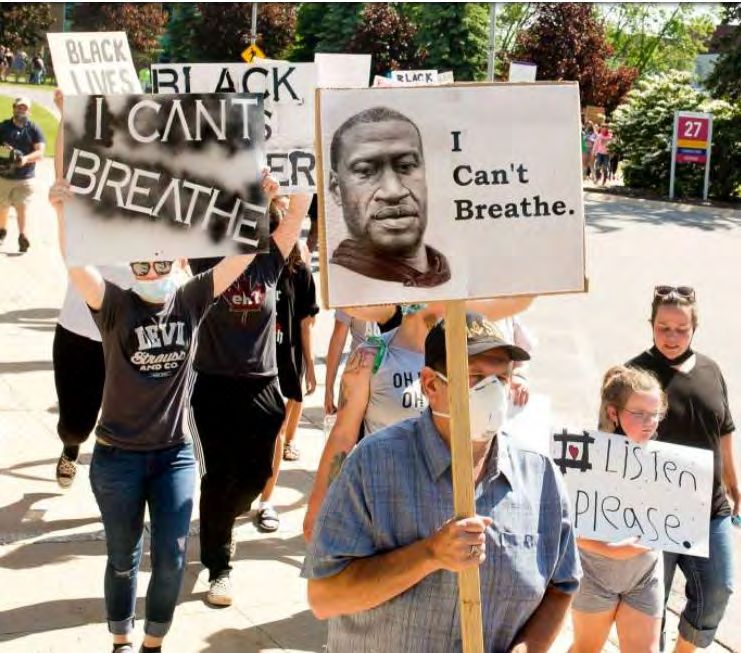
NOW IS THE TIME

 FOR FERRIS STATE UNIVERSITY

           TO MAKE

 A CONTINUING COMMITMENT TO

DIVERSITY, EQUITY AND INCLUSION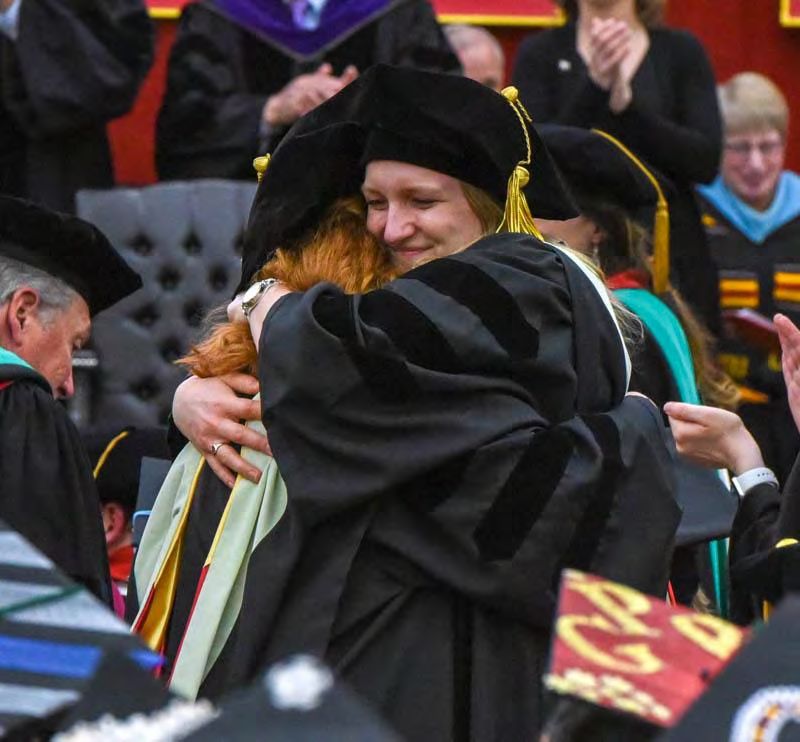
WHAT WE HAVE STARTED…
• Demographic data on student contacts with the
  Department of Public Safety and Office of Student
  Conduct
• Sustained dialogues with Big Rapids public officials and
  residents about racial injustice
• University-wide initiative, “One Community: One Book”
  using Haste to Rise to build community while addressing
  our commitment to opportunity and racial justice
• Assembling an Equity Council of local advisors to move
  forward diversity, equity, and inclusion at Kendall College
  of Art and Design
WHAT WE WILL DO THIS FALL…
• Professional development on diversity, equity and
  inclusion with senior leadership. Sessions throughout
  the year for other employee groups.
• In October National Assessment of Collegiate
  Climates audit of students’ attitudes regarding
  campus inclusiveness.
• Establish Campus Climate Team to proactively
  respond to instances of bias.
• Conversations with senior leadership and students.
WHAT WE WILL DO THIS YEAR…
• Collect and analyze data on status of minority employees
  particularly as it relates to recruitment, retention, and
  promotion.
• Identify gaps in academic achievement and reduce these
  gaps.
• Strengthen and align work in offices that work directly
  with diverse populations.
• Identify and adopt additional efforts developed from
  campus and community conversations.
• Begin formulating the university’s next diversity and
  inclusion plan.
Now is the Time for an Enhanced
AND OUR CONTINUING COMMITMENT
to Diversity, Equity and Inclusion
Help begin this by:
• Download the commitment document.
• Make a personal commitment and sign the
  commitment page.
• Attend an upcoming diversity, equity, and inclusion
  discussion
• Actively engage in these efforts, now, throughout this
  year and in the future
Now is the Time
COVID-19
COVID-19
COVID PREVENTION EFFORTS
• Re-entry Committee
• Masks, Enhanced Cleaning/Disinfecting
• Air Quality Studies and Enhancement
• Social Distancing
• De-densify Campus
• Face-to-Face, HyFlex, Online
• Single room for the cost of a double
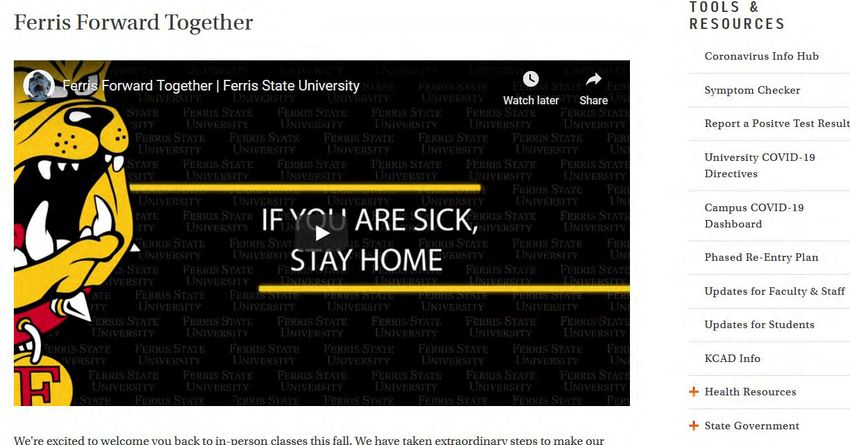
• Communication
• Ferris Forward Together Bond
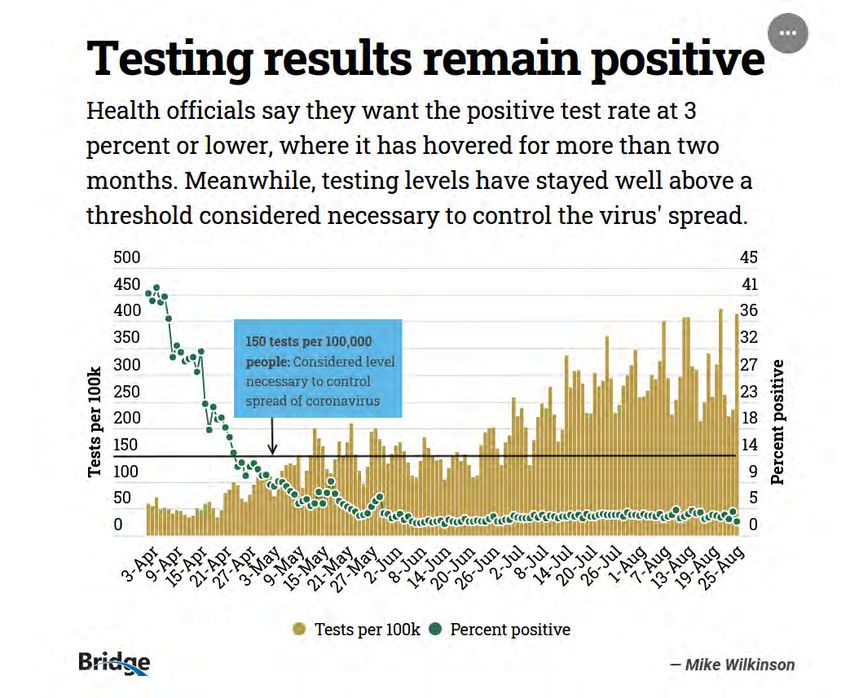
• TestingFALL HEADCOUNT ENROLLMENT
UNIVERSITY-WIDE
2020 estimate as of 9/2/20
14,560 14,533 14,707 14,600 14,715 14,187 13,798
13,250
12,472
11,142
Fall 2011 Fall 2012 Fall 2013 Fall 2014 Fall 2015 Fall 2016 Fall 2017 Fall 2018 Fall 2019 Fall 2020
Est.
Decline from 2015 to 2019 of 2,243 or 15.24%CONTINUING STUDENTS
FALL SEMESTER
Fall 2020 decline smallest
over past 5 years 210
students
9,704 9,755 9,764 9,698 9,891 9,491
9,102 8,636 - 2.6%
8,011 7,801
2011 2012 2013 2014 2015 2016 2017 2018 20192020 Est.
Decline from 2015 to 2019 is 1,880 or 19.01%FIVE-YEAR SUMMARY
GENERAL FUND BUDGET REDUCTIONS
General Fund Positions Eliminated
Maint. Reduction
Admin Faculty Clerical /Other Total Amount
FY17 12.5 5.0 3.0 3.5 24.0 $5.15 M
FY18 3.0 1.0 5.0 0.5 9.5 $2.98 M
FY19 21.5 10.0 20.0 3.5 55.0 $8.31 M
FY20 15.0 11.0 3.0 3.0 32.0 $5.44 M
FY21 51.0 43.0 13.0 11.5 118.5 $20.2 M
GF Totals 103.0 70.0 44.0 22.0 239.0 $42.08 MENROLLMENT AND BUDGET
• Summer enrollment
• Headcount down 8.2% in Big Rapids; 8.4% University-wide
• SCH decline of 6.4% across the university
• Fall enrollment, currently (as of 9/2/20)
• Headcount down 10.89%
• SCH down 8.95%
• Budget based on
• Fall SCH decline of 9%
• Projected 10% reduction from the State
• Projected to be near budgetSUCCESSES
TUITION INCENTIVE PROGRAM (TIP)
           ENROLLMENT
                                                                           1,820
                                                                   1,740

                                           1,453   1,460   1,426
                           1,243   1,309
                   1,119
            978
     894

     FY11   FY12   FY13    FY14    FY15    FY16    FY17    FY18    FY19    FY20

Over the decade, an increase of 112%
STUDENT DIVERSITY
Hispanic Student Enrollment - Fall
743 750
696 714
672
556
507
452
423
340
2010 2011 2012 2013 2014 2015 2016 2017 2018 2019
The diversity of students has Since Fall 2010, the number
increased 46.3% since 2010, of Hispanic students has
14.9% in 2010, 21.8% in 2019. increased by over 120%.Ferris STATE UNIVERSITY
CHANGE IN NET PRICE
2009 TO 2019 >$110k
6.8%
$75k-110k
-2.9%
Average
-8.9%
$48k-$75k
-16.8%
$30k-$48k
-29.8%MPU CHANGE IN NET PRICE OF ATTENDANCE
COMPOSITE
2008-09 TO 2018-19
47.9%
41.8%
31.3%
28.9%
22.4%
20.8%
17.28%
17.1%
15.5%
12.7%
11.4%
7.6%
5.8%
2.8%
2.1%
FSU LSSU UMA GVSU CMU WMU MSU MTU OAK Average UMF UMD EMU SVSU NMU WSU
-8.9%
Source: NCES College NavigatorMPU COST OF ATTENDANCE
RESIDENT, ON-CAMPUS STUDENT
2008-09 TO 2019-20
54.5% 54.5%
51.1%
49.6%
46.2%
43.0% 43.1%
40.0%
38.3% 39.1% 39.2%
35.6% 36.6%
30.5%
22.3% 23.1%AVERAGE STUDENT DEBT
BACHELOR DEGREE GRADUATES WITH DEBT
$36,930 $37,325 $35,720 $35,660 $35,710 $35,606 $36,530
$34,767 $35,468 $35,476 $34,589
2008-09 2009-10 2010-11 2011-12 2012-13 2013-14 2014-15 2015-16 2016-17 2017-18 2018-19FUNDRAISING
NOW AND ALWAYS
CAMPAIGN $99,658,544
Current Total
$100,190,852 !
$86,227,750
$66,969,338
$55,383,160
FY17 FY18 FY19 FY20
Cumulative TotalsThe Year Ahead - October 5
and 6 Open Pathway
Process
Quality Initiative
Assurance Argument
COVID-19 ReportThe Year Ahead – Ferris Forward • Academics Pride and Community • Enhancing Resources Student Success • Institutional Effectiveness 14 Key Strategic Targets
STRATEGIC DECISIONS

• Revision Ferris Forward Strategic Plan
• COVID-19 response and success
• Targeted enrollment efforts
• Improved student success
• New academic programs
• Adult learners
• Branding and marketing
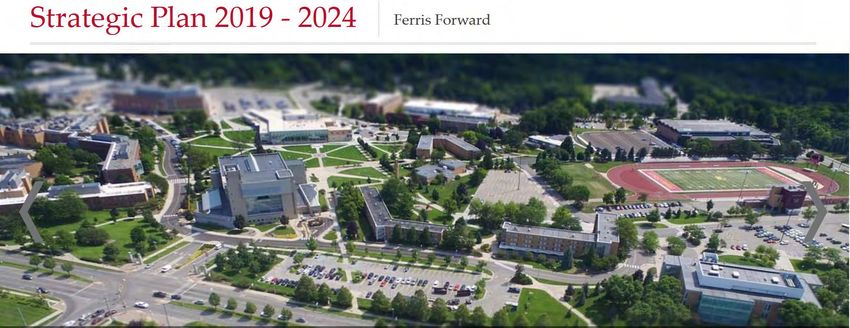
The Year Ahead – Ferris
Forward
Thank You
Thank you for persevering and adapting in the midst of historical adversity

And for your years of commitment to our university -

         encouraging and supporting our students

         helping to build a great university

         and continuing the vision of our founders, Woodbridge and Helen Ferris.

                                                  Thank you so very much.

                                                  Dave Eisler, president
You can also read