Statistical downscaling of CLM precipitation data with an analogue method using radar data of radar Essen (DWD) - Alrun Tessendorf, Thomas ...
←
→
Page content transcription
If your browser does not render page correctly, please read the page content below
Statistical downscaling of CLM precipitation data with an analogue method using radar data of radar Essen (DWD) Alrun Tessendorf, Thomas Einfalt hydro & meteo GmbH & Co. KG Markus Quirmbach dr. papadakis GmbH

Overview Introduction Data and research area Downscaling procedure Evaluation of the results Summary and conclusion

Introduction: dynaklim
dynaklim:
dynamical adaptation of regional planning and development processes
in the Emscher-Lippe-Region (North-Rhine-Westphalia)
effect of climate change on regional precipitation
Focus on extreme events: heavy rain as a potential risk for urban
flash floods
Introduction: dynaklim
dynaklim:
dynamical adaptation of regional planning and development processes
in the Emscher-Lippe-Region (North-Rhine-Westphalia)
effect of climate change on regional precipitation
Focus on extreme events: heavy rain as a potential risk for urban
flash floods
Generation of input data for small-scale hydrological models and
hydrodynamic sewer modelsIntroduction Small-scale hydrological models and hydrodynamic sewer models require input data with high spatial and temporal resolution: adjusted radar QPE
Introduction Small-scale hydrological models and hydrodynamic sewer models require input data with high spatial and temporal resolution: adjusted radar QPE Idea: using adjusted radar data for a statistical downscaling of regional climate model data
Introduction: statistical downscaling

classification method:
    •   Classification by weather type: basis for assignment of historical data
    •   Assumption: the model can better reproduce the large-scale weather
        situation than parameters on a smaller scale

analogue method:
    •   Selection of analogue weather events from historical measurements,
        based on a comparison of model and measurement data

stochastic weather generators

• combination of the methods
Introduction: statistical downscaling
classification method:
• Classification by weather type: basis for assignment of historical data
• Assumption: the model can better reproduce the large-scale weather
situation than parameters on a smaller scale
analogue method:
• Selection of analogue weather events from historical measurements,
based on a comparison of model and measurement data
stochastic weather generators
• combination of the methods
Analogue method with predictors daily sum and objective weather
type (DWD)Data and research area Regional climate model CLM provided by the Climate Service Center (CSC) : Scenario A1B, run 1 and run 2 Reference period: 1961-1990 (“C20”) , Near Future: 2021-2050 + Far Future: 2071-2100 • Daily sums • Objective weather types (Krahé et al., 2011)
Data and research area

Measurement data:
Corrected and adjusted data from radar Essen (DWD, 1km x 1 , 5min,
DX-product), 01.11.2001 – 01.11.2009
• Adjustment based on 580 controlled rain gauges (117 for validation)

Objective weather types (daily, measurements of the DWD)
Data and research area

Research area: 10 CLM grid points in the Emscher-Lippe Region
(North-Rhine Westphalia)
• Selection of the area: based on similar precipitation characteristics
  and orographic conditions.
• Production of data for 3 catchments near Dortmund, Duisburg and
  Bönen, catchment size 70-76 km²

                                                                                                 GP_088_092        GP_088_093     GP_088_094       GP_088_095
          GP_088_087        GP_088_088    GP_088_089         GP_088_090         GP_088_091

                                                                           Rorup

                                                                              Dülmen

                                                                                                                                    GP_087_094     GP_087_095
                                                                                GP_087_091       GP_087_092        GP_087_093
          GP_087_087        GP_087_088    GP_087_089         GP_087_090

                                                Lembeck
                                                                                                                Werne-Wessels DWD

                                                                                                                   Herringen
                                                                                                          Werne

                                                                                                                                      Welver DWD         GP_086_096
                                                                                                  GP_086_092                        GP_086_094      GP_086_095
                                                                                   GP_086_091                       GP_086_093
                             GP_086_088   GP_086_089      GP_086_090
          GP_086_087
                                                                       Recklinghausen Im Reitwinkel                                                Soest DWD

                                                  Gladbeck Hahnenbach                   Dortmund Nettebach
                       Dinslaken Emschermündung

                                                                                                                                                          GP_085_096

                                                                                                                                     GP_085_094      GP_085_095
                                                                                   GP_085_091     GP_085_092         GP_085_093
          GP_085_087         GP_085_088    GP_085_089         GP_085_090

                                                                                                   GP_084_092        GP_084_093       GP_084_094      GP_084_095
           GP_084_087        GP_084_088      GP_084_089       GP_084_090           GP_084_091
Data and research area
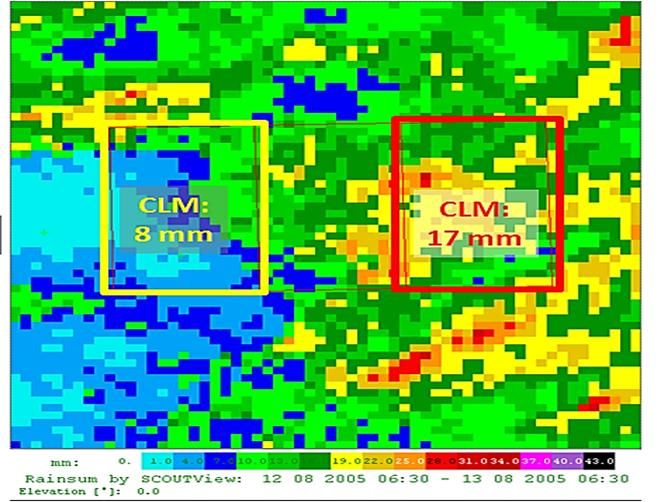
Precipitation distribution from radar of a convective event
on 12 August 2005:
24h-rain sums on 12 Aug 2005, rain sums
are 1-22 mm (left) and 7-31 mm (right)Downscaling procedure, overview:
CLM-Data Selection
Bias Adjusted radar
• obj. weather types procedure
• daily sums correction • based on daily
data (2001-2009)
• 2 runs (CLM 1 + 2) • daily sums sums/ obj. • ∆t 5 min
weather types • 1km x 1
Rain gauge data Data set downscaling
(1961-1990) Evaluation • ∆t 5 min, 1km x 1km
• quality controlled • Dortmund, Duisburg, Bönen
• 28 stations • 1961-90
• 2021-50, 2071-100Bias correction and use of the daily sums Bias correction of daily sums: Piani et al. (2010) Used data: • area means on CLM grid points from radar (2001-2009) • CLM data from 2 runs As RCM values on single grid points are less reliable than averages over several grid points: • daily sums statistically averaged over 10 grid points using the cumulated PDF
Downscaling procedure: selection algorithm

For each day from CLM: search for similar days from the measurement
period. Criteria: daily sum (close interval around the given value) and
objective weather type
If no similar days are found: stepwise increase of the interval and
inclusion of neighboring weather types
Several days are found: random selection of one day

Increase of the data-base by:
Permitting spatial displacement of the radar data within the 10 grid
points of the research area
        making use of the similar precipitation characteristics within the research area
        disadvantage: neglect of small-scale orographic effects
Downscaling procedure
selection process
• performed for each catchment separately
Selection results checked on:
• Frequency of use of radar events (max. 3 times / 30 years)
• selection effect (Young 1994)
- Restrictive criteria in the selection process affecting the selection of extreme events
• discrepancies of the daily sum > 4mmDownscaling procedure
selection process
• performed for each catchment separately
Selection results checked on:
• Frequency of use of radar events (max. 3 times / 30 years)
• selection effect (Young 1994)
- Restrictive criteria in the selection process effecting the selection of extreme events
• discrepancies of the daily sum > 4mm
discrepancies of the daily sum > 4 mm: 2-4 events per 30-year period
modification of the radar event with a constant factor to catch
the 24h-sum of the model eventprocedure • High resolution radar data used to produce time series for the catchments (on each 1x1km² field) Time series evaluated using extreme value statistics • evaluation by duration and return period (following the DVWK rules for water management 124/1985) • Evaluation for the reference period, near and far future
Validation: Reference period

      Extreme precipitation (1h, 5a), comparison of station mean from
      28 stations and downscaling results in the reference period

    Extreme precipitation (1h,5a) within the catchments, catchment size is
    70-76 km²
Results: trend analysis
CLM 1 CLM 2
Extreme precipitation (1h, 5a) for reference period (1961-90), near future (2021-50)
and far future. The shaded uncertainty area is 10% (according to KOSTRA).
• CLM 1 shows significant positive trends (+18.8% / + 16.4%)
• CLM 2 trends are weaker and less significant (+16.4% / +8.8%)Summary and conclusion
• Generation of high resolution data with natural characteristics
on a sub-daily scale possible
• Data can be used as input to small-scale hydrological models
run-off model of Rossbach catchment near Dortmund:
reasonable results in comparison to observations
• Requirement: good measurement data base with the needed
spatial resolutionSummary and conclusion
Problems to overcome:
• Reliable Bias correction of the daily values
(with regard to the effect on climate trends)
• Ensemble evaluation
high effort because combination of climate model runs and
runs of the statistical downscaling model is necessary
considerable size of the produced data sets (high resolution)
• Uncertainties have to be communicated to the end-users, e.g.
general model uncertainties (statistical downscaling: do the
used relationships hold in the future)
uncertainty of extreme events
-> high uncertainty intervals in model and observationsReferences
Deutscher Verband für Wasserwirtschaft und Kulturbau e.V.
(1985): Niederschlag- Starkregenauswertung nach
Wiederkehrzeit und Dauer, DVWK Regeln zur Wasserwirtschaft
124/1985
DWD (2005): KOSTRA-DWD-2000, Starkniederschlagshöhen für
Deutschland (1951-2000), Grundlagenbericht. Offenbach am
Main.
hydro & meteo (2009): The SCOUT Documentation version 3.30.
Lübeck, 69 Seiten
Krahé, P., E. Nilson, U. Gelhardt und J. Lang (2010): Thank you for
Auswertungen ausgewählter globaler Klimamodelle hinsichtlich
atmosphärischer Zirkulationsbedingungen im Nordatlantisch-
Mitteleuropäischen Sektor. BfG-Bericht 1682.
your attention!
Piani, C., J.O. Haerter und E. Coppala (2010): Statistical bias
correction for daily precipitation in regional climate models over
Europe. Theor. Appl. Climatol. 99, 187-192.
Young, K. (1994): A multivariate chain model for simulating
climatic parameters from daily data, J. Appl. Meteorol., 33(6),
661-671.
Zorita, E. und H. von Storch,(1999): The analog method as a
simple statistical downscaling technique: Comparison with more
complicated methods, J. Clim., 12, 2474-2489Result
Preliminary result: hydrological run-off model Rossbach catchment
(Dortmund):
Reference period 1960-90:
Entwicklung der statistischen Abflussscheitel (T = 20 a)
an der Mündung Rossbach (PSe)
20
18
16
Abflussscheitel [m³/s]
14
12
10
8
6
4
2
0
1961-1990 2021-2050 2071-2100
Station/1,3 CLM1 CLM2Zusammenfassung und Ausblick
Das radarbasierte Downskaling zeigt, dass
- das Herunterbrechen von CLM-Daten auf eine in der Stadthydrologie nutzbare Auflösung
möglich ist
- die Daten etwa im Bereich > 30 Minuten oder seltener als 1x pro Jahr eingesetzt werden
können
- die Schwankungsbreite der Ergebnisse in der Statistik höher ist als zwischen Messstationen
- zusätzliche Analysen und Empfehlungen für den Einsatz der Daten erforderlich sindVielen Dank für Ihre Aufmerksamkeit ! Kontakt: Projektleiter Arbeitspaket AP 3.1: „Aufbereitung und Bereitstellung der Klimadaten für die Prognosemodelle“ Dr. Markus Quirmbach dr. papadakis GmbH Tel.: 02324/904489-1 Mail: m.quirmbach@drpapadakis.de
Downscaling procedure
Downscaling procedure
Downscaling procedure

                        Matched results, 2009
Downscaling procedure
Selection effect
• caused by close
criteria in the
selection process
• Result:
unrealistic low
extreme eventsYou can also read