Interactive 3D visual analysis in weather forecasting

Page created by Bradley Reynolds
 
CONTINUE READING
Interactive 3D visual analysis in weather forecasting
                                                                                                                Online | 4–8 May
Marc Rautenhaus(1), Tim Hewson(2), Kameswar Rao Modali(1), Andreas Beckert(1), Michael Kern(3)                        2020
(1) Regional Computing Centre, Universität Hamburg, Hamburg, Germany
(2) European Centre for Medium-Range Weather Forecasts, Reading, UK                                               © ‘Authors’
(3) Computer Graphics and Visualization Group, Technische Universität München, Munich, Germany
                                                                                                               All rights reserved.

       Bjerknes and Solberg (Geof. Publ. 1922)               Kern et al. (TVCG 2019)
                                                                                                      These slides won’t replace a real
                                                                                                 presentation but are aimed at providing an
                                                                                                    overview of our topic and to point to
                                                                                                   further resources. Some comments are
                                                                                                        provided in these blue boxes.

                                                                                                 About 100 years have passed between these
                                                                                                 two visualizations. Compare the conceptual
                                                                                                    drawing of a cyclone by Bjerknes and
                                                                                                  Solberg to our 3D interactive display of a
                                                                                                  frontal structure (here: Cyclone Vladiana,
                                                                                                      2016) generated from NWP data.

                                                                                                  Here we present parts of our work in 3D
                                                                                                   interactive visual analysis with methods
                                                                                                  potentially useful for weather forecasting.
Interactive 3D visual analysis in weather forecasting
“Visual displays provide the highest bandwidth channel from the
computer to the human” [.. and hence ..] “one of the greatest
benefits of data visualization is the sheer quantity of information
that can be rapidly interpreted if it is represented well.”

Ware (2013), “Information Visualization”

                                                           Why visualization…?
Interactive 3D visual analysis in weather forecasting
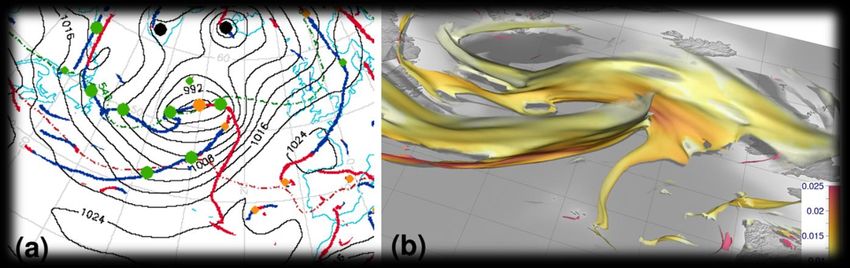
Visualization research covered topics relevant for meteorology

    State of the art: application domain vs. vis research

                                                    Rautenhaus, Böttinger et al. (2018)
                                                                                                                 Visualization research has in recent
                                                                                                                years covered many aspects that are
                                                                                                                 directly or potentially of interest to
                                                                                                                 meteorology. We have surveyed the
              https://ieeexplore.ieee.org/document/8126857/                                                      current state of the art in this 2018
                                                                                                                 article in the IEEE Transactions of
                                                                                                                Computer Graphics and Visualization.

         Online | 4–8 May 2020 – Interactive 3D visual analysis in weather forecasting (M. Rautenhaus et al.)
Interactive 3D visual analysis in weather forecasting
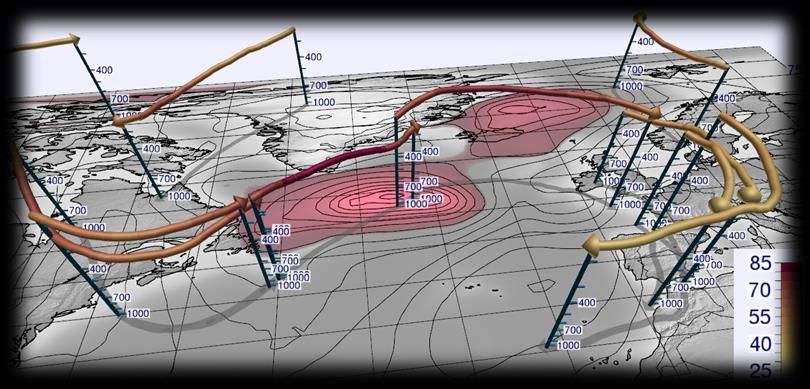
Met.3D: Ease transition by building a bridge from 2D to 3D
Do not replace
proven 2D
techniques but
put them into a
3D context and
use 3D elements
to add value.

Intuitive
interaction and
spatial perception
are key elements.

   Met.3D is our framework for interactive visual analysis of atmospheric simulation
   data. It has originally been developed (since 2012) for weather forecasting during
   aircraft-based field campaigns, but has become a general purpose analysis tool. It
      combines “traditional” 2D displays (including maps, vertical sections, Skew-T
        diagrams) with 3D elements and provides support for ensemble forecasts.
    Currently, we receive funding within the German Collaborative Research Centre                                        met3d.wavestoweather.de
               “Waves to Weather” for Met.3D research and development.

                      Online | 4–8 May 2020 – Interactive 3D visual analysis in weather forecasting (M. Rautenhaus et al.)
Interactive 3D visual analysis in weather forecasting
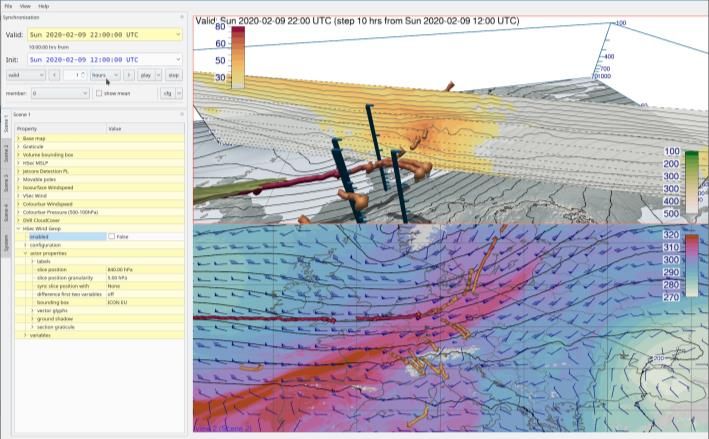
Detection and visual analysis of jet-stream core lines
Goal: extract visual abstraction for jet stream from NWP data that can be combined
with other visualization elements and be used to characterize uncertainty.

                                                                                                                                  https://ieeexplore.ieee.org/
                                                                                                                                  document/8017585/
Kern, Hewson, Sadlo, Westermann, Rautenhaus (2018)

                                                                                                              Within Waves to Weather, we have (and are continuing)
                                                                                                                  developed a number of visual analysis techniques for
                                                                                                                    atmospheric simulation data. One example is this
                                                                                                               detection and visualization technique for jet-stream core
                                                                                                                lines. Detection is based on the derivatives of the wind
                                                                                                              field to find the maximum lines (figures above). The core
                                                                                                                   lines can be plotted as spaghetti plots to illustrate
                                                                                                                  ensemble uncertainty (left images show an ECMWF
                                                                                                             ensemble forecast at analysis time and at 102 h lead time.

                Online | 4–8 May 2020 – Interactive 3D visual analysis in weather forecasting (M. Rautenhaus et al.)
Interactive 3D visual analysis in weather forecasting
Detection and visual analysis of frontal surfaces
Similar approach for 3D frontal surfaces, building on 2D detection by Hewson (1998). https://ieeexplore.ieee.org/
                                                                                                                                      document/8440076/

Kern, Hewson, Schäfler, Westermann, Rautenhaus (2019)

                                                                                                               Another example is a detection method for 3D frontal
                                                                                                                surfaces, based on the 2D detection method by Tim
                                                                                                                 Hewson (upper left image). The method analyses
                                                                                                            gradient zones in the wet-bulb potential temperature field
                                                                                                              (blue to warm shading in the vertical sections). Frontal
                                                                                                             features can be combined with the jet-stream core lines.

                 Online | 4–8 May 2020 – Interactive 3D visual analysis in weather forecasting (M. Rautenhaus et al.)
Interactive 3D visual analysis in weather forecasting
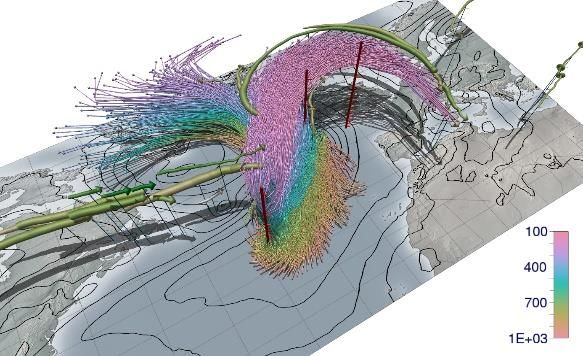
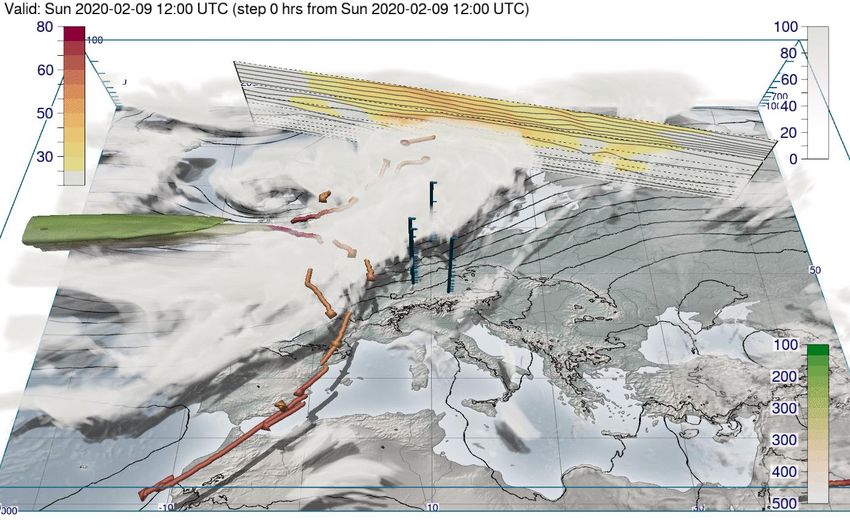
Example: Extra-tropical transition of Hurricane Lorenzo
Example visualizations showing aspects of Hurricane Lorenzo (2019). For further
details see https://www.ecmwf.int/en/newsletter/162/news/cyclone-workshop-
showcases-3d-visualisation.

                                                                                                            These images show examples of Met.3D being used to
                                                                                                          analyse an ECMWF forecast of Hurricane Lorenzo (early
                                                                                                        October 2019). We are analysing (left) the jet stream using
                                                                                                           the core lines and vertical sections showing wind speed,
                                                                                                        (middle) the structure of the dynamic tropopause using the
                                                                                                         2-PVU potential vorticity isosurface, and (right) the warm
                                                                                                           conveyor belt using trajectories filtered according to an
                                                                                                          ascent of more than 500 hPa in 48 h. Some more details
                                                                                                                   can be found at the link provided above.

            Online | 4–8 May 2020 – Interactive 3D visual analysis in weather forecasting (M. Rautenhaus et al.)
Interactive 3D visual analysis in weather forecasting
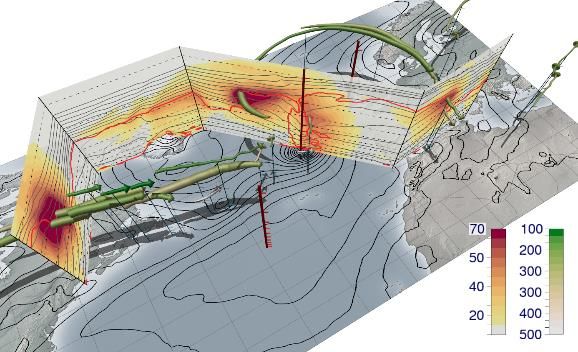
Example: Winter storm “Ciara”/“Sabine”
Winter storm “Sabine” (“Ciara”) hit Germany on 9/10 February 2020. It featured an
extremely strong jet stream – the green isosurface encloses wind speeds > 90m/s!
                                                                                            During the “real” EGU, I would have shown you some live demo of
                                                                                            the system. These are screenshots of an analysis of the ICON-EU
                                                                                            forecast provided openly by DWD at opendata.dwd.de. The left
                                                                                            image shows jet stream core lines, along with an isosurface of wind
                                                                                            speed and a volume rendering (white) of cloud cover. The vertical
                                                                                            section shows wind speed in m/s. In the bottom image, Met.3D is
                                                                                            used with a split screen also showing a map of equivalent potential
                                                                                            temperature.

            Online | 4–8 May 2020 – Interactive 3D visual analysis in weather forecasting (M. Rautenhaus et al.)
Interactive 3D visual analysis in weather forecasting
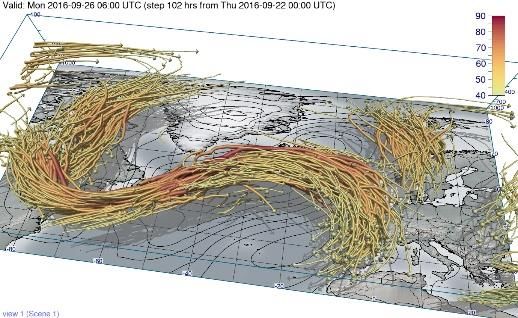
What’s next? Website with near-real-time products soon!
                                               We are in the process of setting up a website with near-real-time products
                                               (from open NWP data) similar to the visualizations of Lorenzo and Sabine
                                               shown in this presentation. It was supposed to be online by now, but due
                                               to Corona we’ll need a bit more time. We’ll announce the launch on the
                                               Met.3D website at met3d.wavestoweather.de. Or just send an email and
                                               we’ll let you know.

                                               Of course, the website will not have the level of interactivity that Met.3D
                                               provides on the desktop. However, we’ll provide configuration files so that
                                               if a situation is of interest you can download the NWP data and explore
                                               locally on your system.

                                               Thanks for your interest – please contact us with any questions,
                                               suggestions, feedback!
                                                                                                              Parts of the research leading to the
                                               met3d.wavestoweather.de                                        presented results has been done within the
                                                                                                              Transregional Collaborative Research
                                                                                                              Centre SFB / TRR 165 “Waves to Weather”
                                               marc.rautenhaus  uni-hamburg.de                            (www.wavestoweather.de) funded by the
                                                                                                              German Research Foundation (DFG). The
                                                                                                              presented visualizations are based on data
                                                                                                              courtesy of ECMWF and DWD.

       Online | 4–8 May 2020 – Interactive 3D visual analysis in weather forecasting (M. Rautenhaus et al.)
Interactive 3D visual analysis in weather forecasting
You can also read