Hydrological Study of August 2018 Kerala Floods using Remote Sensing, Modeling and Geospatial tools - Indian Institute of Remote Sensing Indian ...
←
→
Page content transcription
If your browser does not render page correctly, please read the page content below
Hydrological Study of August 2018 Kerala Floods
using Remote Sensing, Modeling and Geospatial tools

               Indian Institute of Remote Sensing
              Indian Space Research Organization
                       DoS, Govt. of India
                   4, Kalidas Road, Dehradun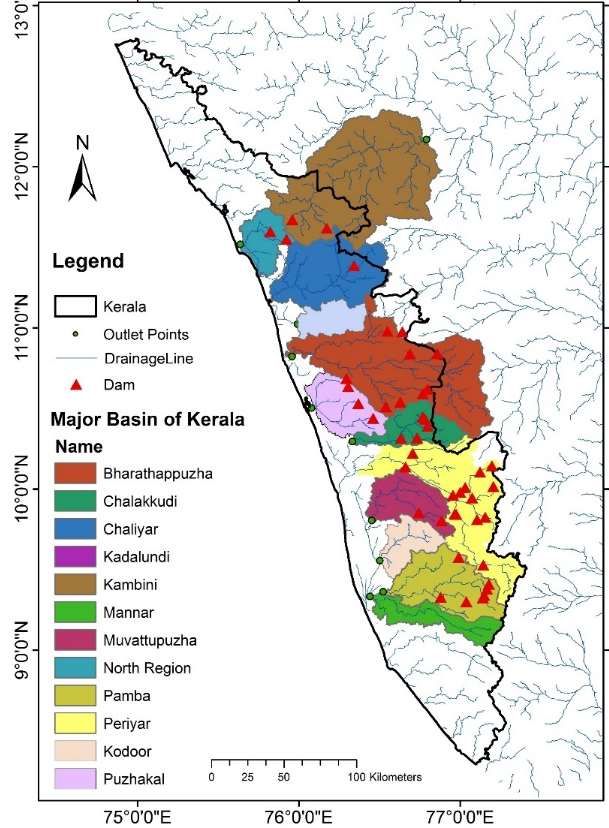
Background: August 2018 Heavy Rainfall & Floods in Kerala
                                         • Kerala received actual rainfall of 2394.1 mm from June 1 to
                                           Aug 22, 2018, which exceeds normal rainfall of 1701.4 mm
                                           by 41 % (IMD). Rainfall products of IMD-GPM at 0.25
                                           degree area shown in figures.
                                         • Idukki district received highest rainfall of 3555.5 mm
                                           during same time, with two major spells of rainfall during
                                           Aug 07-10 and Aug 14-18, 2018.
                                         • Heavy rainfall resulted in high surface runoff in major river
                                           basins of Kerala, filling of all dams and subsequent opening
                                           of these dams, caused widespread flooding in downstream
                                           areas, low lying areas near coast and backwaters of Kerala.

Spatial distribution of rainfall over Kerala from GPM rainfall products of 0.1 deg. resolution   Source: Internet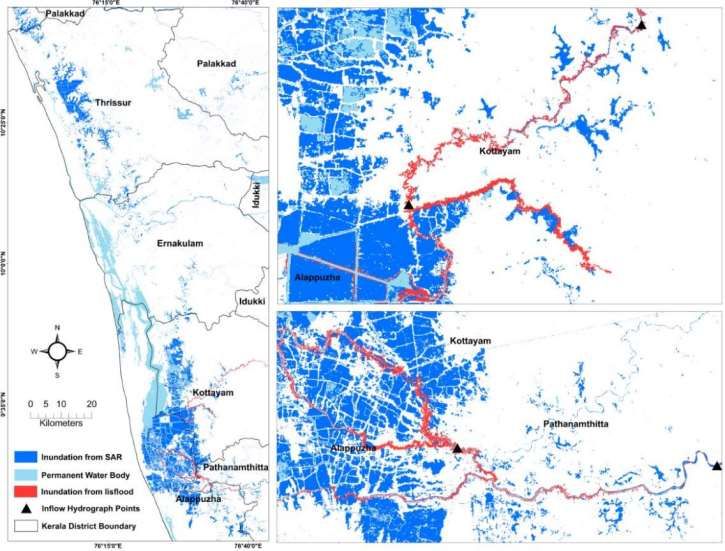
Physical characteristics of Kerala and surrounding states

• Kerala has a total geographical area of 38863 km2, with a North-South orientation and
  elongated Shape. It has approximate length of 561 km and very short width of approximately
  100 km, which gives a short time of travel for water to reach downstream areas from its
  farthest point at ridgeline
• The elevation ranges from -48 m below sea level to +2692 m above mean sea level, with 35 %
  area between 0-50 m, 39.82 % are between 50-500 m and 24 % of area above 500m
• Slope ranges from near flat area near coast to steep slopes at ridge line of watersheds
• The Major aspect of all sub-basins of Kerala is in South and South West direction
2005 LULC map from ISRO-GBP project   Soil texture map from NBSSLUP        CN grid map

• The major Land Use and Land Cover (LULC) in Kerala is Plantation (22255 km2 58.23 %),
  Deciduous       and     Evergreen      Broad     Leaf      Forest     (7849    km2,      20.5%),
  Cropland/Shrubland/Grassland (4307 km2, 11.27 %) and Waterbody/Urban/Others (3806.5
  km2, 9.95%)
• The major soil type of Kerala are Clay/Clay skeletal (31963 km2, 83.83%), Loamy/Loamy
  skeletal (5339.20 km2, 14%), small fractions of soil sandy. This high area under clayey soils
  can result in high runoff potential during heavy rainfall in all major catchments of state.
• The NRCS Curve Number (CN) ranges from 52 to 100 for this area, with area under CN 52-64
  as (0.46 %), 65-74 as (23.02 %), 75-85 as (65.98 %) and > 85 as (6.8%)
Hydrological characteristics of Kerala and surrounding states
                                                                                 Total
                                                                         Area             No. of sub- Mean Tc    No of major
                                                S. No   Basin name          2  Drainage*
                                                                         (km )           watersheds* (hours)** dams/reservoirs
                                                                                 (km)
                                                  1        Periyar      4276.91    527.16     47         6.92         12
                                                  2        Pamba         2486.7    320.37     17        12.14         4
                                                  3      North Region    1008.4    114.73     11        11.21         2
                                                  4     Muvattupuzha     1560.7    196.15     15        13.35         2
                                                  5        Mannar         1234     155.83      7        20.48         0
                                                  6        Kambini        6853     834.87     89         9.75         5
                                                  7       Kadalundi      886.79     109.5      8        14.54         0
                                                  8        Chaliyar     2915.73    329.93     37         7.16         1
                                                  9       Chalakudy     1309.84    187.04     15         5.94         4
                                                 10     Bharathapuzha   5884.24    782.92     73         9.88         6
                                                 11        Kodoor       1045.28    107.15     14        10.69          0
                                                 12       Puzhakal      1523.473    176.7     19         12.4          3

                                                *The watersheds are delineated using SRTM-30 m DEM, and
                                                minimum watershed area threshold for defining a stream is
                                                given as 50 km2. The derived drainages and number of sub-
                                                watersheds are based on this threshold. The total drainage
                                                length and number of sub-watershed will increase if we
                                                decrease this threshold.
                                            ** The Time of concentration is calculated for each sub-
                                                                                      2
The major flood affected rivers basins were watershed of each river basin with 50 km area threshold
                                            and TR-55 method. The actual time of travel for entire basin
Periyaar, Kambini, Puzhakal, Pamba, Kodoor.
                                            will be higher than the mean Tc.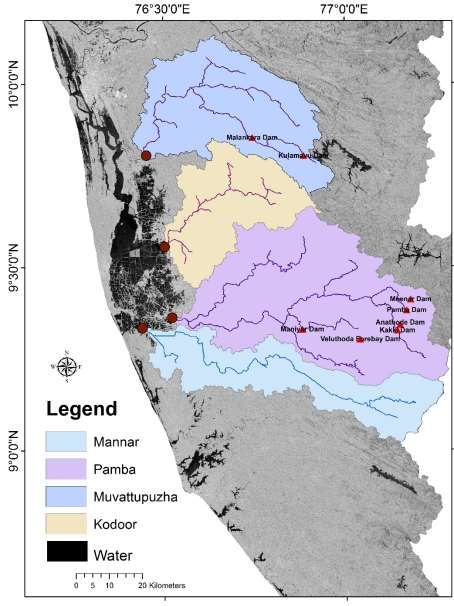
Hydrological modelling (1-23 August 2018) using HEC-HMS
•    All 12 major flood affected river basins are studies for detailed basin wise DEM based hydro data
     processing and virgin hydrological simulations using Hydrological Modelling System (HMS)
•    IMD-GPM gridded data used as input met data, SCS method for loss, and SCS unit hydrograph as runoff
     transformation, Muskingum-Cunge as routing & constant monthly baseflow, in all basins simulations

                             a) Periyaar                                            The detailed hydrological
                             River Basin                                            modelling was done for
                                                                                    Periyaar basin with outlet
                                                                                    at Alluva Manappuram Rail
                                                                                    Bridge, Periyaar Nagar using
                                                                                    HEC-HMS model.

                                                   •   Basin has 47 sub-watersheds, with total area of 4276.9
                                                       km2 and 527.16 km of drainages.
                                                   •   Rainfall data from IMD product at 0.25 degree was used
                                                       for simulating the river flows. Rainfall at various sub-
                                                       watersheds and simulated river flood flow hydrographs
                                                       are shown in figures. Two flood peaks are seen on 10
                                                       and 16 August 2018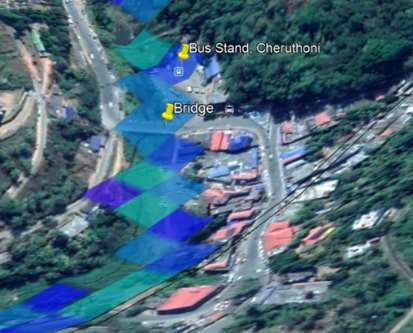
Hydrological modelling for estimating potential flood flow
 hydrographs (1-23 August 2018) in major rivers of Kerala

Pamba, Mannar, Muvattupuzha and Kodoor
were the major river basins responsible for
heavy rainfall induced flood at Kottayam,
Alappuzha, Ernakulam and Pathanamthitta
districts.
Hydrological modelling for estimating potential flood flow
 hydrographs (1-23 August 2018) in major rivers of Kerala
Hydrological modelling for estimating potential flood flow
   hydrographs (1-23 August 2018) in major rivers of Kerala
The Northern Kerala river basins such Kambini and Puzhakal also received heavy rainfall during
7-10 and 14-18 Aug. 2018, which resulted in many landslides in upper catchments of Kerala and
Karnataka, flooding along river and major flood inundation in Wayanaad and Thrisoor areas
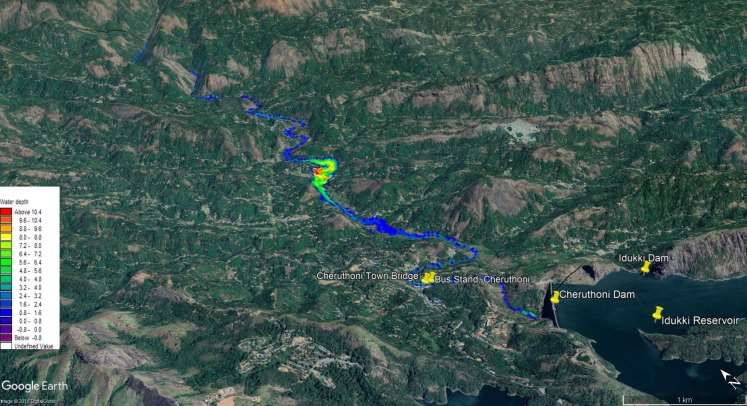
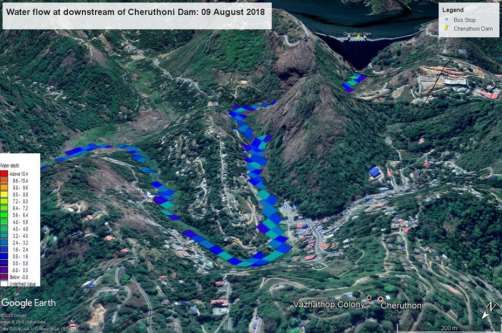
Flood inundation mapping using hydrodynamic modelling –
                    MIKE 11 HD model
                                             • Hydrodynamic
   Change the text colour in figs and          model      was
   Show inundation in all maps, in 3D          established for
   If possible                                 a Periyar river
                                               reach of 17.5
                                               Km         with
                                               upstream end
                                               at Cheruthoni
                                               dam       using
                                               MIKE 11

                                             • Simulation was
                                               carried out in
                                               steady     state
                                               condition for
                                               discharge     of
Fig. 7 shows the flood inundation              770      cumec
at downstream area of Cheruthoni               generated
dam.                                           after opening
                                               of 05 gates of
                                               the dam
Flood inundation d/s of Cheruthoni dam as simulated using MIKE 11
During Flood
After Flood
Source:http://www.newindianexpress.com/states/kerala/2018/aug/11/kerala-floods-53500- Source:https://www.mathrubhumi.com/environment/specials/kerala-
people-in-relief-camps-water-level-at-idukki-dam-recedes-1856128.html floods-2018/news/post-flood-cheruthoni-bus-stand-1.3109085Flood inundation mapping using remote sensing data
Aug 09, 2018, Sentinel-1 Aug 21, 2018, Sentinel-1 Aug 22, 2018, Sentinel-2
Inundation Area: 702 km2 Inundation Area: 905 km2 Inundation Area: 379 km2
District Flood inundation Aug 21 2018 (km2) • Flood inundation maps from Sentinel-1, 2 data
Alappuzha 272 using Google Earth Engine & GIS tools
Kottayam 136 • Pre flood water body maps generated using
Patahanamthitta 48
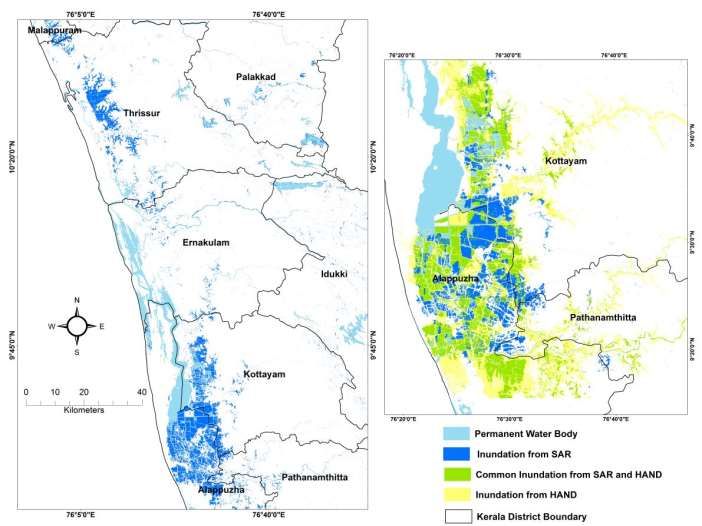
Sentinel-2 data(2017-18) in Google Earth EngineFlood inundation mapping using topography based index
HAND (Height Above Nearest Drainage)
Attempt has been made
to capture probable
flood inundation areas
using topography based
flood inundation tool
HAND (Height Above
Nearest Drainage tool)
Thresholding (ranging
between 0 to 12 m) was
given with respect to
Kodoor and Pamba
basins topography,
results showed good
match at middle and
downstream area of the
21 Aug. 2018 respective basins, while
over/under estimated
The flood inundation from HAND tool can be improved by better DEM for some parts of the
and multiple/variable thresholds for various streams. The SAR data upstream/other/lower
Based flood gives low flooded area as it is taken 3 days after peak flood basin areas.Flood inundation mapping using 2-D open source
hydrodynamic (HD) modelling – Lissflood
Application of 2D
hydrodynamic model
Lissflood has been
tested to simulate
flood inundation.
Flood Hydrographs
from using HEC-HMS
were used as
boundary conditions.
It was found that
model was able
simulate flood
inundation in main
river reach, but has
limited its application
in low lying flat area.
More dense stream network, calibrated or actual inflow flood hydrographs and high
resolution DEM needed for better flood inundation using 2-D flood modelsYou can also read