Plasma Interactions Revealed by Jupiter Low Frequency Emission - Francisco Reyes Research collaboration with Chuck Higgins
←
→
Page content transcription
If your browser does not render page correctly, please read the page content below
Plasma Interactions Revealed by
Jupiter Low Frequency Emission
               Francisco Reyes
     Research collaboration with Chuck Higgins
    (MTSU), Kazumasa Imai (Japan), Jim Thieman
   (GSFC), Leonard Garcia (GSFC) and Tom Carr(UF
              Prof. emeritus, deceased)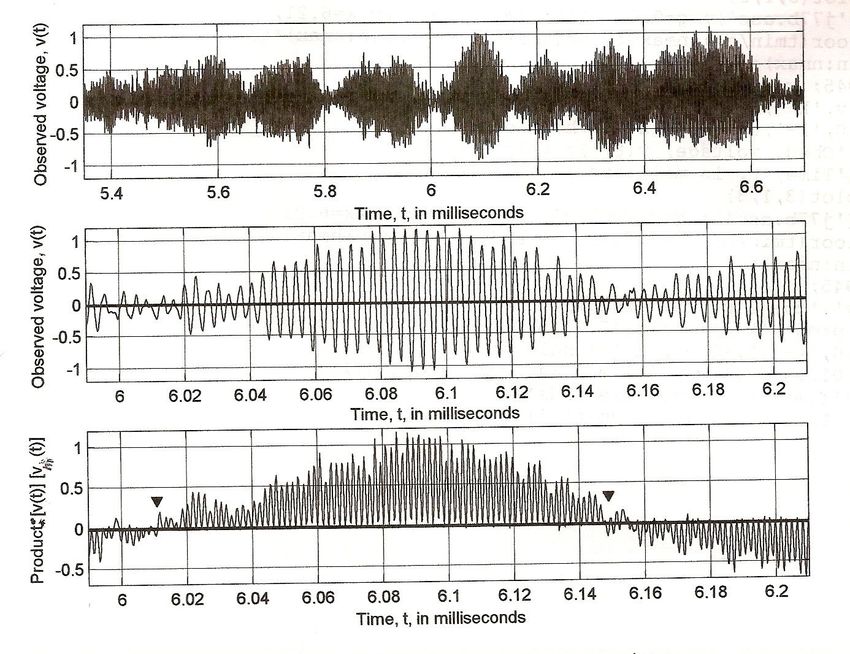
Some basics about solar system
    planets low frequency radio emission
•   All the Jovian planets and the Earth emit low frequency radio emission, in
    the range of a few kHz to around 1 MHz, except for Jupiter
•   The emission originates in the interaction between the planet magnetic
    field and plasma. Some of the emission at the higher frequency has been
    attributed to the Maser Cyclotron Instability mechanism
•   Jupiter has the strongest magnetic field of all the planets (about 14 Gauss,
    northern hemisphere). It is the planet that emits at the highest frequency
    (39.5 MHz)
•   A large portion of Jupiter emission is above the terrestrial ionosphere cut
    off and can be observed from ground based stations
•   Observed from space by Voyager, Galileo, Ulysses, Cassini and soon by
    Juno (July 2016)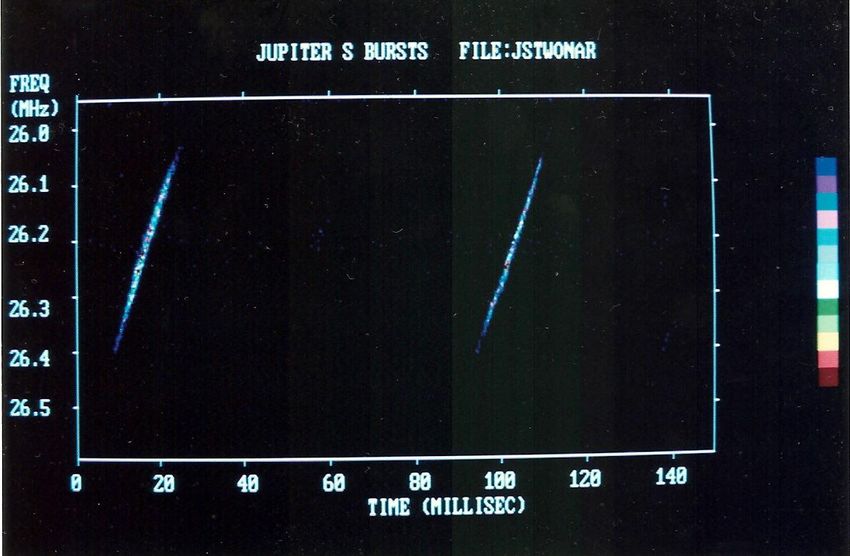
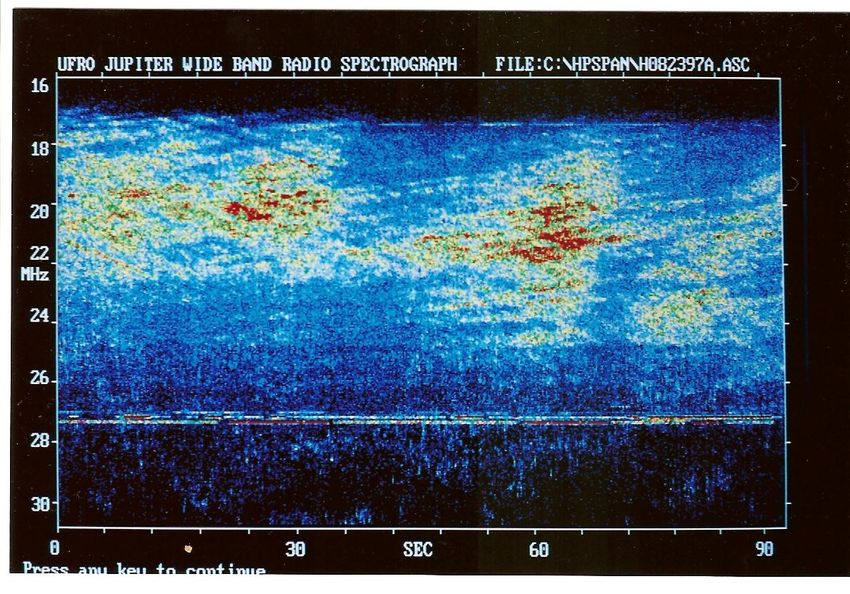
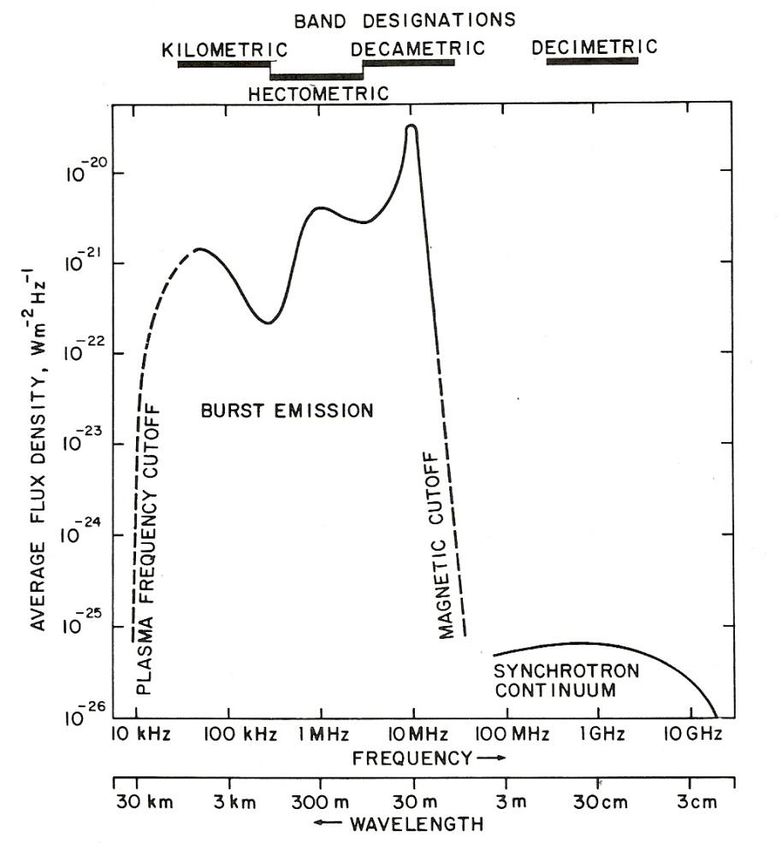
Low frequency radio spectra of the Jovian planets, the
                 Sun and the Earth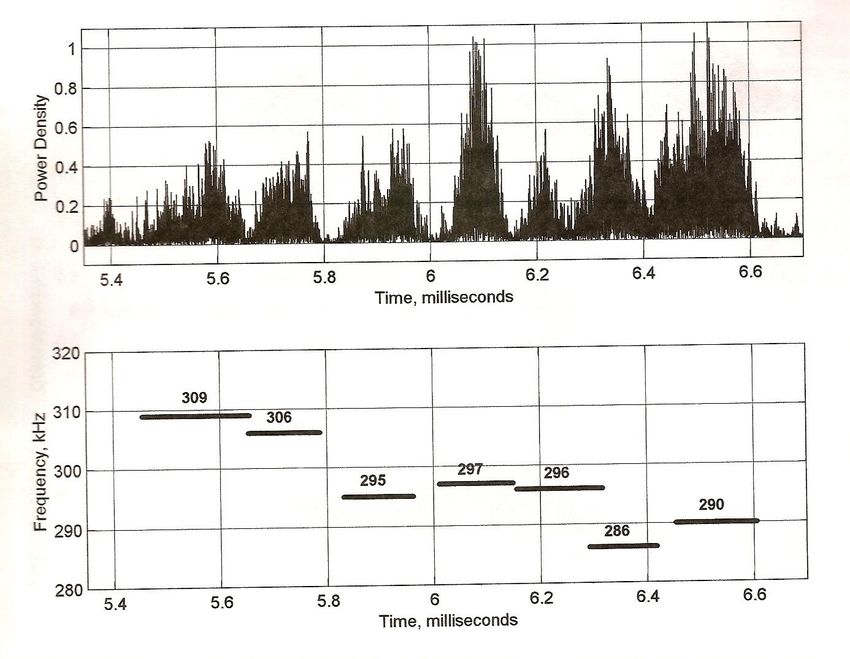
Some important characteristic of Jupiter
     decametric radio emission ( ~3-40 MHz)
• Emission is mainly in the form of L (Long) bursts, S (Short)
  bursts and N (narrow band) events.
• The emission is sporadic but the probabilities of receiving the
  emission are correlated with the values of CML and Io-phase
• When the occurrence probability is plotted in the CML and Io-
  Phase plane, the regions of emission clusters in “sources”
  called Io-A, Io-B, Io-C and non Io-related sources.
• Emission mechanism is the Cyclotron Maser instability

   CML- Central Meridian Longitude
   Ocurrence probablity (OP) = emission time/observed time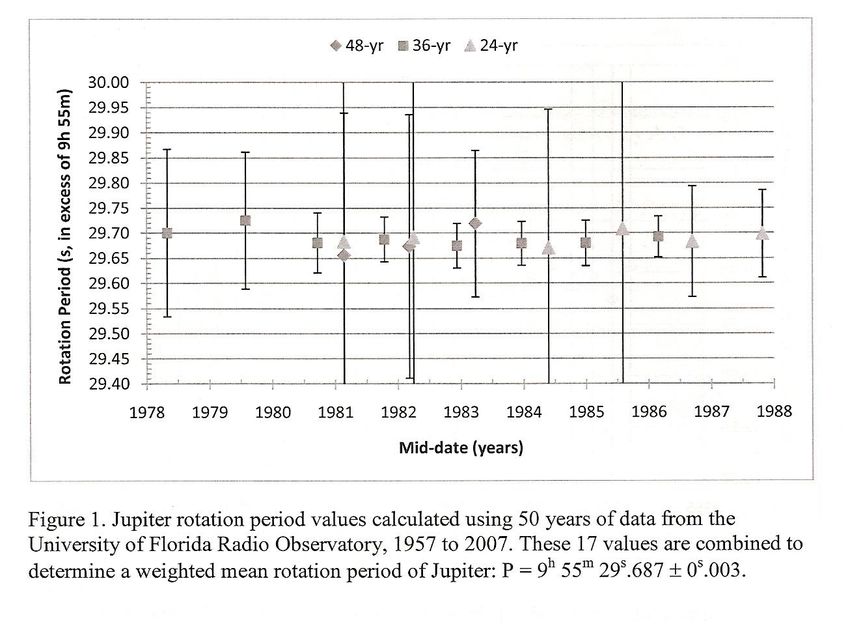
The CML and Io-Phase plane and the location of the sources
              (CML= Central Meridian Longitude)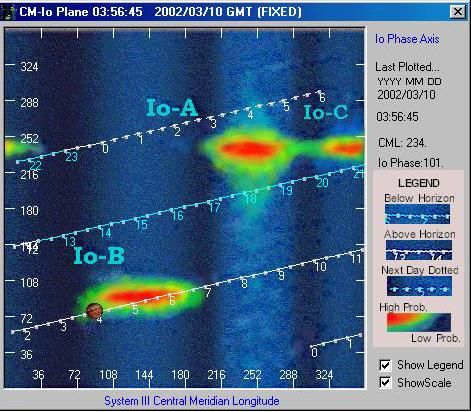
Important milestones in Jupiter radio
                emission
• Discovered by Burke and Franklin in 1955 at 22.2
  MHz (DAM)
• DAM emission controlled by Io discovered by Bigg in
  1964
• Discovery of the synchrotron emission (DIM) in 1958
• High frequency cut off of the DAM emission is
  around 40 MHz
    DAM= Decametric radio emission (3-40 MHz)
    DIM=Decimetric radio emission (70 MHz- 300 GHz)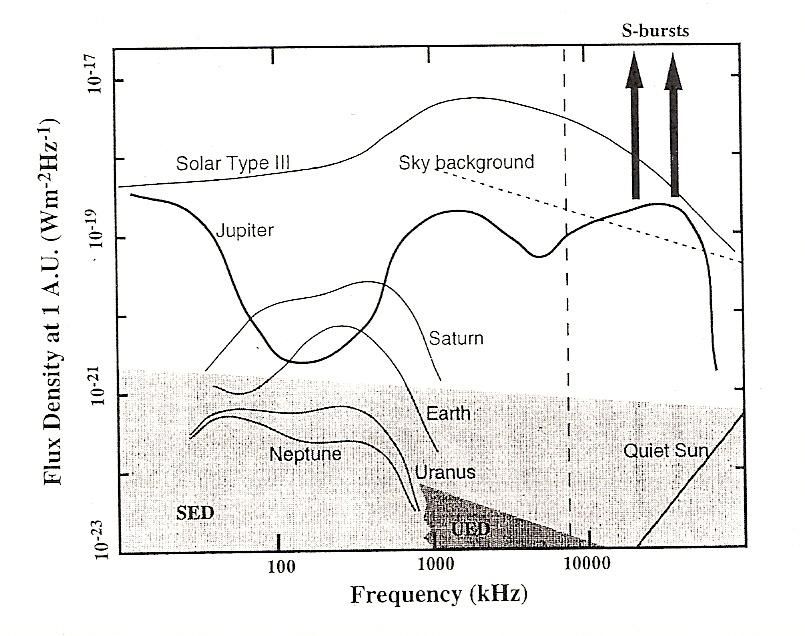
Jupiter decametric radio emission spectra
Some contributions to the research of the DAM
            emission by UF researchers
•   De effect in the emission. 12 year periodic modulation in intensity and
    longitude of sources, mainly the non-Io A source (T. Carr, Garcia)
•   Size of the sources using VLBI (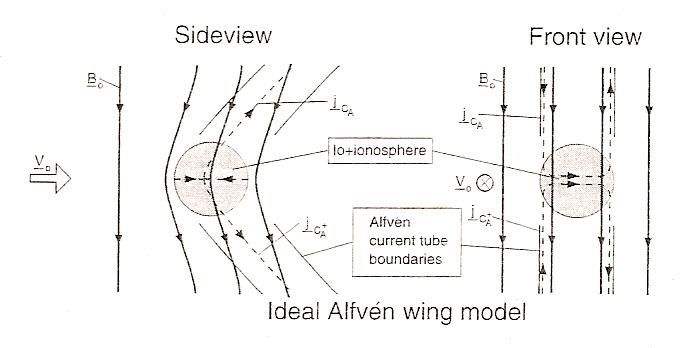
How the emission is produced and the influence of Io in
             accelerating the electrons
                      Alfven wave velocity= B/(μρ)½

•Emission is produced by the electrons present in the Io torus and accelerated
by Io
•The electrons spiral toward the planet.
•Depending on the pitch angle, some are lost in the upper atmosphere
creating a hot spot. Some are reflected before they hit the atmosphere
•The population of electrons reflected have a lost cone distribution and are
responsible for the emission
•The emission is beamed in a hollow cone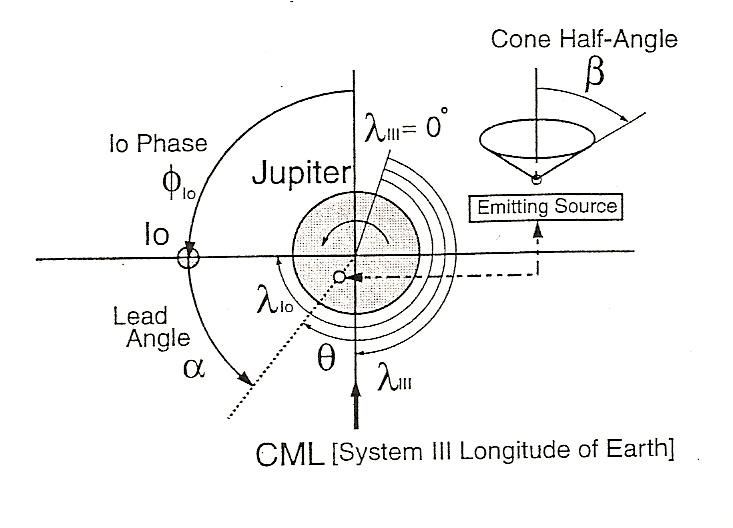
Some active projects using the UFRO (Univ.
         Florida Radio Observatory) data
•   Catalog of S-bursts. Statistic of drift rates and repetition period
•   Computation of radio rotational period. At the present there are two
    methods, direct observation of magnetic field (data from spacecraft) or
    using the decametric emission
•   Analysis of the microstructure of S-bursts. It requires high S/N ratio and
    high speed A/D converter
•   Determination of the source location and size using the modulation lanes
    method
•   The influence of De in the OP and the location of the Non-Io-A related
    source and a model to explain the effect
Interesting past project
•   Search for emission from the collision of comet S-L 9
Computation of the radio rotational period
Generate the OP histograms for two epochs separated by 12 years to avoid
the De effect
Cross correlation of the OP histograms at 18, 20, 22 MHzComputation of radio rotational period
Values obtained using UFRO data from 1957 to 1993 at 18, 20, 22
MHz
Pc = (360Po x delta t)/(360 x delta t-Po x delta λ)
Pc =corrected period
Po =assumed rotational period
delta λ= drift of feature or source
delta t= time interval for the driftComparison of published rotational period (UFRO data
1957-1993) and System III period (1965)
System III (1965) period= 9h 55m 29.71s
Rotational period (1957-1993) = 9h 55m 29.685s ± 0.0034sNew value of radio rotational period using 50 years of
UFRO data from 1957 to 2007 at 18, 20, 22 MHz
(Publication in preparation)
Rotational Period (1957-2007 data)= 9h 55m 29.687s ± 0.003 sAnalysis of the microstructure of S-bursts
• Cyclotron Maser mechanism
• Cyclotron emission : f = 2.8 B
f= frequency in MHz B= Magnetic field strenght in Gauss
• S-bursts have a negative frequency drift rate
They sweep from high to low frequencies. This is interpreted has a drift of
the electrons along magnetic filed lines, moving away from the planet
• Most S-burst can have a complex structure
• Only simple S burst is easier to analyzeAn example of simple narrow band S-burst Data taken with the UFRO 640 dipoles array at 26. 3 MHz
Analysis of S-bursts micro structure
Results of processing an S-burst to determine the frequency,
          phase and duration of the microstructure
    (Typical duration is around 100-120 microseconds)
Some results from the analysis of S-bursts • The period of coherence of the micro structure last for most of the duration of the microburst • Duration of an active individual maser is about 100 microsecond • Once an individual maser extinguish, another is activated at a slighter shorter distance (weaker magnetic field) away from the planet • For an S-burst with a freq. drift rate of 30 MHz/sec around 26 MHz, the velocity parallel to B is about 25,000 km/sec and the energy 4.3 keV
Modulation lanes
                     An example
(Data taken with the UFRO 16 element conical log spiral (TP) array)
Modulation lanes A model for the production of the modulation lanes and a method to determine the size and location of the radio source
Geometry of the parameters for the Io-B source
   in a section through the Jovian equator
  Lead angle α = angle between the longitude of the source ahead of the longitude of Io
 Cone half angle β = angle between the tangent to the magnetic field and the direction of
                                      propagation
Some results from the analysis of modulation
lanes
• Lead angle α around 50 degrees
• Cone half angle β around 60 degrees
• Estimated size of the source parallel to the direction
of the magnetic field ~70 km or lessThe De effect in Non Io-A source
(L. Garcia dissertation, 1996)The Radio JOVE educational and public
outreach program
• Created to engage high school and college students and the general public
in low frequency radio astronomy
• The low frequency emission from the Sun, Jupiter and the galactic
background can be observed with the RJ system
• Project started as collaboration between people at UF, NASA GSFC, FSGC
and others
• Web site: http://radiojove.gsfc.nasa.gov
• All these emissions are strong and can be detected by a simple antenna
(one or two dipoles)
• The cost of the kit which include the receiver and antenna is about $200
• The receiver and antenna are designed to work at 20.1 MHz
• About 1,500 kits sold in the USA and several other countriesYou can also read