CLEAN ENERGY TRANSITION IN THE TRANSPORT SECTOR - Glynda Bathan Deputy Executive Director Clean Air Asia - Pubdocs.worldbank.org.
←
→
Page content transcription
If your browser does not render page correctly, please read the page content below
CLEAN ENERGY TRANSITION
IN THE TRANSPORT SECTOR

Glynda Bathan
Deputy Executive Director
Clean Air Asia
Barriers clean energy transition in
transport
• Lack of ambition in setting mitigation goals for the
  transport sector in NDCs (i.e. they are not sufficient to
  bring the sector’s CO2 emissions in line with the 2
  degree scenario)
    •

• Limited uptake of policies that favor energy efficient
  modes of transport (e.g. vehicle fuel economy
  policies, support and incentives for electric vehicles)
  but with a few countries starting to put policies in
  place

• Emissions increased 2.5% annually between 2010-
  2015
2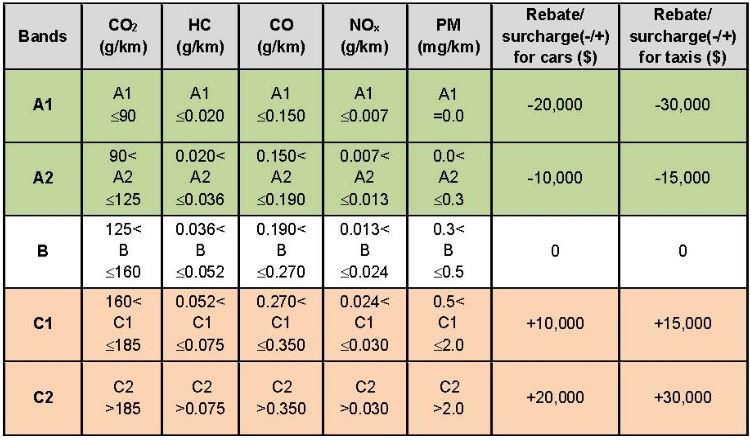
Increasing CO2 emissions from transport

CarsMotor vehicles
     a growing     ~ 1 billion
                reality        today…
                        in emerging and developing markets…
    over 2.5 billion by 2050
    Number of vehicles * 1000

                           • 90%+ of growth in developing, emerging economies
                           • Opportunity for energy efficiency, green economy innovation

                                                                                           Source: IEA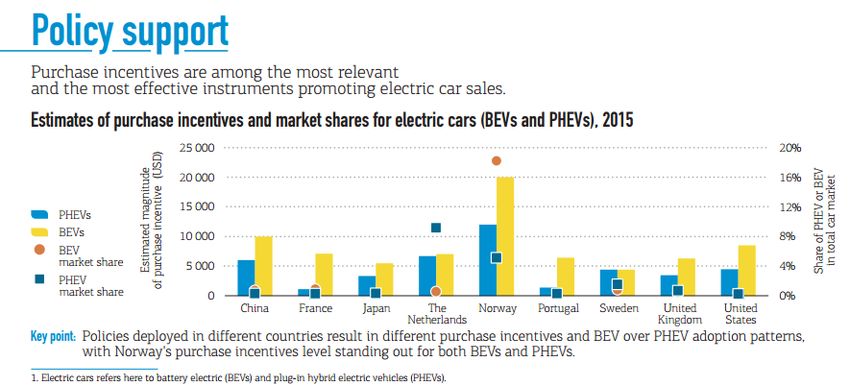
Half a billion vehicles in ASEAN in 2050

                                  Source: ITPS and CAA, 2014
5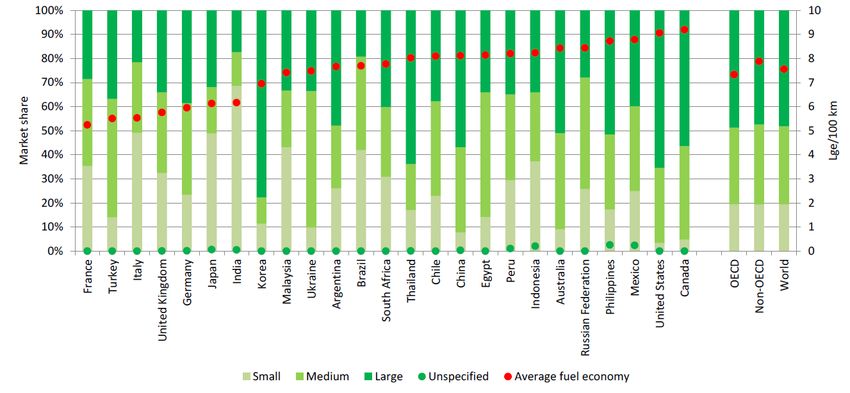
Doubling the efficiency
  of the global car fleet by 2050

• Slowing improvement in OECD countries
• Increasing improvement in non-OECD but not enough
• Still far from meeting the GFEI target
                                                      Source: IEA/ GFEI, 2017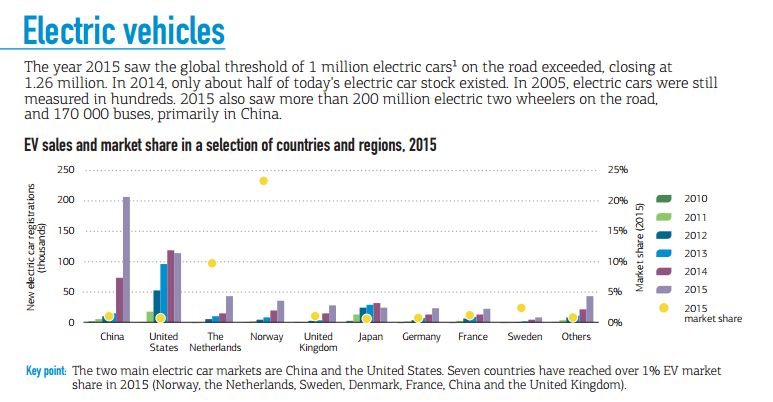
Average fuel economy in new cars in
ASEAN is relatively high
New cars by size by country in 2015

                                      Source: IEA/ GFEI, 2017. Working Paper 15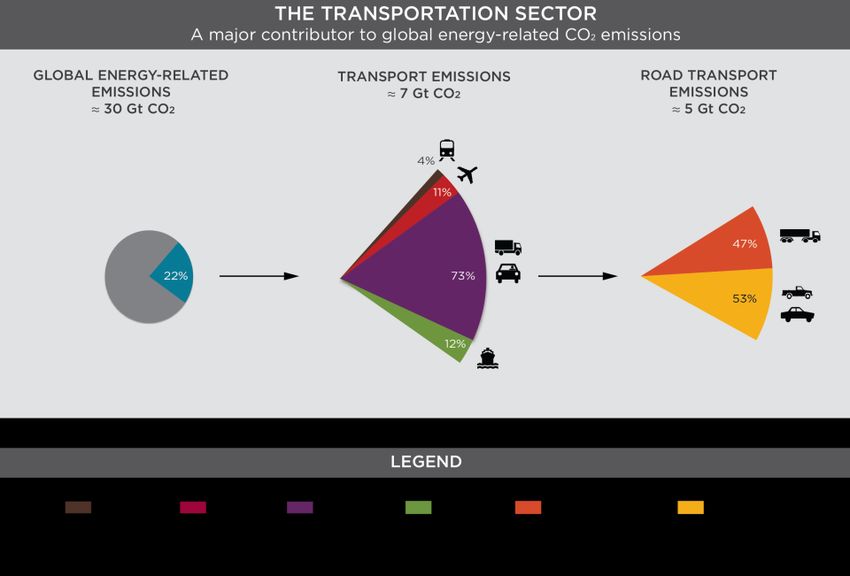
Fuel economy policies & instruments

                                           Target group:
                                           Consumer

                              Consumer
       Monetary              information
          Fiscal               Labelling
       instruments
                     FE
                   Regulatory
                 Fuel economy or
                  CO2 emission
                    standards              Manufacturer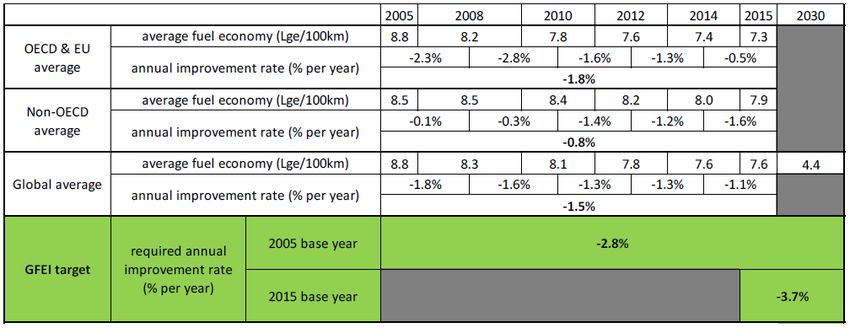
Fuel economy policies work

                                                                         Baseline Light-Duty Vehicle Fuel Economy and Trends for New LDVs                        Algeria

                                                                    14                                                                                           Bahrain
                                                                                                                                                                 Chile
Liters per 100 kilometers (L/100km) normalized to NEDC Test Cycle

                                                                                                                                                                 China

                                                                    12                                                                                           Costa Rica
                                                                                                                                                                 Cote d'Ivoire
                                                                                                                                                                 Egypt

                                                                    10                                                                                           Ethiopia
                                                                                                                                                                 EU
                                                                                                                                                                 Georgia
                                                                     8                                                                                           Indonesia
                                                                                                                                                                 Japan
                                                                                                                                                                 Kenya
                                                                     6                                                                                           Mauritius
                                                                                                                                                                 Montenegro
                                                                                                                                                                 Morocco
                                                                     4                                                                                           Peru
                                                                                                                                                                 Philippines
                                                                                                                                                                 Sri Lanka
                                                                     2                                                                                           Tunisia
                                                                                                                                                                 Uganda
                                                                                                                                                                 Uruguay
                                                                     0                                                                                           US
                                                                         2005   2007   2009   2011   2013   2015   2017   2019   2021   2023     2025
                                                                                                                                          Source: UNEP, 2017 (unpublished).
                                                                    11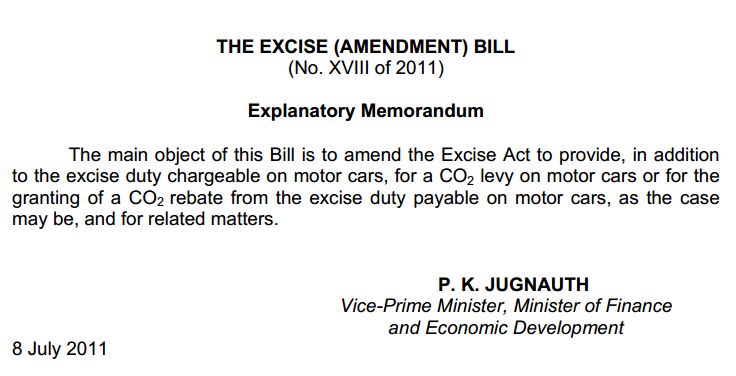
Hybrid and Electric cars in Sri Lanka
• Hybrid and electric cars in 2014 was 56% of the total number of cars
• Hybrid-petrol, petrol and diesel vehicles attract 58%, 253% and 345%,
  respectively, in excise tax
• Fully electric vehicles are levied at 25%.

12
CO2-based Feebate Scheme in Mauritius
• Feebate scheme in 2011 = fee on cars above 158 CO2g/km starting
  from 55$ per g/km to 137$ per g/km for cars over 290 CO2 g/km
  and a rebate starting from 27$ per g/km for cars with CO2 ratings
  from 91 to 158 CO2g/km and 82$ for cars from 90 CO2g/km and
  below

• From 7l/100km in 2005 to
  5.8l/100km in 2014 and rapid
  increase of new hybrid vehicle
  sales from 337 in 2011 to 1418
  in 2013

14
Direct Fuel Economy Policies in
ASEAN Member Countries

15
Feebate Scheme in Singapore
National Environment Agency to introduce the Vehicular Emissions
Scheme (VES) to replace the Carbon Emissions-Based Vehicle Scheme
(CEVS) for all new cars, taxis and newly imported used cars with effect
from 1 January 2018
Source: Singapore Land Transport Authority, 2017
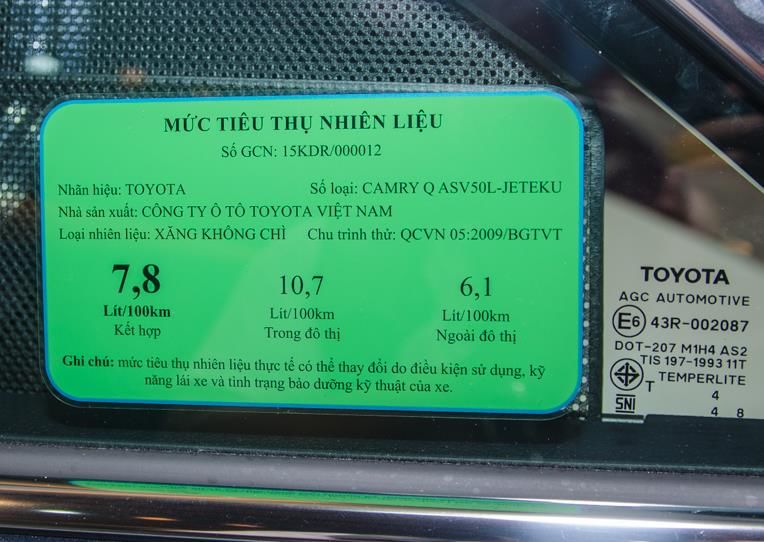
16Vehicle Labeling in Viet Nam • Seven-seater cars and smaller ones are required to carry energy rating labels • Labeling for those with more than seven seats to nine seats will be voluntary until December 31, 2017 and for motorcycles until December 31, 2019 and required on cars from January 1, 2018 and motorcycles from January 1, 2020 17
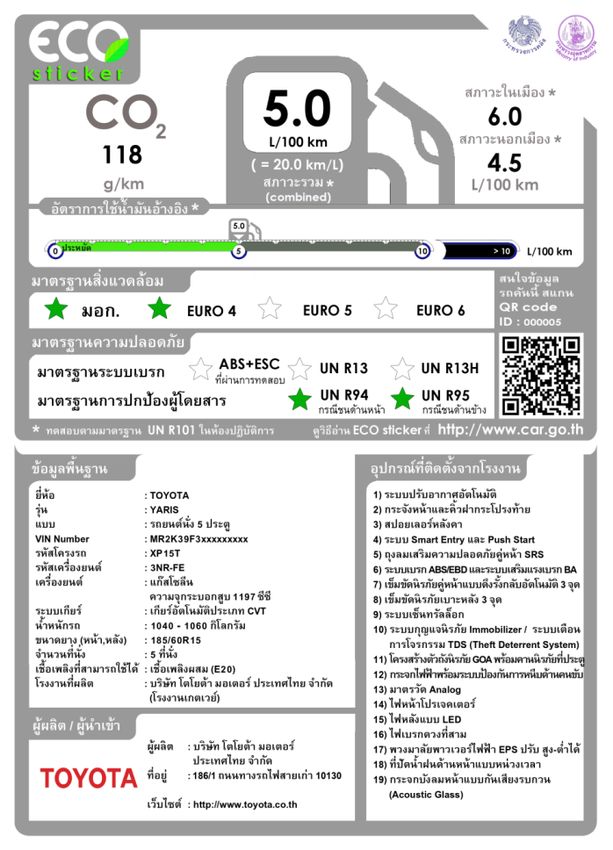
Labeling and CO2-based Tax in Thailand
• Vehicle excise tax rates   Types of Vehicles                         Fuel type / Tax rates

  in Thailand combines                           CO2/ engine           E10/        E85/          Hybrid
                                                 capacity              E20         NGV
  CO2 ratings and engine
                             Passenger           ≤ 100 g/km            30          25            10
  capacity                   vehicles – cars                                                     20
                                                 101-150               30          25
• Mandatory eco-sticker      and vans with       g/km
                             less than 10
                             seats               151-200               35          30            25
                                                 g/km
                                                 >200 g/km             40          35            30

                                                 >3,000 cc             50          50            50

                             ~~~~~~
                             Electric            ≤ 3,000 cc                             10
                             vehicle/ fuel       (180 Kw)
                             cell                > 3,000 cc                             50
                                                 (180 Kw)

                                                   Source: Energy Policy and Planning Office and Department of
18                                                                       Alternative Energy Development, 2015
Electric vehicles 19
But, comprises low market share globally (electric cars = about 0.2% of global
car stock)

                                                                    Source: OECD/IEA. 2016
• Support for charging infrastructure
• Fiscal advantages for EVs, tightened fuel economy standards,
measures that give preference to low emissions vehicles (e.g., zero
emission zones in cities, access to high occupancy lanes, parking
privileges)
• Fuel taxes that make conventional fuels more expensive
Source: OECD/IEA. 2016Summary • Governments need to raise ambition levels in NDCs to bring the transport sector back on track with the 2 degree scenario • Implement fuel economy policies to substantially reduce CO2 emissions from light duty vehicles but also for the under-regulated yet high-emitting transport sectors such as heavy-duty freight trucks • Electric mobility initiatives in Asia should focus on modes which are already less energy intensive (e.g. electric buses), taking care not to contribute to congestion, and more importantly using power from clean energy sources • With these measures, we also reduce fossil fuel consumption and national expenditures on fossil fuels and improve air quality and quality of life 22
For more  information:
                    For more information: www.cleanairasia.org
                                          www.cleanairasia.org

Clean Air Asia China Office            Clean Air Asia Center                 Clean Air Asia India Office
     china@cleanairasia.org                center@cleanairasia.org               india@cleanairasia.org
    901A Reignwood Building,         Unit 3505 Robinsons Equitable Tower         1st Floor, Building No. 4
       No. 8 YongAnDongLi                   ADB Avenue, Pasig City         Thyagraj Nagar Market, Lodhi Colony
 Jianguomenwai Avenue Beijing                 Metro Manila 1605                        New Delhi 110003
              China                              Philippines                                  India

                                    Clean Air Asia Country Networks
                                .      .       .          .            .    .
                      Indonesia Malaysia Nepal Pakistan Philippines Sri Lanka Vietnam
You can also read