World Drug Report 2019 Pre release to Member States - Placeholder WDR 2019 Picture
←
→
Page content transcription
If your browser does not render page correctly, please read the page content below
Placeholder WDR 2019 Picture

World Drug Report 2019
Pre‐release to Member States                     Vienna, 19 June 2019
DRUG USE
Global trends in the estimated number   Global trends in the estimated
of people who use drugs and those       prevalence of drug use and drug use
with drug use disorders, 2006–2017      disorders, 2006–2017
Impact of new data in global estimates

                       2016 estimates   2017 estimates
Annual opiate users    19.4 ml          29.2 ml
Annual opioid users    34.3 ml          53.3 ml
People with drug use   30.5 ml          35 ml
disorder
PWID                   10.6             11.3 ml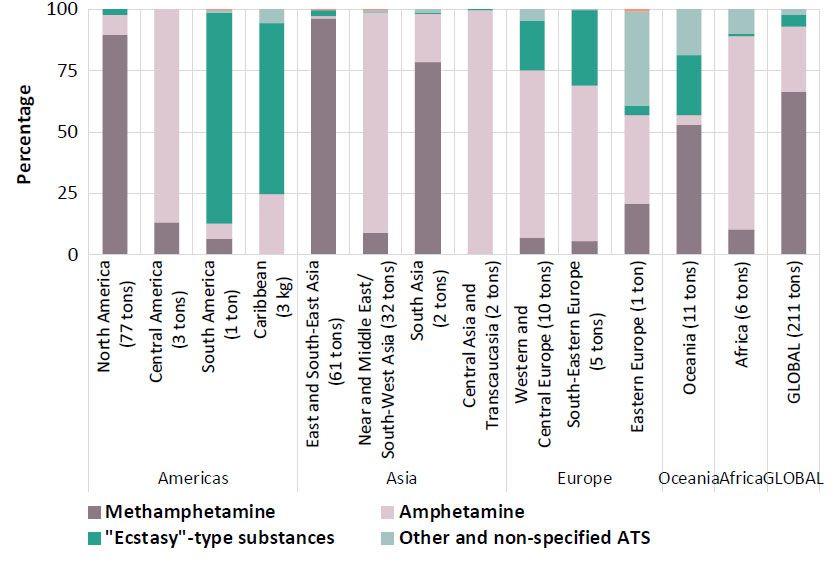
Impact of new data in regional estimates
Asia
                                            2016        2017
                                            estimates   estimates
South Asia            Annual opiate users   -           13 ml
                      Annual opioid users   -           18.7 ml
Asia                  Annual opiate users   11.2 ml     21.7 ml
                      Annual opioid users   13.6 ml     29.5 ml

Africa
                      2016 estimates        2017 estimates
Annual opiate users   2 ml                  1.5 ml
Annual opioid users   2.2 ml                6 ml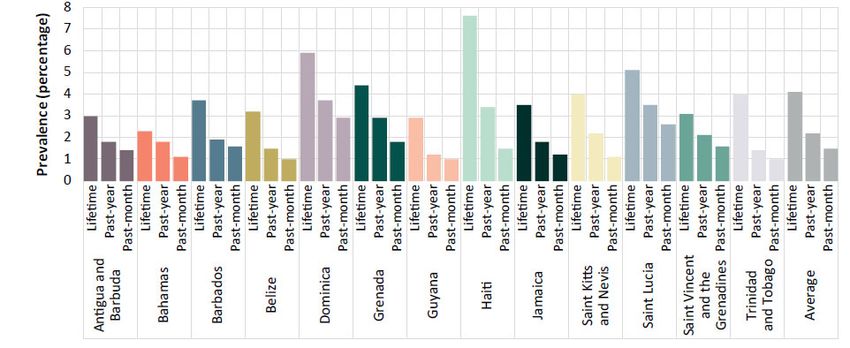
Long-term trends in injecting drug use and HIV among people who
inject drugs, selected countries, various years covering the overall
period 1992–2017
PRISONS AND DRUGS

PRISONS AND DRUGS
TRENDS IN PRODUCTION AND INTERCEPTIONS
                                       Global opium production and global
                                       quantities of heroin and of opiates (in
 Global cocaine manufacture and        opium equivalents) seized, 1980–
global quantities of cocaine seized,   2018
           1980–2018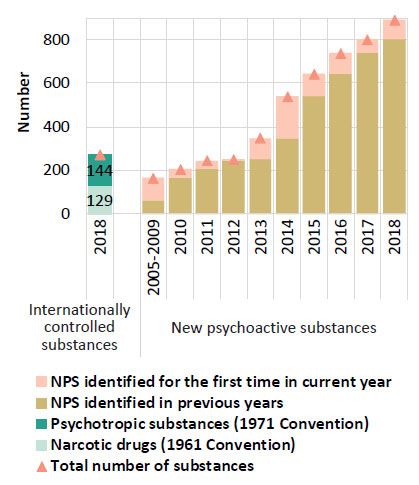
Internationally controlled drugs in 2018 and
identified new psychoactive substances at the global level, 2005–2018
                             (cumulative)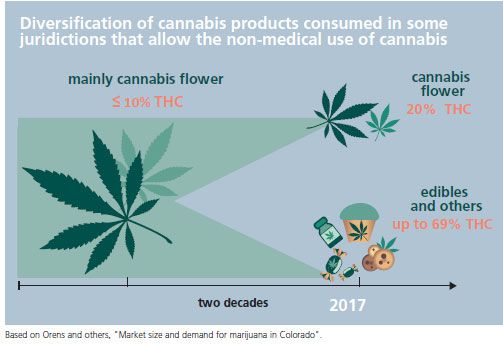
Proportion of surveyed Internet users using drugs (in
the past year) who purchased drugs over the darknet,
     2014–2019, selected regions and subregions
DARKNET: Consequences of shutdown of AlphaBay and Hansa markets in 2017 as reported by drug users (internet survey) in January 2018
OPIOIDS
Drug use among secondary school students in
Egypt, 2016
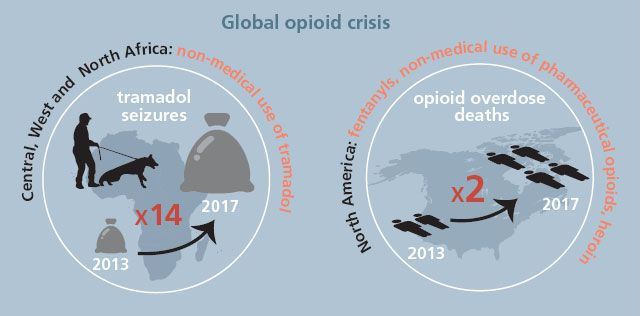
In Nigeria, 4.6 ml
persons non-medical
annual users of opioids
(mainly tramadol)Global quantities of pharmaceutical opioids seized,
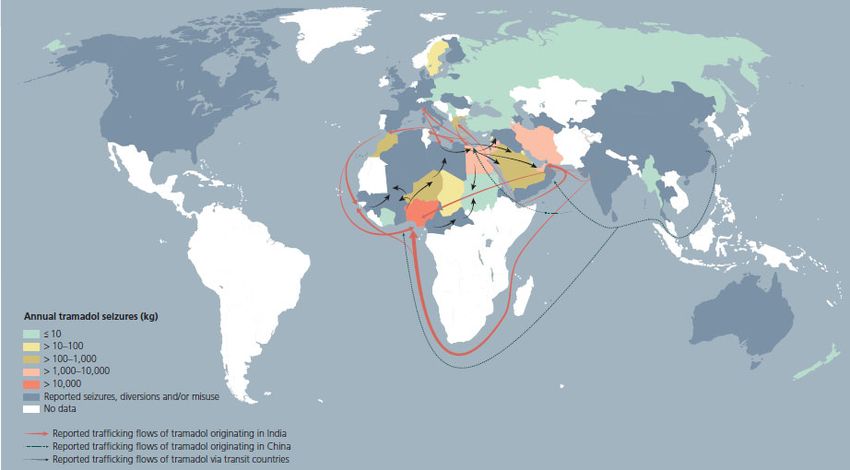
2013–2017Reported seizures, diversion and trafficking routes of
tramadol (based on reported seizures), 2013-2017
The boundaries and names shown and the designations used on this map do not imply official endorsement or
acceptance by the United Nations. Dashed lines represent undetermined boundaries The dotted line represents
approximately the Line of Control in Jammu and Kashmir agreed upon by India and Pakistan. The final status of
Jammu and Kashmir has not yet been agreed upon by the parties. The final boundary between the Republic of
Sudan and the Republic of South Sudan has not yet been determined. A dispute exists between the Governments
of Argentina and the United Kingdom of Great Britain and Northern Ireland concerning sovereignty over the
Falkland Islands (Malvinas).Opioid use in Chile Non-medical use of pharmaceutical Non-medical use of opioids by sex and opioids, Chile, 2002–2016 age group, Chile, 2010 and 2016
Opioid overdose deaths in Sweden, 2014-2017
Identified new synthetic opioid              Global quantities of fentanyl
     receptoragonists, 2009–2017                 and its analogues seized, by
                                                     region, 2010–2017

Just 4 countries reported seizures in 2013, 12 countries in 2016 and 16
countries in 2017.
Trends in availability of opioid analgesics for
consumption, by region, 1994–2016Diversion or illicit manufacturing of synthetic opioids for
the non medical use market?
In North America, diversion of Oxycodone
Fentanyl illicitly manufactured
Tramadol manufactured and/or packaged for
non medical market
Codeine?Opium poppy cultivation and production of opium,
1998–2018*Significant individual heroin seizures
January 2013–April 2019
Source: UNODC and Paris Pact, Drugs Monitoring Platform.Opiate use in Western and Central Europe, 2003–2017
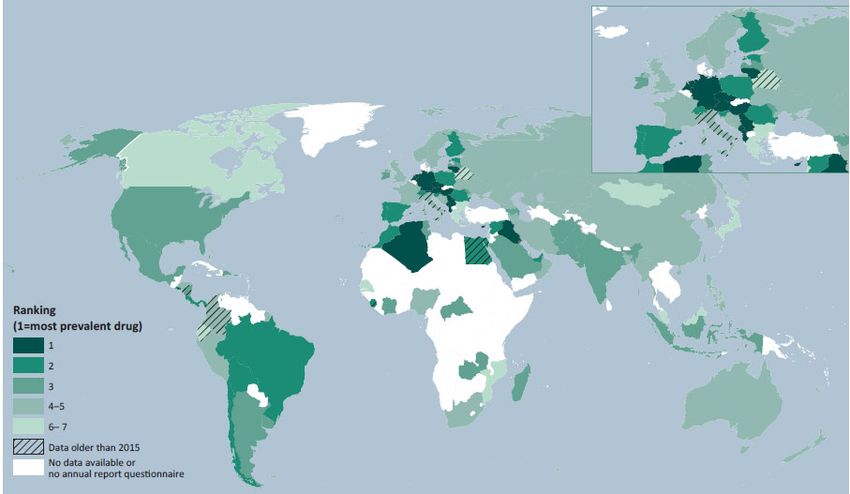
Ranking of sedatives and tranquillizers in order of prevalence
(based on national qualitative information), 2017
Source: UNODC.
The boundaries and names shown and the designations used on this map do not imply official endorsement or acceptance by the United Nations.
Dotted line represents approximately the Line of Control in Jammu and Kashmir agreed upon by India and Pakistan. The final status of Jammu and Kashmir has not yet been agreed upon by the
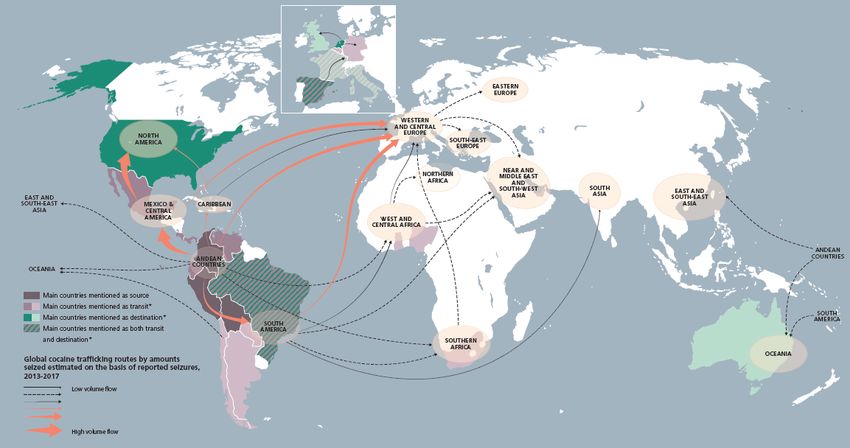
parties. A dispute exists between the Governments of Argentina and the United Kingdom of Great Britain and Northern Ireland concerning sovereignty over the Falkland Islands (Malvinas).Global cocaine manufacture and global quantities of cocaine seized, 2007–2017
Main cocaine trafficking routes as described by reported seizures, 2013–2017

Sources: UNODC. * A darker shade indicates a larger amount of cocaine being seized with the country as transit/ destination. The size of the route is based on the total amount seized on that route, according to
the information on trafficking routes provided by Member States in the annual report questionnaire, individual drug seizures and other official documents, over the period 2013–2017. The routes are
determined on the basis of reported country of departure/ transit and destination in these sources. As such, they need to be considered as broadly indicative of existing trafficking routes while several secondary
routes may not be reflected. Route arrows represent the direction of trafficking: origins of the arrows indicate either the area of departure or the one of last provenance, end points of arrows indicate either the
area of consumption or the one of next destination of trafficking. Therefore, the trafficking origin does not reflect the country in which the substance was produced. The main countries mentioned as transit or
destination were identified on the basis of both the number of times they were identified by other Member States as departure/ transit or destination of seizures, and the annual average amount that these
seizures represent during the period 2013–2017. For more details on the criteria used, please see the Methodology section of this document. The boundaries and names shown and the designations used on this
map do not imply official endorsement or acceptance by the United Nations.
Benzoylecgonine (cocaine metabolite)
 found in wastewater in 78 cities in
        Europe, 2011–2018
Cocaine and “crack” cocaine use among secondary school students in Egypt and Morocco, by sex, 2016
Global quantity of amphetamine-type stimulants
               seized, 1998–2017
Distribution by substance of the average annual quantity of amphetamine-type stimulants seized, by subregion, 2013–2017
Quantity of methamphetamine seized
   in China and South-East Asia,
             2013–2018
Reported seizures and trafficking routes of “captagon”
tablets, 2013–2017Quantities of amphetamines found in wastewater,
in 80 cities in Europe, 2011–2018Non-medical use of stimulants among secondary
school students in 13 countries in the Caribbean,
2016
Source: Inter-American Drug Abuse Control Commission A Report on Students’ Drug use
in 13 Caribbean Countries: 2016Quantities of recently controlled stimulant NPS seized
(mephedrone and MDPV), 2010–2017
Source: UNODC, responses to the annual report questionnaire.Cannabis seizures / trafficking
Global quantities of main cannabis products
seized, 1998–2017Global trends in the quantity of cannabis herb seized
and trends in cannabis trafficking, 2007-2017
Source: UNODC, responses to the annual report questionnaireGlobal trends in number of cannabis users and
qualitative information on trends in cannabis use,a 1998–2017
Source: UNODC, responses to the annual report questionnaire
a The index is based on information of, on average, 74 countries per year over the period 2007‒2017. Two points were given for “large
increase”, 1 point for “some increase”, 0 for “stable”, -1 for “some decrease” and -2 for “large decrease”. For reference, if all countries had
reported each year “some increase” in cannabis use over the period 2007-2017, the cannabis use perception index would have reached
811 points in 2017. For details on the perception index calculations, refer to the methodological annex, available in the online version of
the present report.Trends in the number of users aged 18 and older and
estimated quantity (tons) of cannabis flower consumed in
Colorado, 2014–2017
Sources: Adam Orens and others, “Market
size and demand for marijuana in Colorado:
2017 market update”, prepared for the
Colorado Department of Revenue (Denver,
Colorado, Marijuana Policy Group, August
2018).; and United States, Substance Abuse
and Mental Health Services Administration,
Center for Behavioral Health Statistics and
Quality, National survey on drug use and
health – state level estimates of cannabis
users.
Note: The United States Substance Abuse and
Mental Health Services Administration reports
prevalence among those aged 12 or older or
18 years or older; in this case the latter age
category has been used a proxy of number of
cannabis users 21 years and older.Global quantities of substances with hallucinogenic
properties seized, expressed in kilogram equivalents,
1998–2017
Source: UNODC, responses to the annual report questionnaireDistribution of quantities seized in doses Source: UNODC, responses to the annual report questionnaire
Trend in global quantities of substances with
hallucinogenic properties seized, expressed in doses,
                     1998–2017

 Source: UNODC, responses to the annual report questionnaire
You can also read