Monthly Regional Food Price Update Southern Africa
←
→
Page content transcription
If your browser does not render page correctly, please read the page content below
Monthly Regional Food Price Update
Southern Africa                                                                                               September 2018
Highlights
In the southern African region, maize prices are already beginning to show mixed trends. In South Africa and
Tanzania, maize prices remain below their respective 5 year average (5YA) levels, while in other countries,
such as Malawi and Mozambique, maize prices are on an upward trend and closing in on their 5YA levels.

A look at the Alert for Price Spikes (ALPS) shows that in both June and July, a few markets in Zambia were
already showing signs of stress.

Factors such as rising fuel costs are already pushing prices up, and as households deplete their stocks and
turn to markets, prices are expected to further rise. Although still too early to tell, this could be exacerbated
if an El Niño materializes and affects the next season crop. Close monitoring of the situation is needed.

                                                         International Staple Food Prices
              Figure 1: FAO Food Price Index and                        The FAO Food Price Index averaged 167.6 points in August
                 Food Commodity Price Index                             2018, virtually unchanged from its revised estimate for July
                                                                        but down 9.6 points (5.4 percent) from its level in the
                                                                        corresponding period last year. While cereals and, to a lesser
                                                                        extent, meat values were firmer in August, the values of the
                                                                        other sub-indices, namely sugar, vegetable oils and dairy
                                                                        products, dropped.
                                                                        The FAO Cereal Price Index averaged 168.4 points in August,
                                                                        representing a rebound of 6.5 points (4 percent) over July and
                                                                        of 15 points (10 percent) from August 2017. Wheat prices rose
                                                                        the most, largely on tighter export availabilities in view of
                                                                        deteriorating crop prospects, especially in the EU and the
                                                                        Russian Federation. International maize quotations also
                                                                        firmed, up by more than 3 percent from July, influenced by a
                                                                        slower pace in sales by Argentina and Brazil as well as the spill
Source: http://www.fao.org/worldfoodsituation/foodpricesindex/en/
                                                                        over from rising wheat values. By contrast, international rice
               Figure 2: South Africa Fuel Prices*                      prices eased, amid efforts to attract buyers and free space for
                                                                        new crop arrivals. (Figure 1).

                                                                                         South Africa Fuel Prices

                                                                        From July to September, petrol retail prices and diesel whole-
                                                                        sale prices increased to R16/liter and R14/liter respectively
                                                                        (Figure 2). Prices would have been higher had the
                                                                        government not intervened in September to absorb some of
                                                                        the fuel price increase.
                                                                        Over the past few months, the rapid depreciation of the rand
                                                                        against the USD (Figure 6) and high global oil prices have
                                                                        caused fuel prices to rise in South Africa. This negatively
                                                                        affects the cost of producing and transporting agricultural
 Source: Central Energy Fund; *Inland (Gauteng) prices                  commodities. We will continue to monitor fuel prices as we
 http://www.cefgroup.co.za/petrol-price/                                enter the 2018/19 production season.

                                                                                      Monthly Regional Food Price Update | September 2018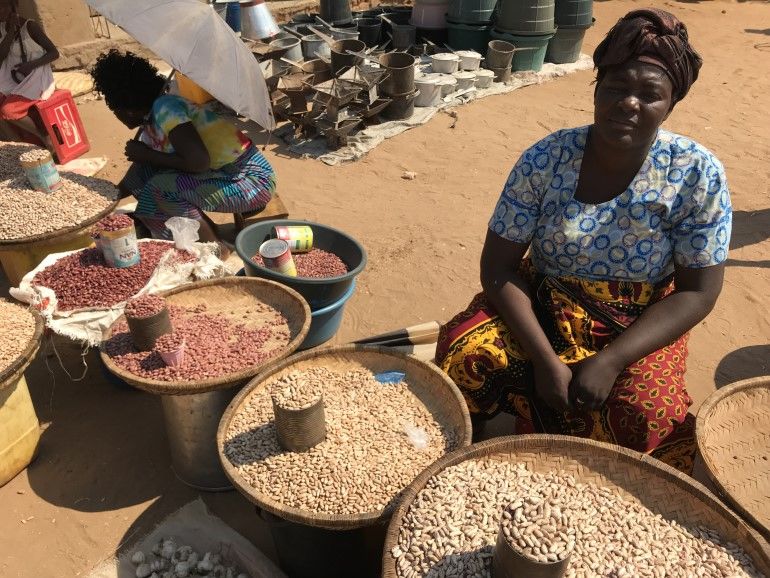
Regional Staple Food Price Trends and Outlook
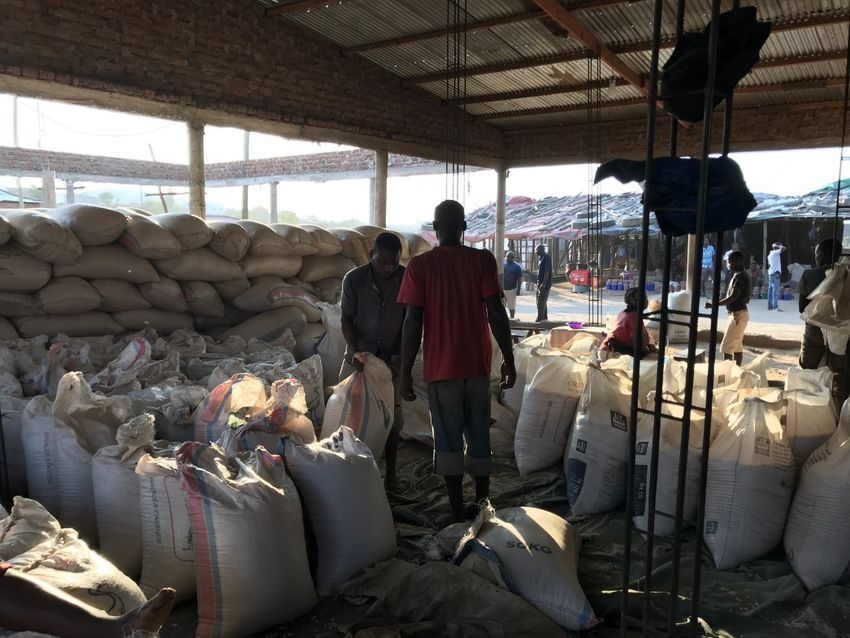
The latest available price data from countries in the southern African region show mixed trends (Figure 3). In South Africa and
Tanzania, the two largest cereal producing countries in the region, maize prices remain below their respective 5 year average
(5YA) levels. However, South Africa’s national average maize price ticked upwards in August; this may in part be attributed to
the depreciation of the rand and market uncertainty surrounding the possibility of El Niño and its potential impact on the next
season crop.
In Malawi and Mozambique, maize prices are on an upward trend; in both countries, localized deficits could continue to push
prices further up. At 13.4 MZN/kg, Mozambique’s national average maize price in August was 30 percent higher than the same
time last year.
In Zambia and Zimbabwe, national average maize prices remain relatively stable and close to their respective 5YA levels. Yet, in
Zambia, where maize production is expected to be 30 percent lower than last year, there are already pockets of areas
experiencing high maize prices (Figure 4).
Figure 3: Average Monthly Prices from Selected Countries
In Lesotho, the national average maize meal price remained stable at approximately 62 LSL/kg in July, which was below both
last year’s price and the 5YA.
In Madagascar, the national average price for local rice continued to decrease in July on account of a relatively good harvest.
However, prices are expected to follow an upward trend as traders begin to stock up ahead of the lean season.
Source: WFP and FAO (South Africa prices)
Note: Wholesale prices for South Africa and Tanzania
Monthly Regional Food Price Update | September 2018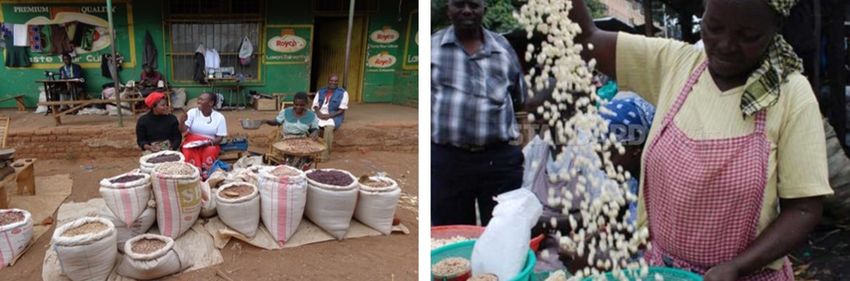
Alert for Price Spikes (ALPS)
ALPS is an indicator that monitors local food commodity prices and measures the extent to which food commodities found on
local markets experience unusually high food price levels for a specific month of the year. Figure 4 presents markets that meet
the selection criteria for ALPS (and those for which data were available).
Compared to June and July of last year, the market situation is overall better with most monitored markets in the region
indicating normal maize price levels. In Zambia, however, a few markets are experiencing high maize prices; as of July,
Luanshya and Mufulira were in the “Alert” phase, while Chingola, Kaoma, Mongu, Mungwi, Mwense were in “Stress.”
Figure 4: Status of Monitored Food Markets in Southern Africa: June and July - ALPS (Maize)
June July June July
Note that the markets depicted above are not necessarily identical from Source: ALPS WFP
one month to the next and the number of markets depicted may differ
from one month to the next because of data availability.
For more details on the ALPS indicator
Regional Exchange Rate Patterns and Inflation Rates
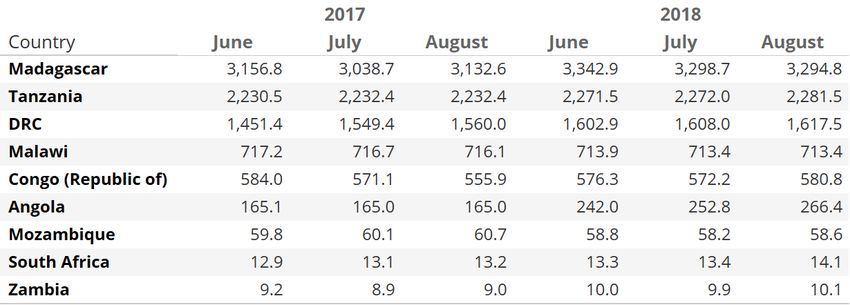
Table 1: Exchange Rates (USD) Table 1 shows the exchange rates for
select countries from June to August in
both 2017 and 2018. The Lesotho loti,
Namibian dollar, and eSwatini lilangeni
are pegged to the South African Rand,
and thus show the same movement.
The Angolan kwanza, which was
unpegged from the USD in January this
year, has devalued rapidly; compared to
August of last year, the kwanza is down
by nearly 61 percent. The Zambian
kwacha has also depreciated by
approximately 12 percent year-on-year
Figure 5: Exchange Rate Movements (y-o-y) vis-à-vis the USD. Only Malawi and
Mozambique saw their currencies
5A: % Change (y-o-y)*, August 2017—August 2018
slightly appreciate y-o-y (Figure 5A).
In terms of month-on-month (m-o-m),
from July to August 2018, with the
exception of Madagascar, all countries
saw their currencies depreciate vis-à-vis
the USD. The South African rand
continued to depreciate rapidly at over 5
percent, as did the Angolan kwanza
5B: % Change (m-o-m)*, July - August 2018
(Figure 5B). Exchange rate trends of
select countries are shown in Figure 6
on the following page.
*M-o-m is comparison between the current
month and the previous month; y-o-y is compari-
son between the current month and the same
month of the previous year.
Data Source: http://www.tradingeconomics.com
Monthly Regional Food Price Update | September 2018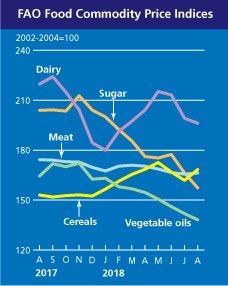
Figure 6: Exchange Rate Trends
Data Source: http://www.tradingeconomics.com
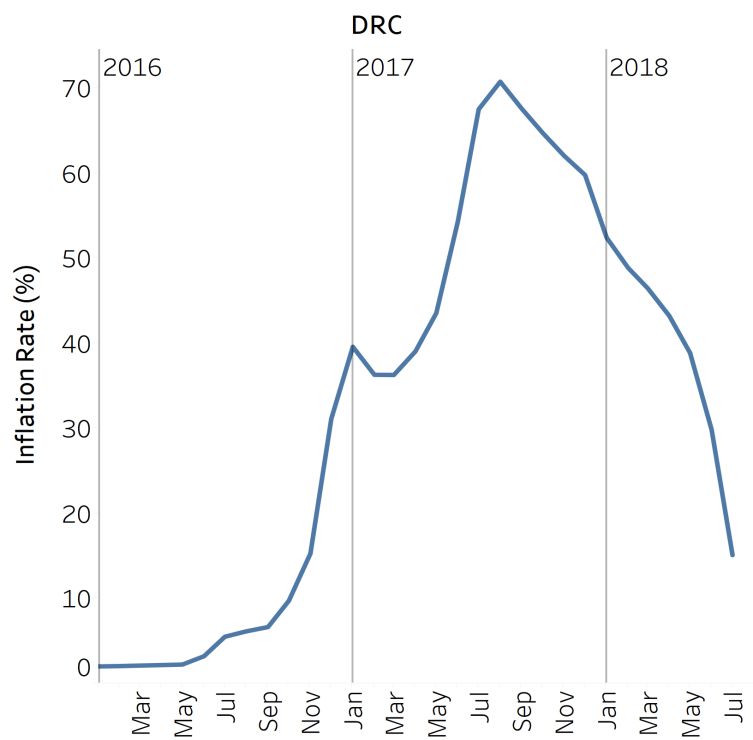
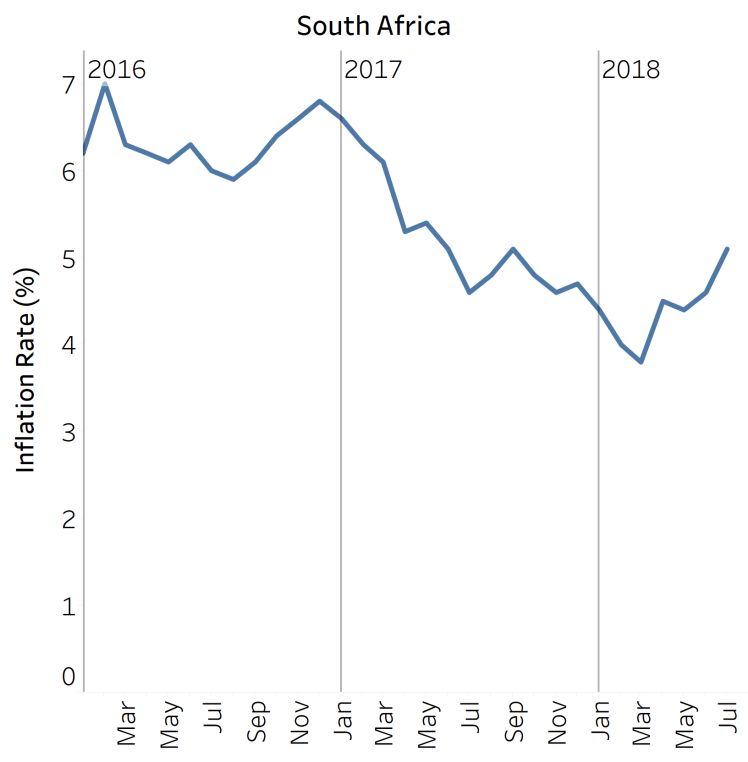
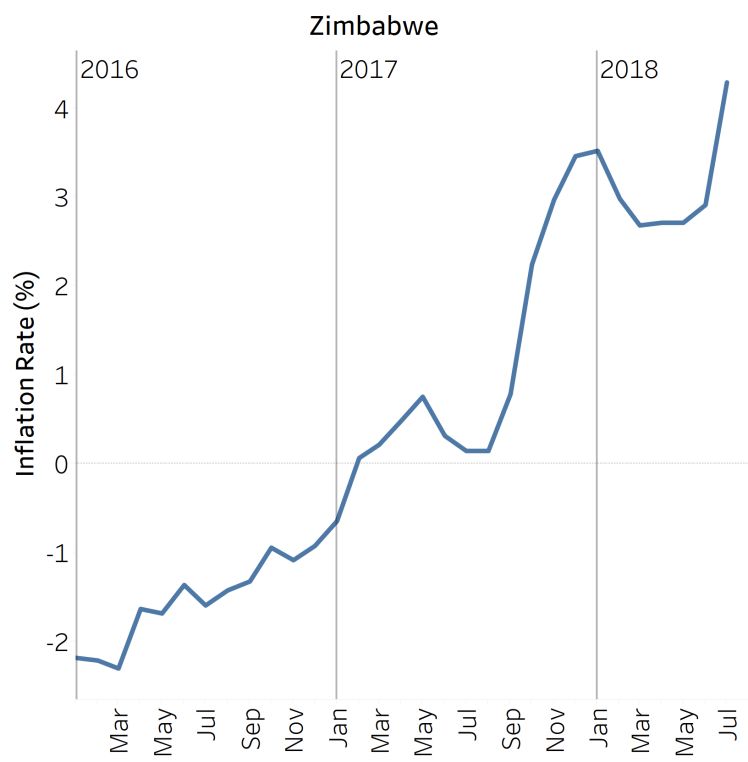
Inflation Rates for the past 12 months were approximately as follows (Figure 7): Angola, 19 percent (July); DRC, 15 percent
(July); Malawi, 9 percent (July); Zambia, 8 percent (August); South Africa, 5 percent (July); eSwatini, 5 percent (April);
Mozambique, 4.7 percent (July); Namibia, 4.5 percent (July); Zimbabwe, 4 percent (July); Lesotho, 4 percent (April); and
Tanzania 3 percent (July).
Although DRC and Angola have the highest inflation rates in the region, they have both been on a downward trend the past
couple of months; Angola’s has dropped by more than 50 percentage points since peaking in late 2016, and DRC’s has dropped
by nearly 80 percentage points since mid-2017.
Figure 7: Inflation Rates
Monthly Regional Food Price Update | September 2018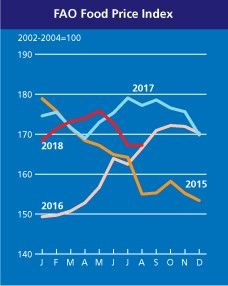
Malawi and Zambia have both seen a slight uptick in their inflation rates, while in Mozambique, Namibia, and South Africa,
inflation has been rising steadily over the past few months. This can be attributed to rising food and fuel prices, among others,
combined with weaker currencies (i.e. in the case of South Africa).

In Tanzania, the inflation rate continued to drop as food prices decreased with the ongoing harvest season. In July, Zimbabwe,
which continues to face liquidity challenges, recorded its highest level of inflation (4.3 percent) since 2012. Although its inflation
rate has been rising rapidly, it still remains relatively low compared to those of other countries in the region.

                                                                                             Data Source: http://www.tradingeconomics.com

                                                                                    Monthly Regional Food Price Update | September 2018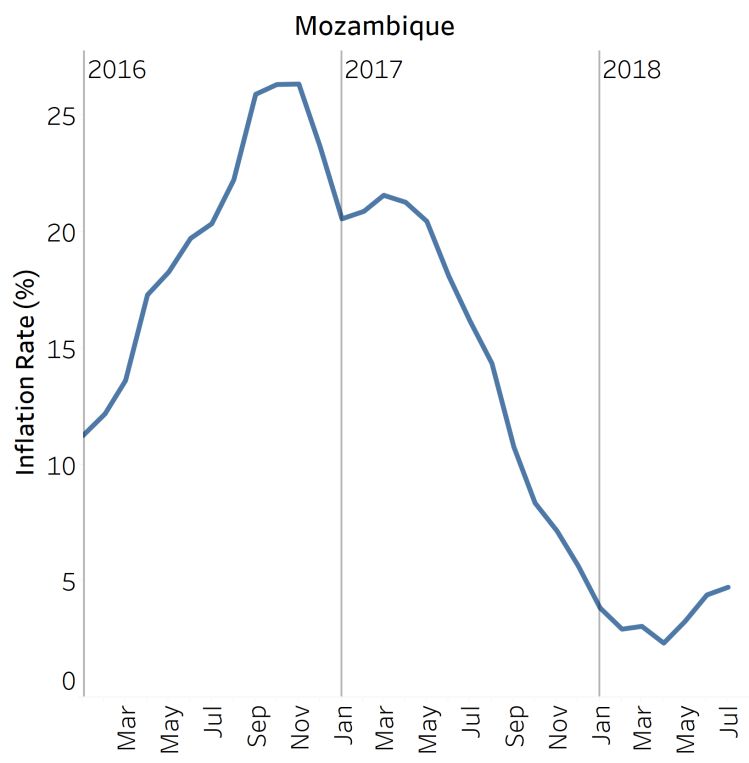
You can also read