June 2021 - National Agricultural Marketing Council

Page created by Sheila Baker
 
CONTINUE READING
June 2021 - National Agricultural Marketing Council
June 2021

        1
EXECUTIVE SUMMARY

       ❖ International and domestic price trends for selected fertilisers

From May 2020 to May 2021, international price (Rand terms) for Di-Ammonium Phosphate (DAP)
and Urea increased by 51.4% (from R5 378.67/ton to R8 143.20/ton) and 33.9% (from R3 658.22/ton
to R4 899.96/ton), respectively, while Muriate of Potash (MOP) decreased by 3.5% (from
R3 839.32/ton to R3 706.56/ton). During the same period the R/$ exchange rate appreciated by
22.5% from R/$18.11 to R/$14.04.

From May 2020 to May 2021, fertilizer domestic price for Urea and Mono-Ammonium Phosphate
(MAP) increased by 7.1% (from R7 358/ton to R7 880/ton) and 22.6% (from R9 583/ton to
R11 753/ton), respectively. The price for Potassium Chloride (KCL) decreased by 15.4% (from
R8 100/ton to R6 856/ton). The fluctuation of the domestic prices of fertilisers is subjected to price
volatility in the global market as South Africa is a net importer, as well as the R/$ exchange rate.

       ❖ Fuel prices & Illuminated paraffin

Between May 2020 and May 2021 petrol and diesel prices increased by 37.6% from R12.52/litre to
R17.23/liter and 30.5% (from R11.08/litre to R14.46/litre), respectively. Crude oil prices in US dollar
terms increased by 106% from US$33.15/barrel to US$68.30/barrel, with a 22.5% appreciation of the
Rand (R18.11/$ to R14.04/$). These fluctuations in South Africa’s fuel prices have been largely driven
by higher oil prices.

Between May 2020 and May 2021, the price of illuminated paraffin in both Coastal and Gauteng
regions increased by 110.6% (R3.68/liter to R7.75/liter) and 90.9% (R4.49/liter to R8.57/liter),
respectively. The movement of paraffin prices is typically affected by two main factors, international
petroleum costs, and the movement in the rand/dollar exchange rate.

       ❖ Freight Indices

From May 2020 to May 2021, the Baltic Dry Index (BDI) and the Grain and Oilseeds Freight Index
(GOFI) increased by 510.8% and 151.2%, respectively. The shipping industry had been volatile in
2020 due to the global effects of the COVID-19 pandemic on demand for commodities and this had
affected freight rates. In May 2021, the BDI reached 3 004 index points and the GOFI reached 183
index points.

                                                                                                     2
Table of Contents
Introduction................................................................................................................................................................................... 4
International and domestic price trends for selected fertilisers ............................................................................................... 4
Fuel prices ...................................................................................................................................................................................... 5
Baltic Dry Index.............................................................................................................................................................................. 6
Illuminated paraffin price ............................................................................................................................................................. 7
Conclusion...................................................................................................................................................................................... 7

                                                                                                                                                                                                  3
Introduction
The agricultural inputs such as fertilisers, play an important role towards agricultural productivity and
yield. The Input Cost Monitoring (ICM) report, published by the National Agricultural Marketing Council
(NAMC) is a quarterly report analysing historic and current trends from selected agricultural
production input prices in both domestically and international markets.
The data for this publication is obtained from Grain South Africa (Grain SA), Department of Energy
(DoE) and the South African Grain Information Service (SAGIS).

International and domestic price trends for selected fertilisers
Figure 1 illustrates international fertiliser prices for selected fertilisers from May 2015 to May 2021.
International prices (Rand terms) for Urea, Di-Ammonium Phosphate (DAP) and Muriate of Potash
(MOP) by increased by 45.1% (R3 377.01/ton to R4 899.96/ton), 44.% (from R5 640.32/ton to
R8 143.20/ton) and 6.7% (from R3 472.81/ton to R3 706.56/ton), respectively. During the depicted
period the Rand/US Dollar (R/$) exchange rate depreciated by 17.2% (from R/$11.97 to R/$14.04).
In terms of the US Dollar prices DAP and Urea increased by 23.1% (from US$471/ton to US$580/ton)
and 23.8% (from US$282/ton to US$349/ton), respectively, MOP decreased by 9.0% (from
US$290/ton to US$264/ton),

From May 2020 to May 2021, international price (Rand terms) for DAP and Urea increased by 51.4%
(from R5 378.67/ton to R8 143.20/ton) and 33.9% (from R3 658.22/ton to R4 899.96/ton),
respectively, while MOP decreased by 3.5% (from R3 839.32/ton to R3 706.56/ton). During the same
period the R/$ exchange rate appreciated by 22.5% from R/$18.11 to R/$14.04.

                               170
 International Fertilizer index Jan 2016 =

                               150
                               130
                               110
                                             90
                    100

                                             70
                                             50
                                             30
                                                   Mar-19

                                                   Mar-21
                                                   Mar-16

                                                   Mar-17

                                                   Mar-18

                                                   Mar-20
                                                   Jan-17
                                                   Jan-16

                                                   Jan-18

                                                   Jan-19

                                                   Jan-20

                                                   Jan-21
                                                    Jul-15

                                                    Jul-18

                                                    Jul-20
                                                    Jul-16

                                                    Jul-17

                                                    Jul-19
                                                   May-15

                                                   May-16

                                                   May-17

                                                   May-18

                                                   May-19

                                                   May-20

                                                   May-21
                                                   Sep-15

                                                   Sep-17
                                                   Nov-17

                                                   Nov-19

                                                   Sep-20
                                                   Nov-15

                                                   Sep-16
                                                   Nov-16

                                                   Sep-18
                                                   Nov-18

                                                   Sep-19

                                                   Nov-20

                                                  Urea   Di-Ammonium Phosphate (DAP)   Muriate of Potash (MOP)   R/$ Exchange rate

Figure 1: International price trends for selected fertilisers
Source: Own calculations based on data from Grain SA, 2021.

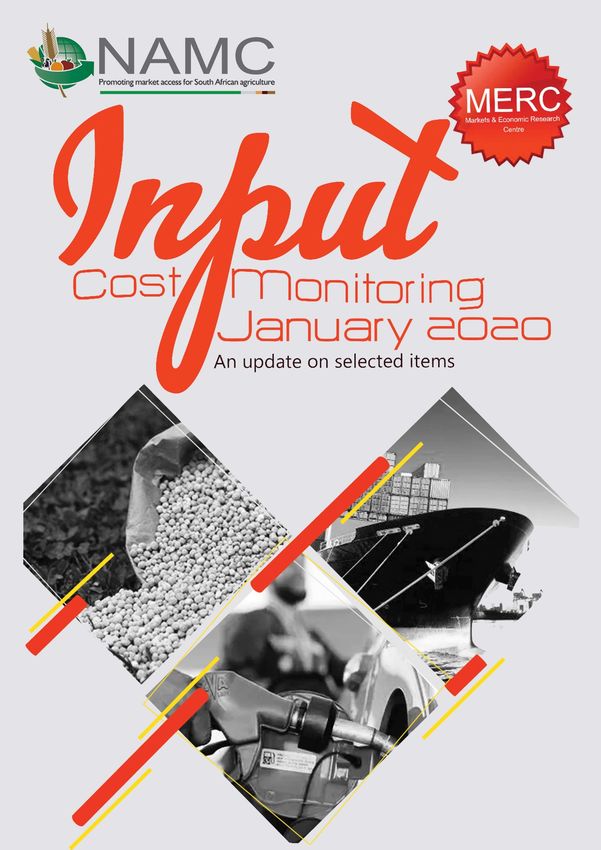
Figure 2 shows price trends for domestic fertiliser between May 2015 and May 2021. Over the
depicted period the local fertiliser prices for Urea and Mono-Ammonium Phosphate (MAP) increased
by 28.1% (from R6 152/ton to R7 880/ton) and 24.3% (from R9 457/ton to R11 753/ton), respectively,
while Potassium Chloride (KCL) declined by 7.3% (from R7 393/ton to R6 856/ton).

From May 2020 to May 2021, domestic fertilizer price for Urea and MAP increased by 7.1% (from
R7 358/ton to R7 880/ton) and 22.6% (from R9 583/ton to R11 753/ton), respectively. The price for
KCL decreased by 15.4% (from R8 100/ton to R6 856/ton). The fluctuation of the domestic prices of
fertilisers is subjected to price volatility in the global market as South Africa is a net importer, as well
as the R/$ exchange rate.
                                                                                                                                     4
INPUT COST MONITOR: Trends in selected agricultural input prices – an update
June 2021
 2019
  Local Fertilizer index Jan 2016 = 100   140

                                          130

                                          120

                                          110

                                          100

                                          90

                                          80

                                          70

                                          60
                                                                           Feb-16

                                                                                                                                                                                       Feb-19

                                                                                                                                                                                                                           Feb-20
                                                                                                               Feb-17

                                                                                                                                                   Feb-18

                                                                                                                                                                                                                                                               Feb-21
                                                May-15

                                                                                    May-16

                                                                                                                        May-17

                                                                                                                                                            May-18

                                                                                                                                                                                                May-19

                                                                                                                                                                                                                                    May-20

                                                                                                                                                                                                                                                                        May-21
                                                                                                      Nov-16

                                                                                                                                 Aug-17

                                                                                                                                                                                                                                                      Nov-20
                                                         Aug-15
                                                                  Nov-15

                                                                                             Aug-16

                                                                                                                                          Nov-17

                                                                                                                                                                     Aug-18
                                                                                                                                                                              Nov-18

                                                                                                                                                                                                         Aug-19
                                                                                                                                                                                                                  Nov-19

                                                                                                                                                                                                                                             Aug-20
                                                                                             MAP                                 Urea                                Potassium Chloride

Figure 2: Domestic price trends for selected fertilisers
Source: Own calculations from price lists, 2021.

Fuel prices
Domestic fuel prices are linked to factors such as international crude oil price (US$ per barrel) and
the R/$ exchange rate. Figure 3 presents crude oil prices, petrol prices and diesel prices trends
between May 2015 and May 2021. During this period petrol and diesel prices increased by 33.7%
(from R12.89/litre to R17.23/litre) and 29.3% (from R11.18/litre to R14.46/litre), respectively. In US
dollar terms crude oil prices increased by 3.9% (from US$65.74/barrel to US$68.30/barrel). During
the same period crude oil prices in Rand terms increased by 21.8% (from R787.24/barrel to
R958.93/barrel).

Between May 2020 and May 2021 petrol and diesel prices increased by 37.6% from R12.52/litre to
R17.23/liter and 30.5% (from R11.08/litre to R14.46/litre), respectively. Crude oil prices in US dollar
terms increased by 106% from US$33.15/barrel to US$68.30/barrel, with a 22.5% appreciation of the
Rand (R18.11/$ to R14.04/$). These fluctuations in South Africa’s fuel prices have been largely driven
by higher oil prices.

                                                                                                                                                                                                                                                                                 5
INPUT COST MONITOR: Trends in selected agricultural input prices – an update
June 2021
 2019
                             90                                                                                                                                                                                                                                    19.9

                                                                                                                                                                                                                                                                          Fuel price (R/litre) & R/$ exchange
   Crude oil (US$/barrel)
                             80                                                                                                                                                                                                                                    18.2

                             70                                                                                                                                                                                                                                    16.5

                             60                                                                                                                                                                                                                                    14.8

                             50                                                                                                                                                                                                                                    13.1

                             40                                                                                                                                                                                                                                    11.4

                             30                                                                                                                                                                                                                                    9.7

                             20                                                                  Feb-17                                                                                                                                                            8.0

                                                                                                                                                                         Feb-19

                                                                                                                                                                                                                                                 Feb-21
                                                             Feb-16

                                                                                                                                     Feb-18

                                                                                                                                                                                                             Feb-20
                                  May-15

                                                                      May-16

                                                                                                          May-17

                                                                                                                                              May-18

                                                                                                                                                                                  May-19

                                                                                                                                                                                                                      May-20

                                                                                                                                                                                                                                                          May-21
                                                    Nov-15

                                                                               Aug-16

                                                                                                                            Nov-17

                                                                                                                                                       Aug-18

                                                                                                                                                                                                    Nov-19
                                           Aug-15

                                                                                        Nov-16

                                                                                                                   Aug-17

                                                                                                                                                                Nov-18

                                                                                                                                                                                           Aug-19

                                                                                                                                                                                                                               Aug-20
                                                                                                                                                                                                                                        Nov-20
                                                                                  Crude oil                                                                     Diesel 0.05% S Gauteng
                                                                                  Petrol 95 ULP Gauteng                                                         R/$ Exchange rate

Figure 3: Crude oil and fuel prices
Source: Grain SA and DoE, 2021.

Baltic Dry Index
The Baltic Dry Index (BDI) measures international freight rates for dry bulk cargo which is affected by
both the demand to move raw materials across international markets and the supply of shipping
capacity. Using 2005 as a base year of 6000, the BDI is calculated on a monthly basis. The
International Grains Council (IGC) introduced a new Grain and Oilseeds Freight Index (GOFI) with
January 2013 used as a base year which represents 68 major grain routes.

Figure 4 presents BDI and GOFI between May 2015 and May 2021. The BDI and GOFI during this
period inreased by 406.3% and 126.5%, respectively attributted to changes in shipments times and
demand across the world. From May 2020 to May 2021, the BDI and GOFI increased by 510.8% and
151.2%, respectively. The shipping sector had been volatile in 2020 due to the global effects of the
COVID-19 pandemic on demand for commodities and this had affected freight rates. In May 2021,
the BDI reached 3 004 index points and the GOFI reached 183 index points.

                            4,000                                                                                                                                                                                                                                   196
                                                                                                                                                                                                                                                                                GOFI (January 2013=100)

                            3,500                                                                                                                                                                                                                                   174
  BDI (May 2005=6000)

                            3,000                                                                                                                                                                                                                                   152
                            2,500                                                                                                                                                                                                                                   130
                            2,000                                                                                                                                                                                                                                   108
                            1,500                                                                                                                                                                                                                                   86
                            1,000                                                                                                                                                                                                                                   64
                             500                                                                                                                                                                                                                                    42
                                  0                                                                                                                                                                                                                                 20
                                           Mar-18

                                           Mar-19
                                           Mar-16

                                           Mar-17

                                           Mar-20

                                           Mar-21
                                           Jan-17

                                           Jan-18
                                           Jan-16

                                           Jan-19

                                           Jan-20

                                           Jan-21
                                            Jul-16

                                            Jul-17
                                            Jul-15

                                            Jul-18

                                            Jul-19

                                            Jul-20
                                           Nov-15

                                           Nov-19

                                           Nov-20
                                           May-15

                                           May-16

                                           Nov-16

                                           Nov-17

                                           Nov-18
                                           May-17

                                           May-18

                                           May-19

                                           May-20

                                           May-21
                                           Sep-18

                                           Sep-19
                                           Sep-15

                                           Sep-16

                                           Sep-17

                                           Sep-20

                                                             Baltic Dry Index (BDI)                                                                Grain & Oilseed Freight Index (GOFI)
Figure 4: Baltic Dry Index versus Grain and Oilseeds Freight Index
Source: SAGIS, 2021.

                                                                                                                                                                                                                                                                                                                6
INPUT COST MONITOR: Trends in selected agricultural input prices – an update
June 2021
 2019
Illuminated paraffin price
Consumers utilise paraffin as an alternative source of household energy and is classified as an
essential backup fuel. Figure 5 shows illuminated paraffin prices for both the Coastal and Gauteng
regions from May 2018 to May 2021. During this period, illuminated paraffin prices for Gauteng
increased by 1.4% from R8.45/liter to R8.57/liter, while the Coastal regions decreased by 1.3% from
R7.85/liter to R7.75/liter, respectively.

Between May 2020 and May 2021, the price of illuminated paraffin in both Coastal and Gauteng
regions increased by 110.6% (R3.68/liter to R7.75/liter) and 90.9% (R4.49/liter to R8.57/liter),
respectively. The movement of paraffin prices is typically affected by two main factors, international
petroleum costs, and the movement in the rand/dollar exchange rate.

            12.00
            11.00
            10.00
             9.00
             8.00
  R/liter

             7.00
             6.00
             5.00
             4.00
             3.00
             2.00

                                                                                                                                                                             Mar-21
                                                                 Mar-19

                                                                                                                       Mar-20

                                                                                                                                                                    Jan-21
                                                        Jan-19

                                                                                                              Jan-20
                             Jul-18

                                                                                   Jul-19

                                                                                                                                         Jul-20
                    May-18

                                                                          May-19

                                                                                                                                May-20

                                                                                                                                                                                      May-21
                                      Sep-18

                                                                                            Sep-19
                                               Nov-18

                                                                                                     Nov-19

                                                                                                                                                  Sep-20

                                                                                                                                                           Nov-20
                                        Illuminated Paraffin Gauteng                                          Illuminated Paraffin Coastal

Figure 5: Comparison of illuminated paraffin price between Coastal and Gauteng regions
Source: Department of Energy, 2021.

Conclusion
International fertiliser prices have increased mainly due to several factors such as low stock levels
caused by the COVID-19 pandemic, rising natural gas prices, and earlier plantings in the US and EU,
which increased demand for fertilisers. Lower supply from China also supported price hikes. South
African fertiliser prices followed a similar trend in rand terms, although the increases had less of an
impact locally because of the stronger currency, an increase in crude oil prices could push fertiliser
prices higher. Furthermore, as aforementioned the South Africa’s fuel prices are influenced by
international and local factors. International factors include the fact that South Africa imports both
crude oil and finished products at a price set at the international level, including importation costs, e.g.
shipping costs. In nutshel, the continuation of increase in input costs had an effect on the ability of
grain farmers in South Africa to continue farming sustainably and profitably.
.

                                                                                                                                                                                               7
INPUT COST MONITOR: Trends in selected agricultural input prices – an update
June 2021
 2019

Compiled by:

Trends and discussion on selected topics:
Fezeka Matebeni
Corné Dempers
Dr Ndiadivha Tempia
Dr Christo Joubert

Enquiries: Dr Christo Joubert: +27 12 341 1115 or christo@namc.co.za

© 2021. National Agricultural Marketing Council.

Disclaimer:
Information contained in this document results from research funded wholly or in part by the NAMC,
acting in good faith. Opinions, attitudes and points of view expressed herein do not necessarily reflect
the official position or policies of the NAMC. The NAMC makes no claims, promises or guarantees about
the accuracy, completeness or adequacy of the contents of this document and expressly disclaims
liability for errors and omissions regarding the content thereof. No warranty of any kind, implied,
expressed, or statutory, including but not limited to the warranties of non-infringement of third party rights,
title, merchantability, fitness for a particular purpose or freedom from computer virus is given with respect
to the contents of this document in hardcopy, electronic format or electronic links thereto. Reference
made to any specific product, process, and service by trade name, trade mark, manufacturer or another
commercial commodity or entity are for informational purposes only and do not constitute or imply
approval, endorsement or favouring by the NAMC.

                                                                                                                  8
You can also read