Seasonal forecasts presented by: Latest Update: University of Pretoria
←
→
Page content transcription
If your browser does not render page correctly, please read the page content below
Seasonal forecasts
        presented by:

  Latest Update: 10 November 2018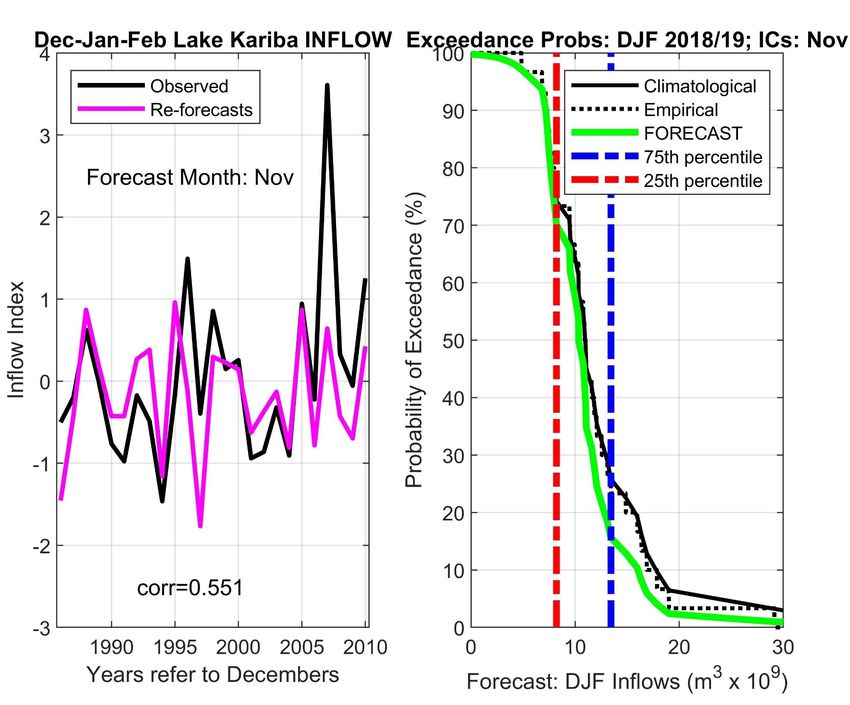
• The seasonal forecasts presented here by Seasonal Forecast Worx are based on forecast output of
  the coupled ocean-atmosphere models administered through the North American Multi-Model
  Ensemble (NMME) prediction experiment (http://www.cpc.ncep.noaa.gov/products/NMME/;
  Kirtman et al. 2014). NMME real-time seasonal forecast and hindcast (re-forecast) data are obtained
  from the data library (http://iridl.ldeo.columbia.edu/) of the International Research Institute for
  Climate and Society (IRI; http://iri.columbia.edu/).
• NMME forecasts are routinely produced and are statistically improved and tailored for southern
  Africa and for global sea-surface temperatures by employees and post-graduate students in the
  Department of Geography, Geoinformatics and Meteorology at the University of Pretoria
  (http://www.up.ac.za/en/geography-geoinformatics-and-meteorology/). Statistical post-processing is
  performed with the CPT software (http://iri.columbia.edu/our-expertise/climate/tools/cpt/).
• Why do we apply statistical methods to climate model forecasts?
  “…statistical correction methods treating individual locations (e.g. multiple regression or principal
  component regression) may be recommended for today’s coupled climate model forecasts”.
  (Barnston and Tippett, 2017).
• Why do we not use just a single model in our forecasts for southern Africa?
  “…multi-model forecasts outperform the single model forecasts…” (Landman and Beraki, 2012).

• For the official seasonal forecast for South Africa, visit the South African Weather Service website at
  http://www.weathersa.co.za/home/seasonal
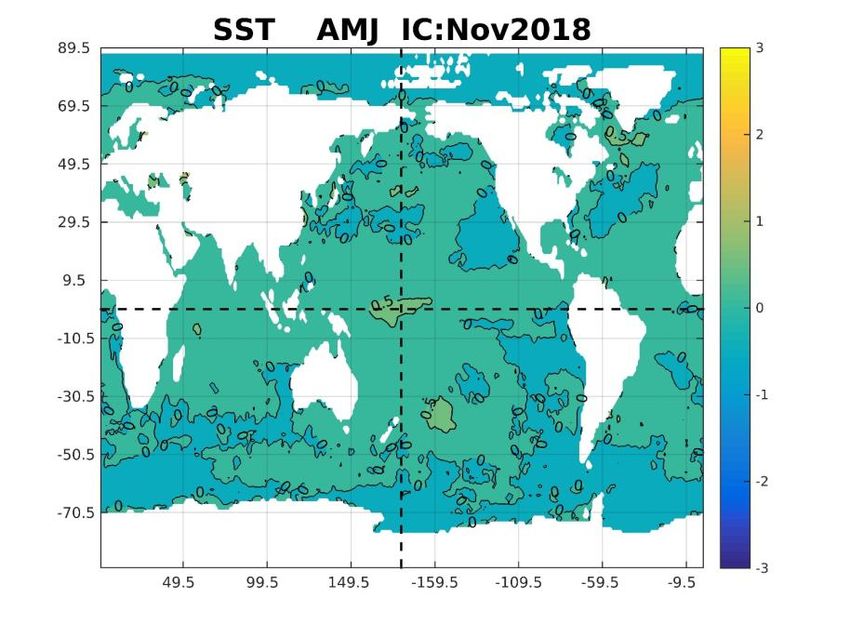
ENSO and Global SST
    Forecasts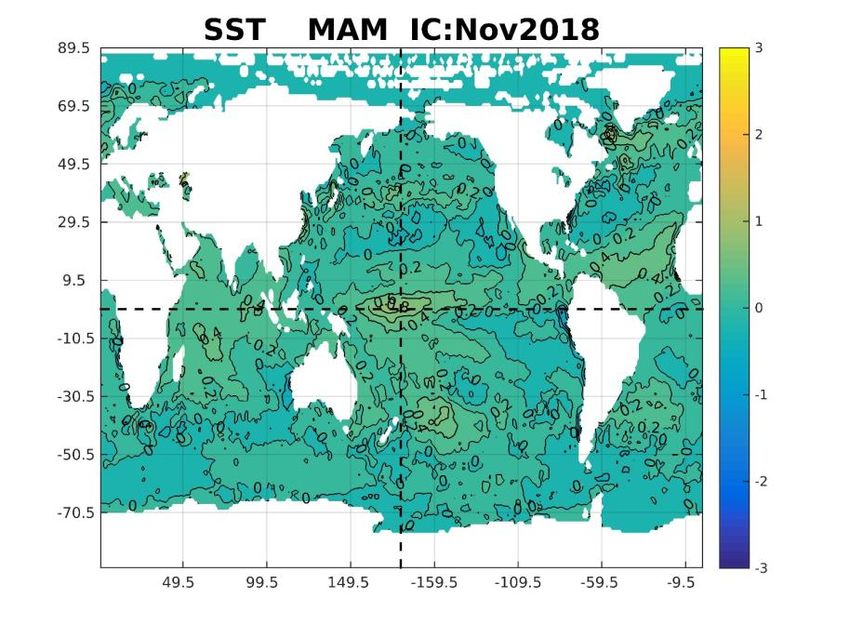
Prediction Method
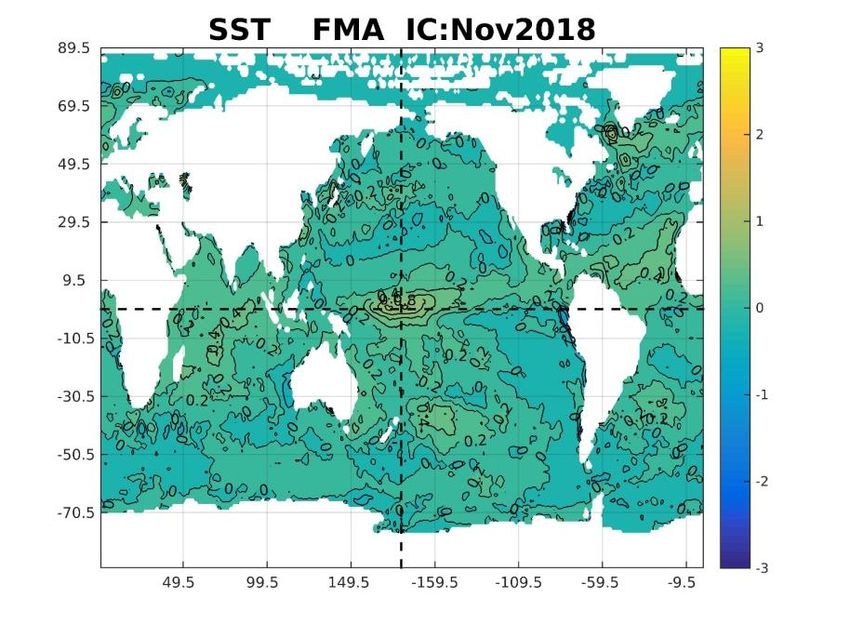
• Forecasts for global sea-surface temperature (SST) fields are
obtained through a combination of NMME models and a linear
statistical model that uses antecedent SST as predictor (Landman
et al. 2011). Forecasts for the Niño3.4 area (see insert) are derived
from the global forecasts.
• Three-month Niño3.4 SST forecasts are produced for three
categories:
• El Niño: SST above the 75th percentile
• La Niña: SST below the 25th percentile
• Neutral: Neither El Niño nor La Niña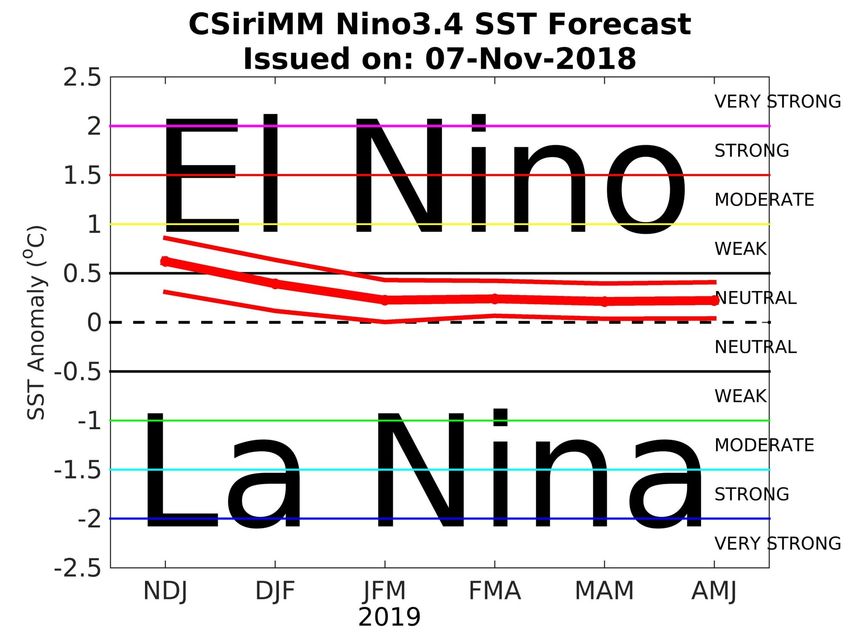

SST anomalies
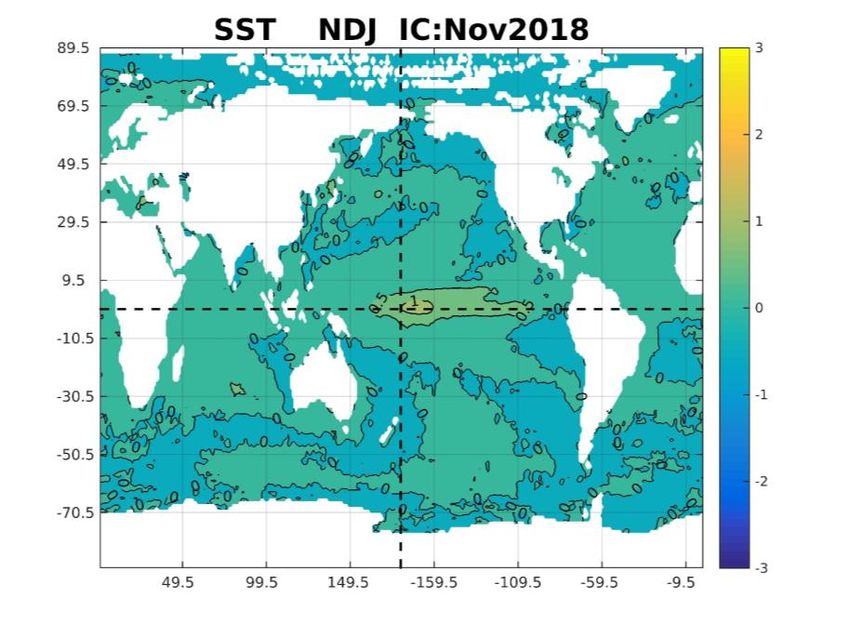
Round-up: ENSO
•Weak El Niño
•Central Pacific Ocean event
•ENSO-neutral by early 2019

Southern Africa
   Forecasts
Prediction Method
• Three-month seasons for seasonal rainfall totals and average maximum
  temperatures of NMME ensemble mean forecasts are interpolated to Climatic
  Research Unit (CRU; Harris et al. 2014) grids (0.5°x0.5°) by correcting the mean
  and variance biases of the NMME forecasts. Probabilistic forecasts are
  subsequently produced from the error variance obtained from a 5-year-out cross-
  validation process (Troccoli et al. 2008). Forecasts cover a 6-month period.
• Forecasts are produced for three categories:
   • Above: Above-normal (“wet” / “hot”, rainfall totals / maximum temperatures higher than the
     75th percentile of the climatological record)
   • Below: Below-normal (“dry” / “cool”, rainfall totals / maximum temperatures lower than the
     25th percentile of the climatological record)
   • Normal: Near-normal (“average” season)
• Verification:
   • ROC Area (Below-Normal) – The forecast system’s ability to discriminate dry or cool seasons
     from the rest of the seasons over a 32-year test period. ROC values should be higher than 0.5
     for a forecast system to be considered skilful.
   • ROC Area (Above-Normal) – The forecast system’s ability to discriminate wet or hot seasons
     from the rest of the seasons over a 32-year test period. ROC values should be higher than 0.5
     for a forecast system to be considered skilful.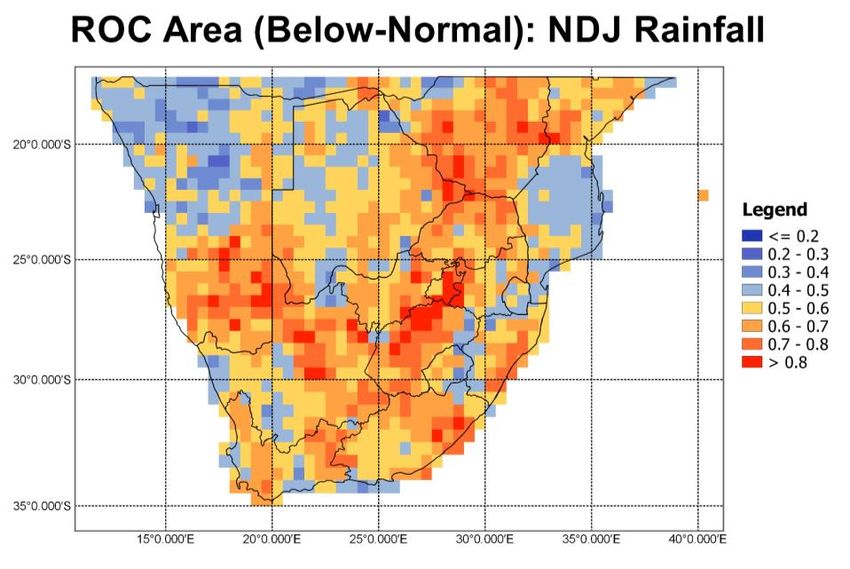
Round-up: SADC Rainfall
•Dry conditions over larger part of
 Namibia
•Rainfall expectations remain favourable
 over central parts
Round-up: SADC Max Temp

•Mostly hot, except for the central parts
Tailored
Forecasts
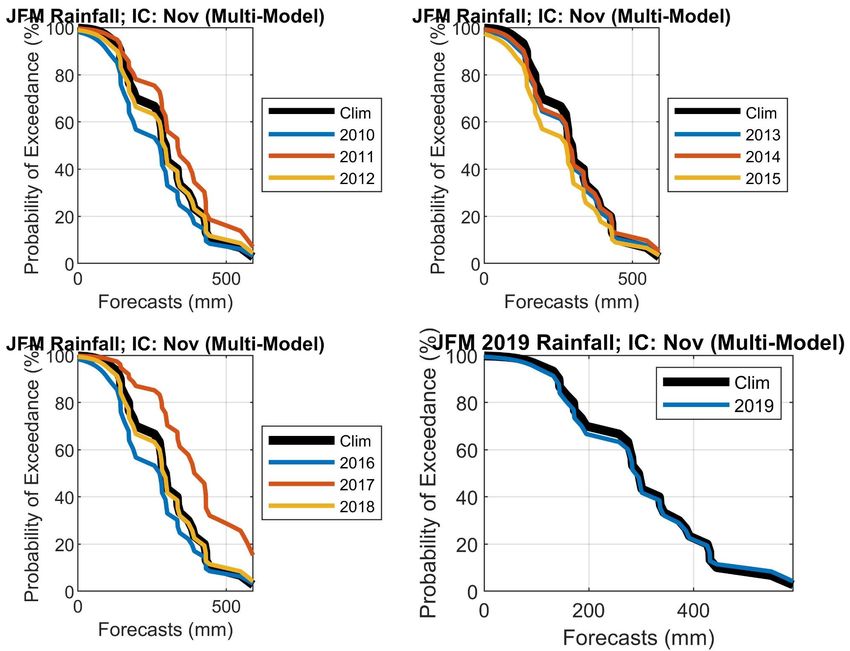
1. Probability of exceedance Jan-Feb-Mar 2019 rainfall forecast for the farm Buschbrunnen near
Grootfontein, Namibia
2. Probability of exceedance Dec-Jan-Feb 2018/19 inflow forecast for Lake Kariba, Zambia/Zimbabwe
3. Probabilistic three-category malaria forecast for Limpopo for Dec-Jan-Feb 2018/19Data and forecasts for the farm Buschbrunnen near Grootfontein, Namibia
Landman et al (2016)
JFM total rainfall as recorded by the farmer
1. GFDL-CM2p5-FLOR-B01
2. COLA-RSMAS-CCSM4
Rainfall averages per month
The multi-model:
Re-forecasts of JFM rainfall outcomes for 2010-2018, and real-time
forecast for JFM 2019Inflow forecast for Lake Kariba: onset season of DJF
Muchuru et al. (2016)Malaria forecasts
(VERY experimental and unofficial)
Dec-Jan-Feb (DJF) malaria cases for the
Limpopo Province were obtained from
their Department of Health. Taking the
Cross-validated
natural logs (ln) of the DJF malaria data
resulted in the data to become
normally distributed (Lilliefors test
shows that the transformed data are
from a normal distribution). The
seasonal rainfall hindcasts and the
2018/19 real-time forecast from the
GFDL coupled model are statistically
downscaled to DJF malaria values. The
canonical modes of the rainfall
forecasts (see insert showing the
predictor area) are used in a multiple
linear aggression model as predictors.
Retrospective REAL-TIME• Barnston, A.G. and Tippett, M.K., 2017: Do statistical pattern corrections improve seasonal climate
predictions in the North American Multimodel Ensemble models? Journal of Climate, 30: 8335-8355. doi:
10.1175/JCLI-D-17-0054.1
• Harris, I., Jones, P. D., Osborn, T. J., and Lister, D. H., 2014: Updated high-resolution grids of monthly climatic
observations - the CRU TS3.10 Dataset. International Journal of Climatology, 34: 623-642. doi:
10.1002/joc.3711
• Kirtman, B. P. and Co-authors 2014: The North American Multimodel Ensemble: Phase-1 seasonal-to-
interannual prediction; Phase-2 toward developing intraseasonal prediction. Bulletin of the American
Meteorological Society. 95, 585–601. doi: http://dx.doi.org/10.1175/BAMS-D-12-00050.1
References
• Landman, W.A., and Beraki, A., 2012: Multi-model forecast skill for midsummer rainfall over southern Africa.
International Journal of Climatology, 32: 303-314. doi: 10.1002/joc.2273.
• Landman, W.A., Archer, E. and Tadross, M., 2016: Decision-relevant information on seasonal time scales –
the case of a farm in northern Namibia. Conference Proceedings of the 32nd Annual Conference of the
South African Society for Atmospheric Science, Cape Town, 31 October to 1 November 2016, pp 69-72. ISBN
978-0-620-72974-1.
• Landman, W.A., DeWitt, D., and Lee, D.-E., 2011: The high-resolution global SST forecast set of the CSIR.
Conference Proceedings of the 27th Annual Conference of South African Society for Atmospheric Sciences,
22-23 September 2011, Hartbeespoort, North-West Province, South Africa. ISBN 978-0-620-50849-0
• Landman, W.A., DeWitt, D. Lee, D.-E., Beraki, A. and Lötter, D., 2012: Seasonal rainfall prediction skill over
South Africa: 1- vs. 2-tiered forecasting systems. Weather and Forecasting, 27: 489-501. DOI: 10.1175/WAF-
D-11-00078.1
• Muchuru, S., Landman, W.A. and DeWitt, D., 2016: Prediction of inflows into Lake Kariba using a
combination of physical and empirical models. International Journal of Climatology, 36: 2570–2581, DOI:
10.1002/joc.4513.
• Troccoli, A., Harrison, M., Anderson, D.L.T. and Mason, S.J., 2008: Seasonal Climate: Forecasting and
Managing Risk. NATO Science Series on Earth and Environmental Sciences, Vol. 82, Springer, 467 pp.Financial support from… • The National Research Foundation through the Incentive Funding for Rated Researchers • ACCESS (Alliance for Collaboration on Climate and Earth System Science) through the project “Investigating predictability of seasonal anomalies for societal benefit”
Student participation in forecast system development

             Stephanie Hinze, BSc (Honours)(Meteorology):
             Statistical downscaling using large and high-resolution data sets, forecast displays for
             SADC rainfall and maximum temperatures, forecast verification

             Surprise Mhlongo, BSc (Honours)(Meteorology):
             Improving on SST forecast system through pattern correction, correlation vs
             covariance approaches, forecast output combination (multi-model approaches),
             mean and bias correction, and correct for skill
You can also read