UPDATES Northland drought assessment using Standard Precipitation Index
←
→
Page content transcription
If your browser does not render page correctly, please read the page content below
ARTICLES
UPDATES
Northland drought assessment using
Standard Precipitation Index
AUTHORS: Hoa X. Ph am and Jason Don agh y, Northland Regional Council
The Standard Precipitation Index (SPI) is a powerful, flexible index which is commonly
used to assess meteorological drought caused by rainfall deficit. New Zealand SPI maps
provide a good indication of droughts at national level. However, this information is
relatively coarse for Northland where drought severity can be strongly localised. The
following article presents some insights from the application of the SPI method to
historical drought events in Northland.
Int roduct ion
Drought has a significant impact on Northland farming. It tends to starts slowly, often
without warning, and can last for significant periods of time and cover large spatial areas.
Drought in Northland has become more frequent and impacts more severe during summer
months as a result of increasing temperature and decreasing rain totals.
At least eight severe droughts were recorded in Northland since 1900 (Keyte, 1993 and
NIWA, 2010 & 2013). The Northland Avocate (Feb, 2017) reported five droughts have
occurred in the past eight years and been of a highly localised nature. The frequency and
severity of drought in Northland is projected to continue to increase in the future under a
changing climate (NIWA, 2013 & 2016). The research presented in this article represents
the first steps of an attempt to develop a regional drought warning system. It involves
identifying climatic zones, applying SPI and mapping SPI for severe 1914-15, 1945-46,
1982-83 and 2009-10 drought events.
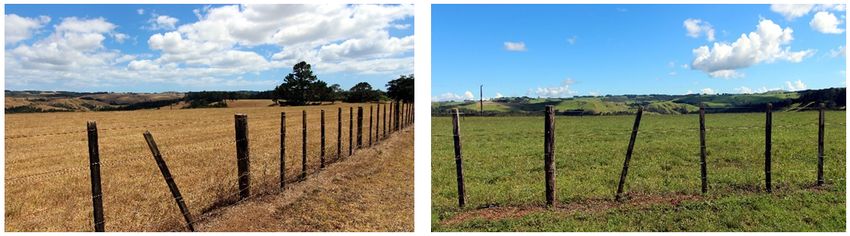
Takou Bay area at the height of drought (left) and a few months later (right) .Photo: Matt Johnson, NRC
17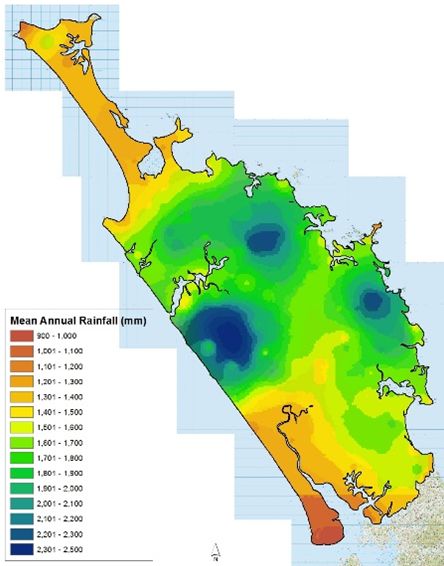
ARTICLES
UPDATES
Input Dat a

This study used rainfall data from 140 stations owned by NIWA, MetService and NRC for
grouping climate zones. Data at a maximum of 40 stations was used for historical drought
assessment at regional scale. Daily rainfall data was synthesised in some cases in order to
extend the time series beyond gauge operating periods.

Met hods and Resul t s

Rainfall in Northland is highly variable
leading to the development of localised
drought in the region. Hence, the first
step was to sub-divide the region into
four climate zones based on long-term
annual rainfall variability (see map to
right). This was done with the aid of
ArcGIS Geostatistics. A ratio of 70:70
stations was used for calibration and
verification of spatial interpolation
process. Rainfall stations could then be
selected for further analysis in this study
based on achieving representation
across the four climate zones.

The SPI was introduced by McKee et al.
(1993) as a method of measuring
drought severity for a particular rain
station. The SPI is based on the
probability of precipitation for any time
scale. The probability of observed
precipitation is then transformed into an index. The table below shows how SPI values
correspond to categories of drought severity.

The main advantage of the SPI is that it allows for areas with different rainfall regimes to

18
ARTICLES
UPDATES
be compared. In addition, the SPI provides a method for comparing an area against its own
history and giving a normalized value to describe the current rainfall conditions. Through
this normalization, rainfall values at different locations can be compared (WMO, 2009).
The latest SPI program (SPI_SL_6.exe) developed by the Colorado State University, USA
was used in this study. This program provides monthly-based SPI values.
Northland usually experiences 2-3 month droughts with the exception of a six-month
drought in 1914-1915. Drought has occurred in spring and summer during El Niño and La
Niña. In order to best describe the 1914-15 and 2009-10 drought events, SPI 3 and 6 were
computed, respectively. SPI-6 was computed for six consecutive months (from October to
February) while SPI-3 was computed for three consecutive months (November - January).
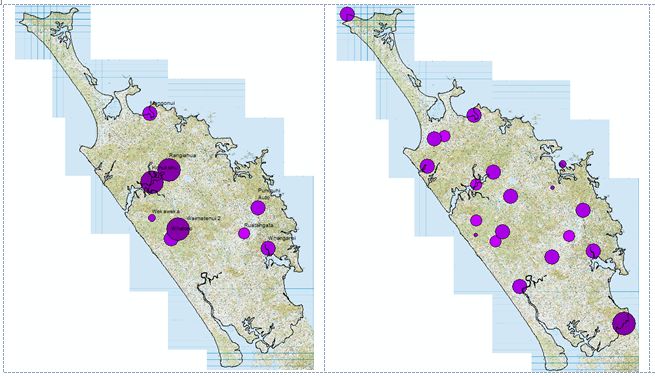
Results of these computations were used to develop SPI maps for selected historical
drought events shown in the maps below. These station-based SPI maps allow drought
intensity at both temporal and spatial scales to be visualised.
1914-15 1914-15
SPI-6 for
ONDJFM for
year 1914-15
(top left)
SPI-3 for NDJ
for years
1945-46 (top
right) 1982-83
(bottom left)
and 2009-10
(bottom left)
19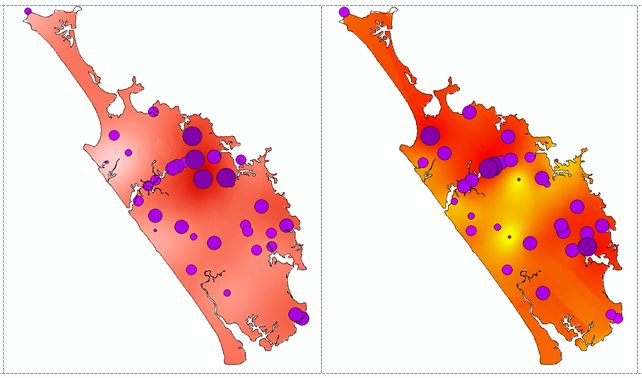
ARTICLES
UPDATES
The images on the previous page display some of the general trends of dryness in the
region and help to identify the most vulnerable areas to drought. There are a number of
obvious features present across the landscape, but the visualization also revealed some
apparent errors in the data.

     -   The most obvious feature in the spatial variability of dryness is a big shift from the
         west to east coast from early last century (1914-15) to present (2009-10). Also,
         more areas in the the east are identified as being extremely dry for year 2009-10
         (Fig. 3).
     -   Another noticeable feature is that drought severity relies upon both the magnitude
         of rainfall deficits and its duration. For example, the 1914-15 drought was caused
         by both high magnitude rainfall deficits and long duration while the 1982-83
         drought was induced by low magnitude rainfall deficits but long duration.

The graph below shows that majority of extreme drought events were prior to 1931 and
post-1994 when SPI varies between -1.5 to -3.5 (except for Dargaville in 2004 with the SPI
value of -6.44 as an error). At least five droughts have been declared by the Government
since 1994, suggesting an increase in drought frequency over the past two decades.

                             SPI-12 computed for selected rainfall stations

20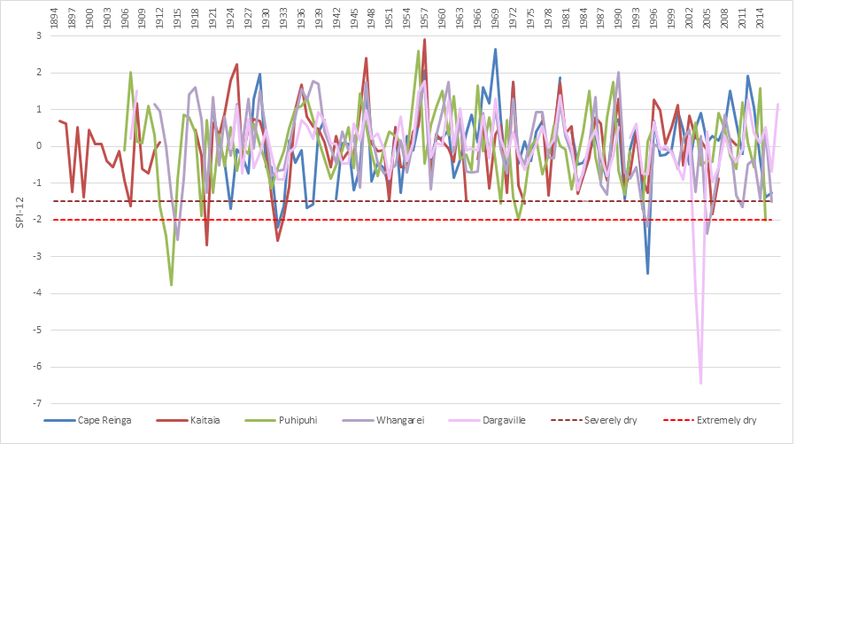
ARTICLES
UPDATES
At this time the research has not progressed to the point of ranking the droughts as well as
prediction of drought return period. It is also expected that agricultural and hydrological
droughts will be integrated in the system when automated network data are available.

Ref erences
Keyte M., 1993. Droughts in Northland. MSc Thesis. Waikato University. Hamilton. NZ.

McKee, T.B., N.J. Doesken and J. Kleist, 1993. The Relationship of Drought Frequency and Duration to Time Scales.
8th Conference of Applied Climatology. 179-184.

McKee, T.B., N.J. Doesken and J. Kleist, 1994. Drought Monitoring with Multiple Time Scales. 9th Conference on
Applied Climatology. 233-236.

National Institute of Water & Atmospheric Research Ltd (NIWA), 2010. The Northland drought of 2009-2010, report
prepared for NRC. Chrisschurch, NZ.

National Institute of Water & Atmospheric Research Ltd (NIWA), 2013. The 2012-13 drought: an assessment and
historical perspective, report prepared for Ministry for Primary Industries. Wellington, NZ.

National Institute of Water & Atmospheric Research Ltd (NIWA), 2016. Climate change projections and implications
for Northland, report prepared for NRC. Auckland, NZ.

National Institute of Water & Atmospheric Research Ltd (NIWA), 2011. Scenarios of Regional Droughtunder Climate
Change, report prepared for Ministry of Agriculture and Forestry.

National Institute of Water & Atmospheric Research Ltd (NIWA), 2006. Climate variability - The Southern Annular
Mode and New Zealand climate. Water & Atmosphere: 14(2).

Santos J.F., Portela M.M. & Pulido-Calvo I., 2011. Regional frequency analysis of drought in Portugal. Water
Resources Management: DOI 10.1007/ s11269-011-9869-z.

World Meteorological Organization (WMO) and Global Water Partnership (GWP), 2016. Handbook of drought
indicators and indices (M. Svoboda and B. A. Fuchs). Integrated drought management programe (IDMP), integrated
drought management tools and guidelines series 2. Geneva, Switzeland.World Meteorological Organization (WMO),
2012. Standardised Precipitation Index User Guide (M. Svoboda and B. A. Fuchs). (WMO-No. 1090). Geneva,
Switzerland.

21
You can also read