Winter Outlook 2020-2021 - United States Coast Guard Briefing Prepared by: National Weather Service - United States ...
←
→
Page content transcription
If your browser does not render page correctly, please read the page content below
Winter Outlook 2020-2021

   United States Coast Guard
            Briefing

  Prepared by: National Weather Service
          WFO Mount Holly, NJ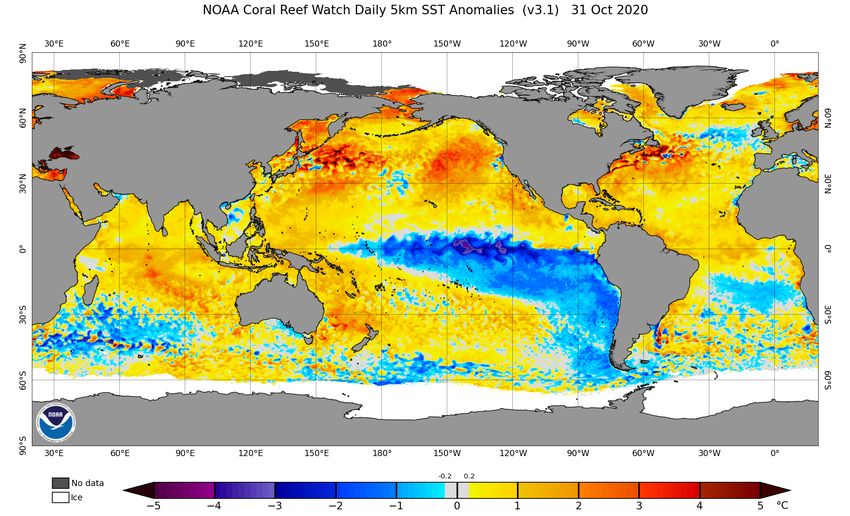
Outline

• Winter 2019 – 2020 Review

• Winter 2020 – 2021 Outlook

• NWS Winter Weather Products
Temperatures Last Winter
                                          2019–20 Winter Temperature Verification*
                                                      at Philadelphia
                                                               Observed Temp (Temp
                                                Period
                                                                    Departure)

                                             December            38.7°F (+1.2)

                                              January            38.9°F (+5.9)

                                             February            40.8°F (+5.1)

                                               March             48.9°F (+5.4)

NOAA Temperature Outlook Last
                                           Winter Avg*           39.5°F (+4.0)
         Winter*
        (Issued Fall 2019)                 Dec-Mar Avg           41.8°F (+4.5)

            *Note: Meteorological Winter is defined as Dec-Jan-Feb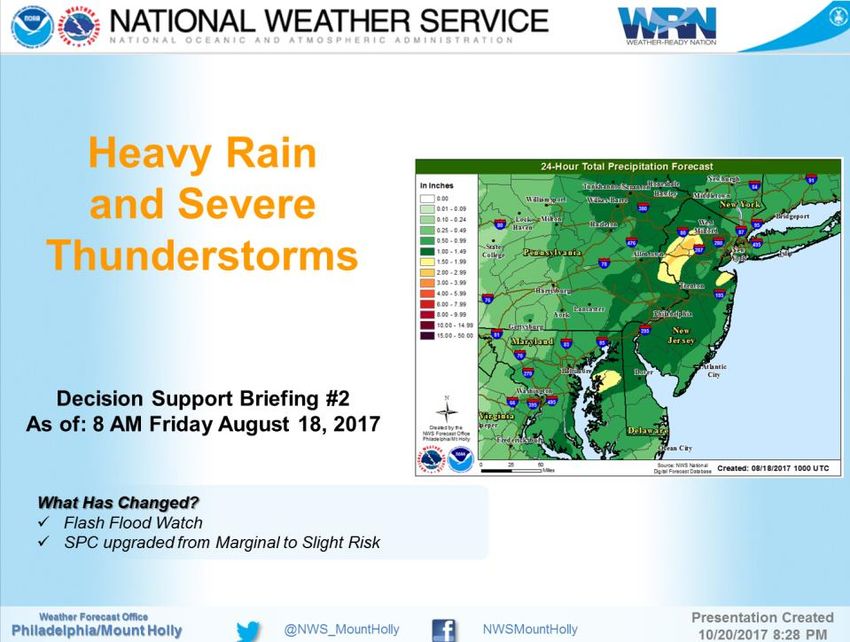
Average Winter Temperatures
   at PHL (Past 10 Winters; °F)
2019-2020: 39.5
2018-2019: 36.9
2017-2018: 36.9
2016-2017: 40.5         5 consecutive
2015-2016: 41.4         winters of
2014-2015: 32.6         above average
2013-2014: 33.0         temperatures,
                        and 7 of the
2012-2013: 38.2
                        last 10!
2011-2012: 40.7
2010-2011: 33.1
Avg (1981-2010): 35.5
Precipitation/Snowfall Last Winter
                                                     2019–20 Winter Precipitation/Snowfall
                                                          Verification at Philadelphia

                                                                  Observed Precip      Observed Snowfall
                                                    Period
                                                                 (Precip Departure)   (Snowfall Departure)

                                                  November       1.16” (-1.83”)            T (-0.3”)
                                                  December       5.21” (+1.65”)          0.1” (-3.3”)
                                                   January       2.64” (-0.39”)          0.2” (-6.3”)
                                                  February       2.46” (-0.19”)            T (-8.8”)
                                                    March        3.94” (+0.15”)          0.0” (-2.9”)

NOAA Precipitation Outlook Last                     April        3.75” (+0.19”)          0.0” (-0.5”)
           Winter*
                                                Winter Total*   10.31” (+1.07”)         0.3” (-18.4”)
         (Issued Fall 2019)
                                                  Seasonal
                                                                19.16” (-0.42”)         0.3” (-22.1”)
                                                   Total**
                   *Notes: * Meteorological Winter is defined as Dec-Feb
                              * * Seasonal   is defined as Nov-Apr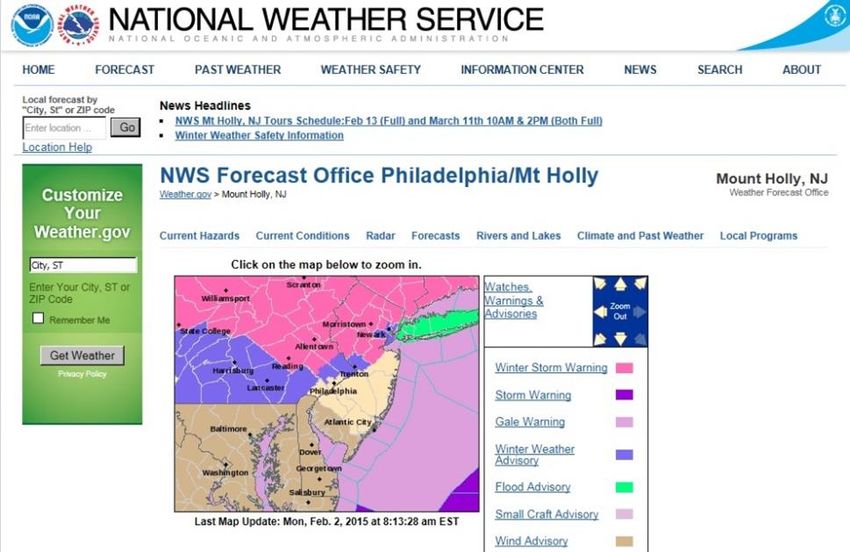
Average Seasonal Snowfall at PHL
               (Past 10 Winters; inches)

2019-2020: 0.3
2018-2019: 17.1
2017-2018: 29.8
                                    • An even split
2016-2017: 15.0                       between above
2015-2016: 27.5                       and below
2014-2015: 27.0                       average years!
2013-2014: 68.0                     • Last winter was
                                      the second
2012-2013: 8.3
                                      least snowy on
2011-2012: 4.0                        record!
2010-2011: 44.0
Avg (1981-2010): 22.4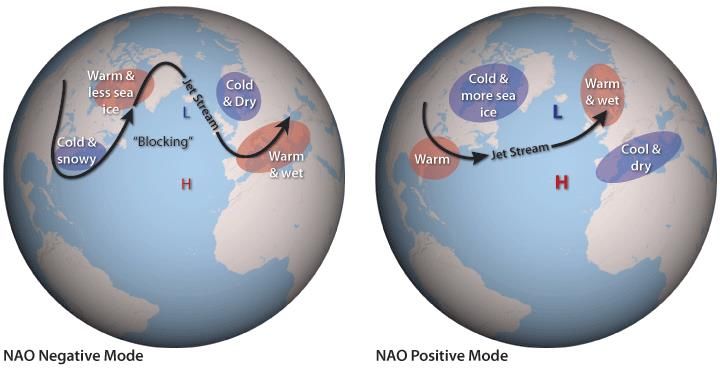
Seasonal Snowfall for
                                                                                Philadelphia, PA (1973–2020)
                             80                                                                                                                        78.7

                             75

                             70                                                                                                                                        68.0
                                                                                                         65.5
                             65
                                  1981-2010 Normal Seasonal Snowfall: 22.4"
                             60
                                           54.9
                             55
Seasonal Snowfall (inches)

                             50
                                                                                                                                46.3
                                                                                                                                                            44.0
                             45
                                                40.2
                             40
                                                              35.9
                             35
                                                                                                                                       30.4
                             30                                                                                                                                               27.5 29.8
                                                                                                                         26.1                                              27.0
                                                         25.4              25.7
                                                                                               24.3                                                  22.9
                             25                                                                   23.1

                             20 20.8                            21.6                                                  21.0
                                                  20.9                                                                                    19.5
                             15       17.5                                                                                         18.0
                                         18.7          15.4          16.516.4         17.0                                                                                             17.1
                                   13.6                                         15.0     14.6              12.9                                                                 15.0
                             10                                                                                   12.5                        13.4
                                                                                   11.2
                                                                                                     9.8
                                                                                             4.7                                                                     8.3
                              5
                                                                                                                                                 6.3
                                                                                                                0.8          4.0                               4.0
                              0
                                                                                                                                                                                          0.3

                                       On average about 2 of every 3 winters feature below average
                                       snowfall. Lots of “little” years with a few “big” years!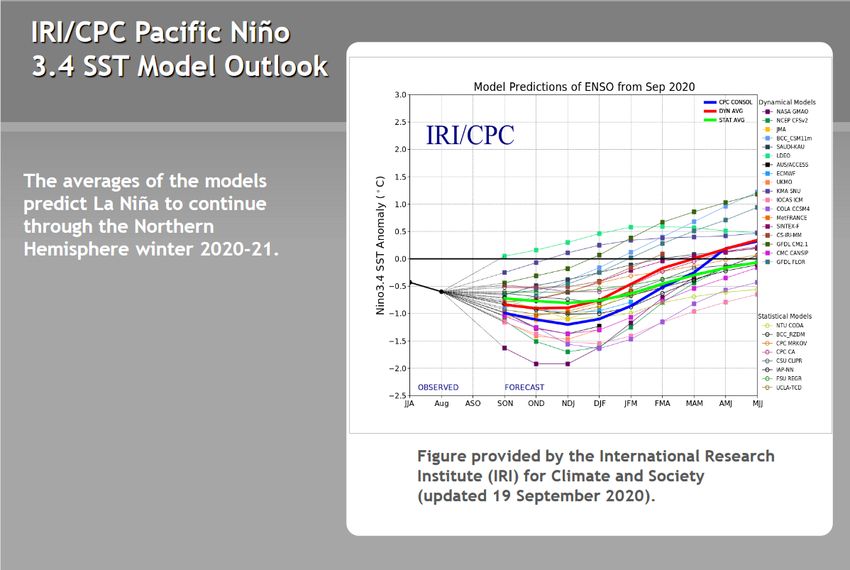
Seasonal Snowfall for
                                                                            Wilmington, DE (1979–2020)
                             80

                             75                                                                                                              72.7

                             70

                             65

                             60
                                     1981-2010 Normal Seasonal Snowfall: 20.2"            55.9                                                            56.1
                             55
Seasonal Snowfall (inches)

                             50
                                                                                                                     46.0
                             45
                                                           40.0
                             40

                             35

                             30                                                                                             26.9                27.0                    28.0
                                         24.925.1                               25.4                                                                             25.4
                             25                                                                                                                               23.4
                                                                                                                               22.1
                                                                                                          20.3                                                             20.5
                             20
                                                                     19.9                                               18.8
                             15                                                    17.7
                                  15.9          14.915.614.2                                 15.7                                        16.1
                                                               14.7
                             10      12.1                                13.1                                 12.6                 12.6
                                                                  11.0
                                                                                       8.3              8.5                            9.2                          9.0
                              5
                                                                            3.5                     T            2.4                                5.2 5.2
                              0
                                                                                                                                                                               0.9
1981-2010 Snowfall Climatology
            Philadelphia                                         Wilmington
                # of Days      Inches of                             # of Days   Inches of
   Month                                                Month
                it Snows       Snowfall                              it Snows    Snowfall
  November         0.2            0.3                  November         0.2         0.4
 December          1.8            3.4                  December         2.0         3.4
  January          4.4            6.5                  January          4.3         5.9
  February         3.6            8.8                  February         3.6         8.3
   March           1.8            2.9                   March           1.3         1.9
    April          0.4            0.5                    April          0.4         0.3
Annual Total      12.2           22.4               Annual Total       11.8        20.2
                                           # of Days     Inches of
                               Month
             Dover                         it Snows      Snowfall
                              November        0.0            0.2
                             December         0.9            2.9
                              January         2.2            4.6
                              February        1.9            7.7
                               March          0.3            0.3
                                April         0.0            0.0
                            Annual Total     5.3            15.7
1981-2010 Snowfall Climatology
Seasonal Forecasting:
 A Sample of Major Indexes and Patterns
    Used to Make Seasonal Forecasts

• ENSO (El Niño Southern Oscillation)
• NAO/AO (North Atlantic/Arctic Oscillation)
• Warm Octobers/Novembers (if both are warm,
 winter tends to be warm)
• Local Research and Analogs
• Computer Models
Current ENSO Status:
La Nina
SSTs are below average across the central and eastern Pacific near the equator. La
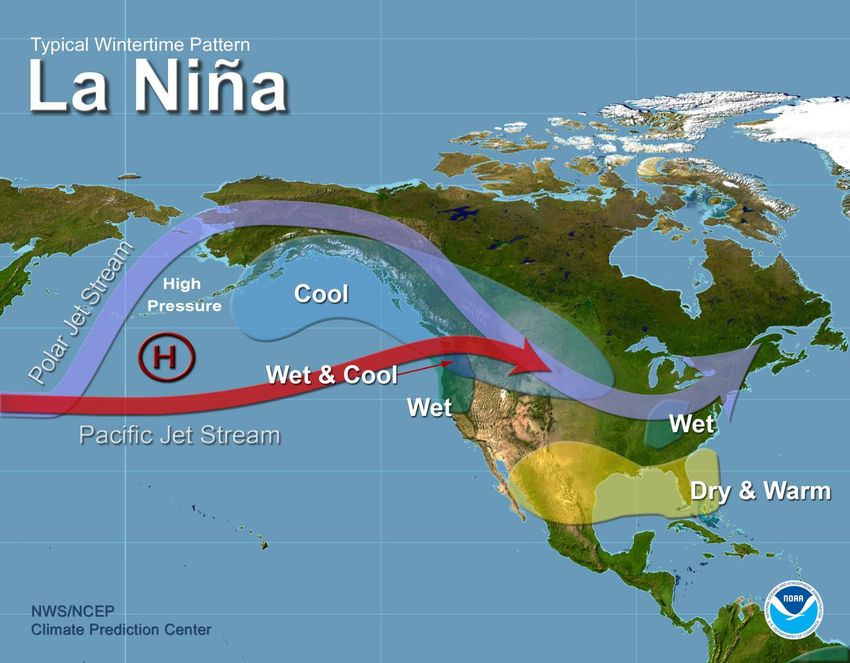
Nina conditions are present and expected to continue.Multi-Model ENSO Outlook
Typical La Nina Weather Pattern
North Atlantic Oscillation
• The North Atlantic Oscillation (NAO) is a climatic phenomenon in
  the North Atlantic Ocean of fluctuations in the difference of
  atmospheric pressure between the Icelandic low and the Azores
  high. Changes in strength and position of the Icelandic low and the
  Azores high control the strength and direction of westerly winds and
  storm tracks across the North Atlantic.
• A negative NAO is one of the best predictors for an East Coast
  trough (dip in the jet stream). This dip leads to colder temperatures
  and a greater threat of nor’easters.
• Can’t be used for seasonal forecasting because the NAO is difficult
  to predict more than two weeks in advance. But it can and should
  be used for a shorter term forecast!
North Atlantic Oscillation
What has the recent pattern been?
      Upper Level “Height” anomalies

                           L
         H
                                       H
What do the Models Have for this Winter?
Model precipitation: Near AverageWhat do the Models Have for this Winter?
Model precipitation: Near AverageWhat do the Models Have for this Winter?
Model precipitation: Below AverageWhat do the Models Have for this Winter?
Model precipitation: Near AverageNOAA 2020-21 Winter Outlook
(Issued October 2020)So What Does This Mean? • The Climate Prediction Center (CPC) forecast, computer models, and local research support above average temperatures this winter. • Potential for lengthy stretches of above normal temperatures with brief but sharp cold shots. Less ice on the rivers as a whole. • Near average precipitation is expected based on a blend of the model output and CPC guidance, but snowfall is more likely to be below normal due to the above average temperatures. • There are many uncertainties involved in seasonal forecasting, much more than a 7 day forecast. This is especially true for snowfall. In our area, one or two storms can make an entire season!
Key Winter Weather Websites
NWS Mount Holly Winter Webpage:
www.weather.gov/phi/winter

Briefings:
https://www.weather.gov/media/phi/current_briefing.pdf
(Also emailed to core partners)

Hazardous Weather EM Dashboard:
https://www.weather.gov/phi/emerman
Sample Product: Snowfall Forecast*
Uncertainty in Snowfall
Forecast:
As with previous storms this
winter, uncertainty exists in
the snowfall accumulation
forecast owing primarily to
critical timings of transitions
between snow, ice, and rain.
While confidence in exact
snowfall totals is medium,
confidence is higher on a
period of significant and
widespread travel impacts,
especially from mid to late-
morning through the early
evening.
*This product represents our official forecast for expected snowfallSample Product: Probabilistic Snowfall Forecast*
Low End Potential High End Potential
9 in 10 (90%) Chance of Higher 1 in 10 (10%) Chance of Higher
Snowfall Than Depicted Below Snowfall Than Depicted Below
*Goal this year: Less focus on these maps, more focus on descriptive impacts and uncertaintiesSample Product: Ice Accumulation Forecast*
Ice accumulation notes:
Icing of a few hundredths to
a tenth of an inch is
generally insufficient to
produce tree damage or
power outages, but any
amount of ice is capable of
creating very hazardous
road conditions.
*This product represents our official forecast for expected ice accumulationSample Product: Winter Precipitation Onset Time* *Expected start time of frozen (snow, sleet, freezing rain) precipitation
Sample Product: Coastal Flooding Map*
Minor flooding is possible with
Tuesday night’s high tide.
Moderate flooding is possible
along much of the NJ and DE
Middlesex coast with Wednesday and
Bucks
Mercer
Wednesday night’s high tide.
Monmouth
Minor flooding may reach
upper Delaware Bay and the
Ocean lower Delaware River on
Delaware Burlington Wednesday and Wednesday
night.
New Castle
Cecil This graphic shows the
Salem expected degree of flooding on
Atlantic the oceanfront, bays, and
Cumberland estuaries along the highlighted
Kent areas.
Kent
No Flooding
Caroline
Spotty Minor Flooding
Talbot
Minor Flooding
Sussex
Moderate Flooding
Major Flooding
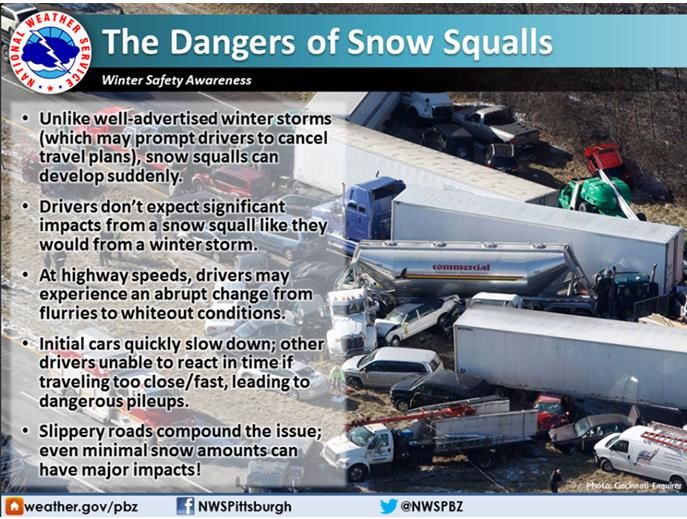
*Available in briefing packages when coastal flooding is a concernReminder: NWS now issues Snow Squall Warnings!
• Polygon-based, similar to severe thunderstorm and tornado warnings
• Three Distinct Information Segments:
• Hazard Description (i.e. white-out conditions from heavy snow and blowing snow)
Source (radar, webcams, etc)
Impact (i.e. dangerous, life-threatening travel)
• WEA – ActivatedHow to Stay in Touch • NWS Mount Holly website – www.weather.gov/phi – Detailed local forecast available going out 7 days – Hourly weather graphs • CPC website: – http://www.cpc.ncep.noaa.gov/ – Hazards assessment – 8-14 day climate outlooks – Seasonal climate outlooks
Questions?

weather.gov/phi   US National Weather Service
                                                @NWS_MountHolly
                  Philadelphia/Mount Holly
You can also read