The Social Cost of Carbon: Advances in Long-term Probabilistic Projections of Population, GDP, Emissions, and Discount Rates
←
→
Page content transcription
If your browser does not render page correctly, please read the page content below
The Social Cost of Carbon:
Advances in Long-term Probabilistic Projections of
Population, GDP, Emissions, and Discount Rates
Kevin Rennert, Brian Prest, William Pizer, Richard Newell, David Anthoff, Cora Kingdon,
Lisa Rennels, Roger Cooke, Adrian Raftery, Hana Ševčíková, Frank Errickson

Brookings Papers on Economic Activity Fall Conference
September 9, 2021
Background

 Social Cost of Carbon:

 • The social cost of carbon (SCC) is an estimate, in dollars, of the economic
 costs (or “damages”) of an incremental ton of CO2 emissions
 • The SCC underpins policy analysis across a wide range of applications in
 the federal government and elsewhere

2 Rennert et al. (2021), BPEA
Background

 The National Academies (NASEM) recommended improving the
 representation of key input variables and characterizing uncertainty

 • Integrated modular framework
 • Socioeconomics
 • Physical climate system
 • Damage functions
 • Discounting approach

3 Rennert et al. (2021), BPEA
Background

 The Biden administration is currently updating its SCC estimation
 methodology to incorporate best available science, with
 updated estimates anticipated for January 2022

4 Rennert et al. (2021), BPEA
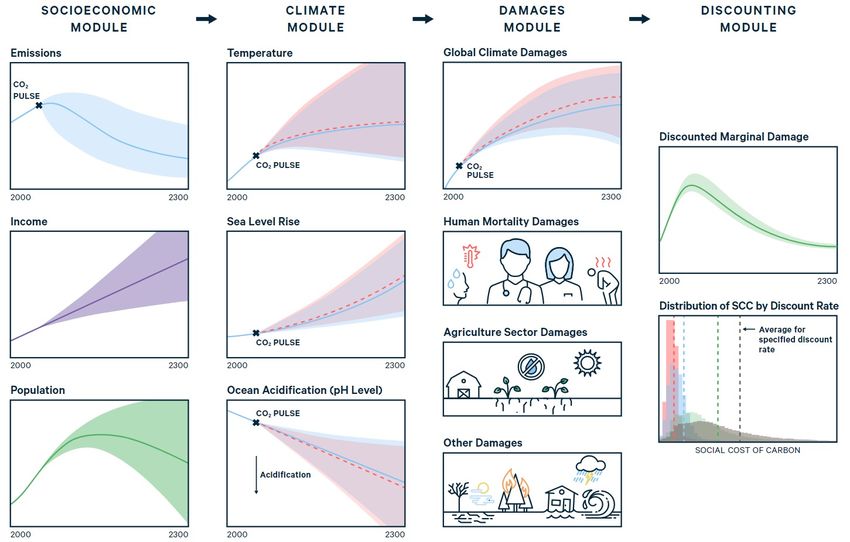
Modular framework for calculating the SCC

5
Modular framework for calculating the SCC

6
SCC calculations present challenging
 requirements for socioeconomic projections
 • Very long time-horizon
 • CO2 is very long lived in the atmosphere (centuries
 to millennia)

 • Complex uncertainty
 • Future damages will depend on improvements in
 technologies, mitigation policies, regional/sectoral
 shares of the global economy
 • Adaptation levels should be tied to GDP

 • Regional detail
 • Effects of climate change vary regionally, so ideally
 socioeconomics would provide regional detail to
7
 support damage calculations
RFF Socioeconomic Projections (RFF-SPs)
 address these challenges
 • RFF-SPs:
 • Are multi-century, probabilistic projections of country-level population and GDP
 per capita, and global emissions
 • Account for future policies and dependencies between the variables
 • Incorporate both statistical and structured expert judgment methods to account
 for the extended time horizon
 • Fully implement near-term NASEM recommendations

 • The Shared Socioeconomic Pathways* (SSPs) offer a natural point of comparison
 • The SSPs were designed to inform the IPCC and provide (non-probabilistic)
 socioeconomic scenarios with associated narratives to 2100

 *Riahi et al. 2017, Kikstra et al. 2021
8 Rennert et al. (2021), BPEA
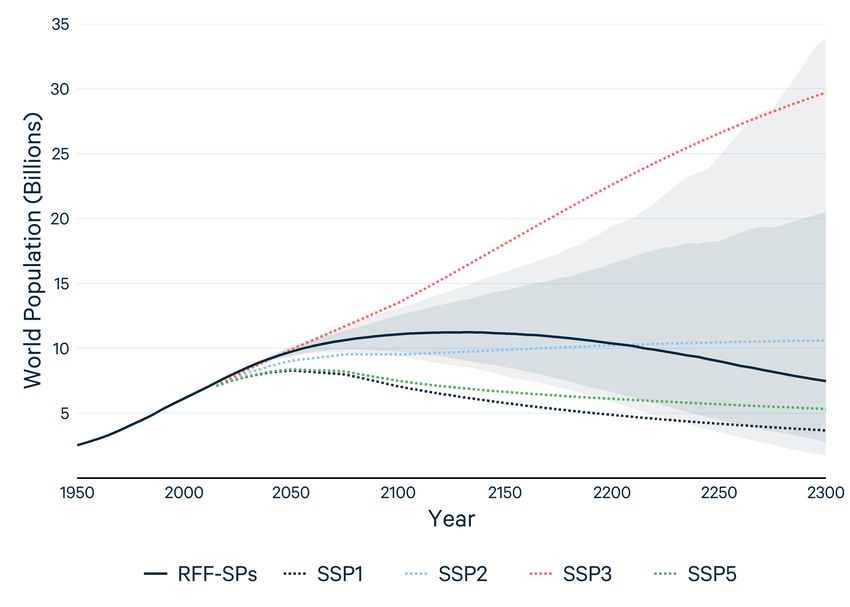
RFF-SPs: Population (country level)
• Methods: Extend the fully probabilistic
 statistical approach used by the UN for
 official population forecasts,
 incorporating improvements from a
 panel of ten leading demographers*

• Results: Median world population peaks
 at ~11B mid-next century, declines to
 ~7.5B in 2300, but with wide uncertainty
 (95% interval from 2.3 to 25.8 billion)

• Median is most comparable to SSP2;
 uncertainty range is significantly
 narrower than SSP spread through 2200
 Shaded areas represent 90% and 98% prediction intervals

 *Raftery and Ševčíková (forthcoming)
9
 Rennert et al. (2021), BPEA
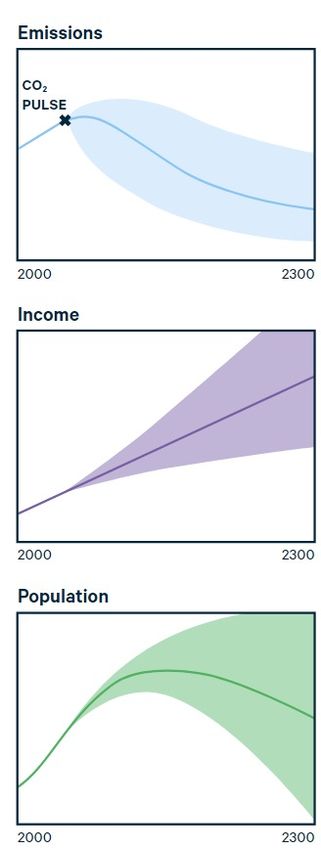
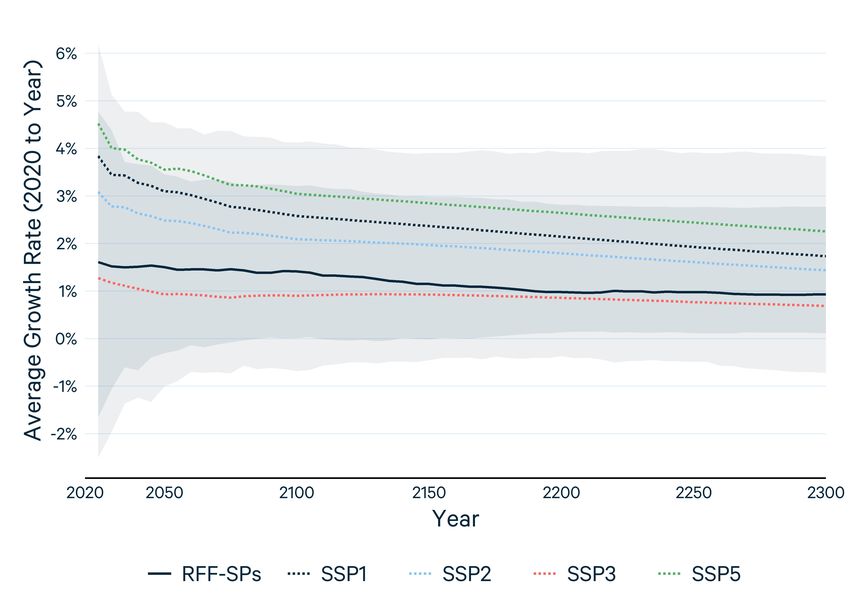
RFF-SPs: Economic Growth (country level)
• Methods: Country-level econometric
 growth projections to 2300*,
 constrained using expert uncertainty
 from RFF Economic Growth Survey

• Results:
 • Median projection from experts shows
 much lower long-run growth than
 statistical model
 • Both sources view extremely high
 (>4%) and low (~0%) long-run growth
 as highly unlikely, but possible

• SSPs all fall within 90th percentile range
 of RFF-SPs; do not fully span the low Shaded areas represent 90% and 98% prediction intervals
 end of the range
 * Müller, Stock, Watson (forthcoming)
10
 Rennert et al. (2021), BPEA
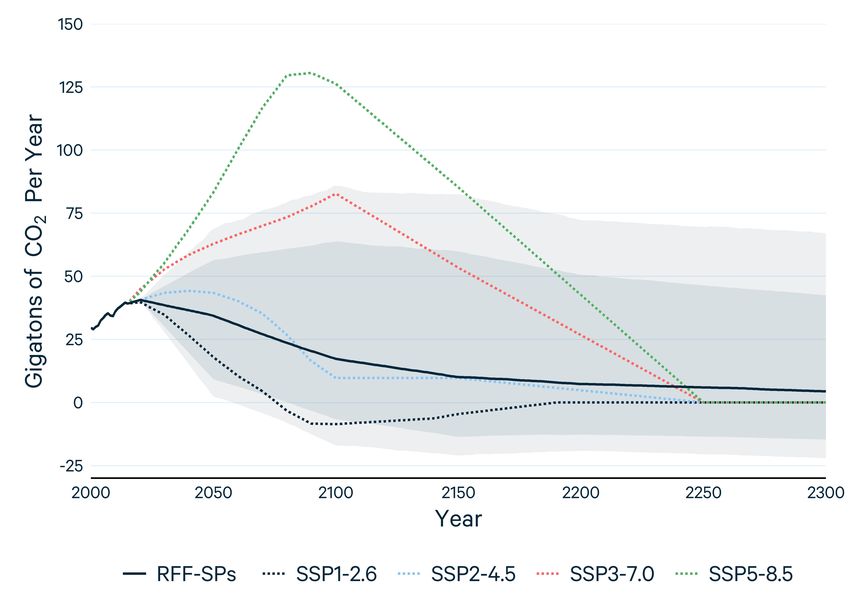
RFF-SPs: Emissions (global)
 • Methods: RFF Future Emissions Survey
 quantified uncertainty for 4 categories of
 future emissions, including uncertainty on
 future policy. CO2 distributions were
 conditioned on future economic growth.

 • Results: Median projections indicate ~60%
 reduction of CO2 by 2100, with wide
 uncertainty, including net-zero emissions.

 • SSPs 1 and 3 are outliers through 2100
 compared with RFF-SPs, SSP5 is well outside
 the range. Requirement for all SSPs to go to
 zero emissions during 2100-2250 is generally
 inconsistent with expert projections. Shaded areas represent 90% and 98% prediction intervals

11 Rennert et al. (2021), BPEA
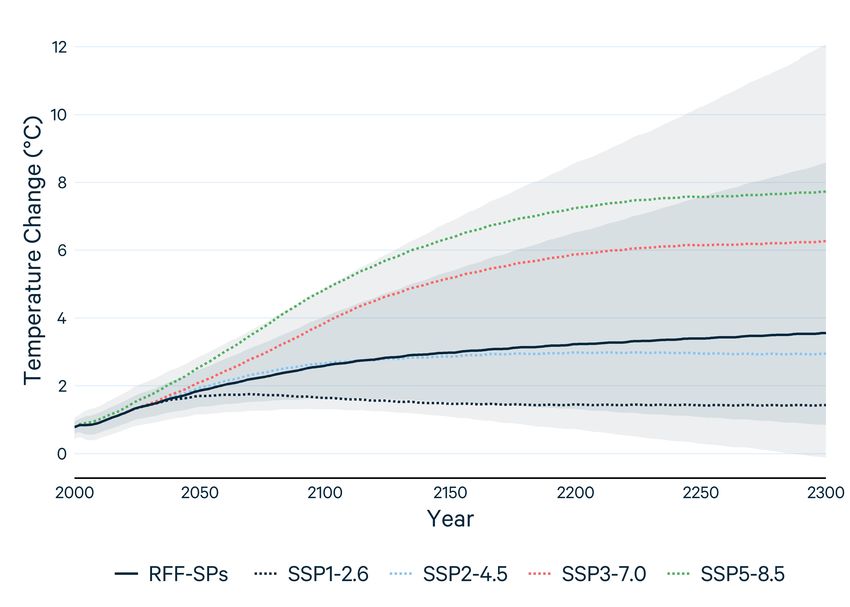
Temperature projections using RFF-SPs
• Methods: Emissions from RFF-SPs were
 sampled and used as an input to the FaIR 2.0*
 climate model

• Results:
 • Median temperature pathway ~3º C increase
 from pre-industrial level by 2100, continues to
 increase to 2300
 • ~10% chance of staying below 2º C by 2100;
 negative emissions allow for pathways that
 peak then decline

• SSP temperature pathways roughly span RFF-
 SP range through 2150, but narrow as SSP
 emission pathways go to zero (by construction) Shaded areas represent 90% and 98% prediction intervals

12 Rennert et al. (2021), BPEA * Leach et al. 2021
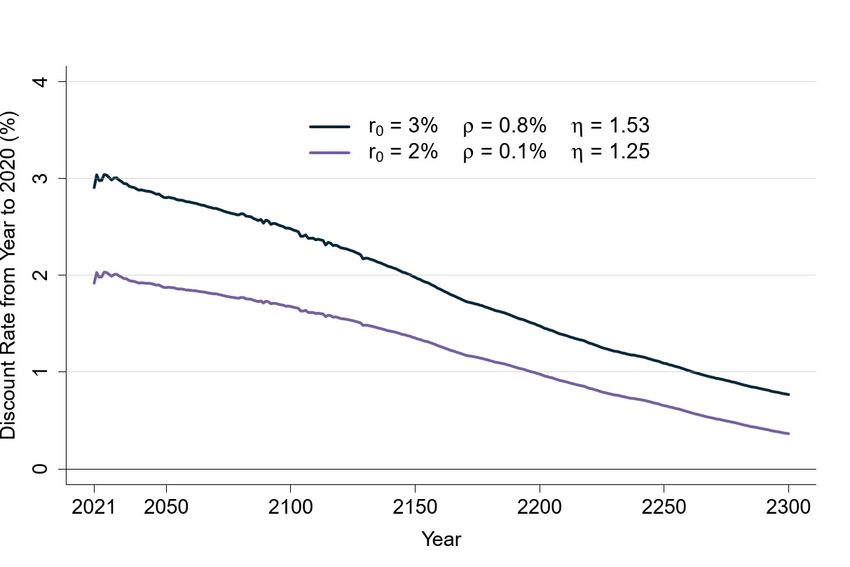
Stochastic discounting with growth: = +
• NASEM recommendations:
 • Discount rate should be consistent with policy
 rates (e.g., 2-3%) in the near term while also
 linked to growth uncertainty in the long term

• Methods:
 • Calibrate and parameters to match near-
 term rates (e.g., 2-3%) while also reconciling
 evidence on long-run interest rate behavior
 (Bauer & Rudebusch 2021) and economic
 growth uncertainty (MSW 2019)

• Results:
 • Empirically calibrated and values for use
 in estimating the SCC, linking discounting to
 growth
 13 Rennert et al. (2021), BPEA
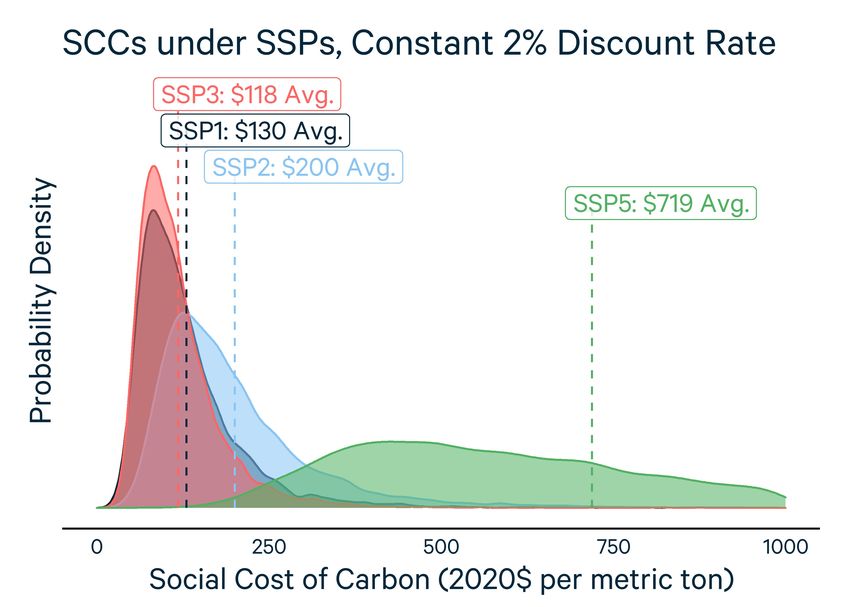
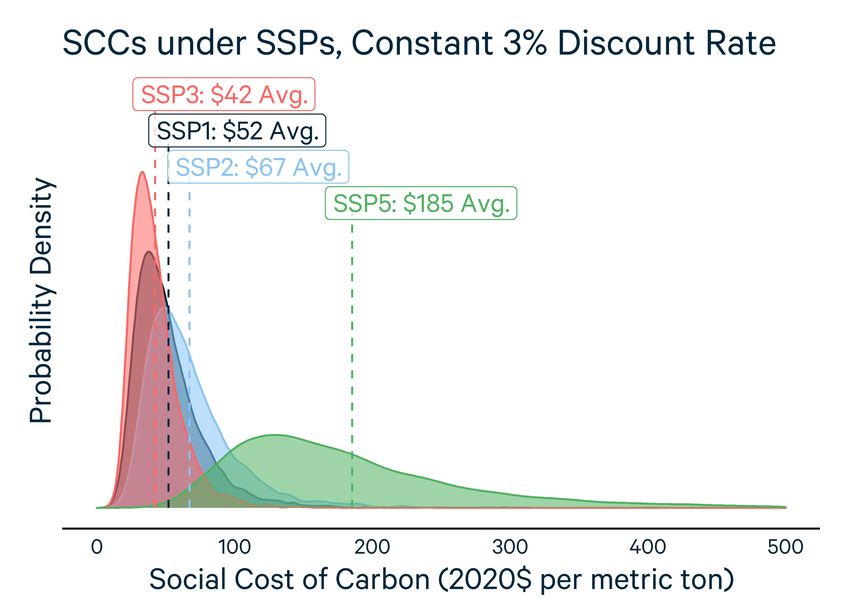
Illustrative SCCs in 2020, with DICE damage
function and FaIR climate model

14 Rennert et al. (2021), BPEA
Illustrative SCCs in 2020, with DICE damage
function and FaIR climate model
 IWG 2020 SCC with Constant Rate
 Discounting (2020$/metric ton CO2)

 Model 3% 2%

 DICE 46 112

 FUND 23 68

 PAGE 83 182

 Average of
 51 121
 models

15 Rennert et al. (2021), BPEA
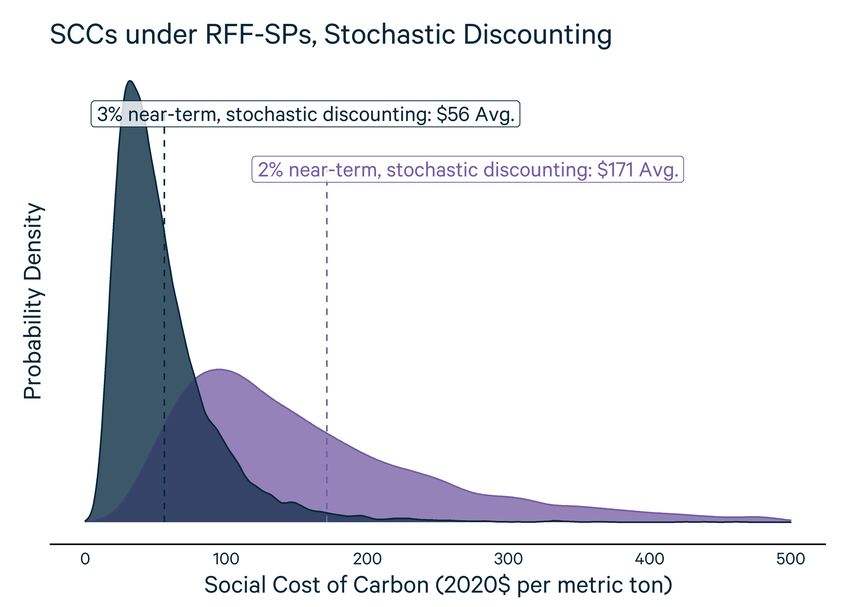
Illustrative SCCs in 2020, with DICE damage
function and FaIR climate model

16 Rennert et al. (2021), BPEA
Conclusions
 • Socioeconomic uncertainty has a substantial impact on the SCC
 • Conceptually and practically important to consider the full distribution of future possible
 paths for population, GDP per capita, and emissions
 • RFF-SPs provide probabilistic projections that meet all NASEM recommendations
 • For some, but not all, variables, the SSPs span a comparable range of uncertainty to the RFF-
 SPs, but should not be considered equally likely
 • No single SSP reflects central expectations across all variables
 • Stochastic, growth-linked discounting is critical for SCC estimation, especially
 amidst a full representation of socioeconomic uncertainty
 • Illustrative SCC results that implement NASEM recommendations for 3 out of 4
 modules (socioeconomic, climate, discounting) show a considerable increase
 • Implementation of final module (damages) rapidly nearing completion on
 timeframe relevant for IWG consideration

17 Rennert et al. (2021), BPEA
Thank you!

Social Cost of Carbon Initiative
 rff.org/SCC
You can also read