Property Market Update - Kelvin Davidson Senior Property Economist March 2021
←
→
Page content transcription
If your browser does not render page correctly, please read the page content below

Property Market Update
Kelvin Davidson
Senior Property Economist

March 2021
Outline for today
Recent economic & property data – momentum still strong

What will happen in 2021? The year of property politics

Outline for today
Recent economic & property data – momentum still strong

What will happen in 2021? The year of property politics

Housing has got very political

18 July
    © 2019CoreLogic, Inc. All Rights Reserved.   3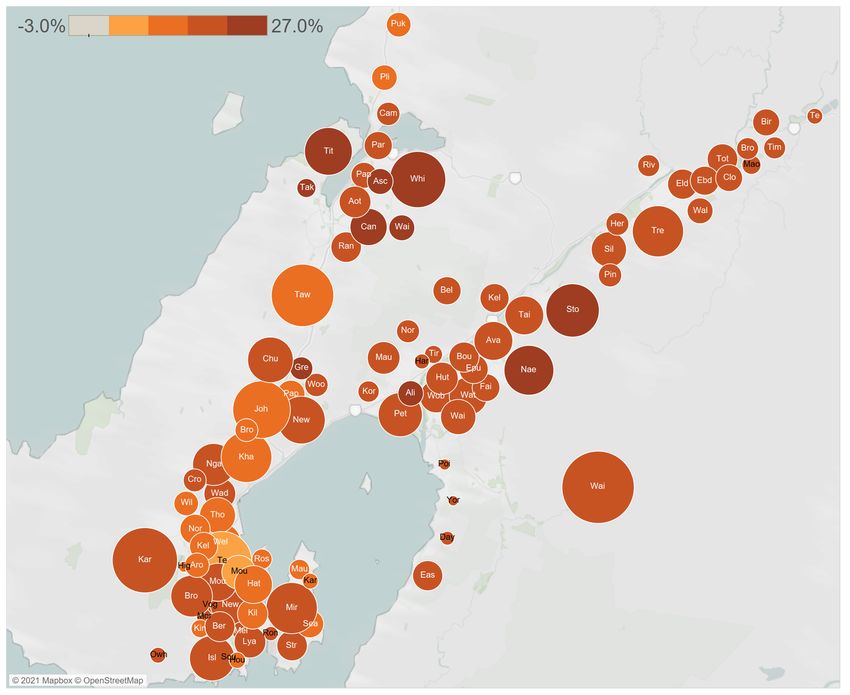
Government announcement could be a line in the sand
  Much tougher for mortgaged investors, but new-builds still a clear option
   ▪      SIGNIFICANT: Investors can’t offset interest against income anymore to lower tax – immediate for new buyers, phased
          over next four years for existing – changes sums by $’000s per year

   ▪      LESS IMPORTANT: Brightline Test extended, FHB income and price caps raised, extra supply measures (Kainga Ora funding,
          infrastructure development)

   ▪      Bottom line:
            – Interest deductibility change looks out of synch with other business investments
            – But whether it’s right or wrong, there were no ‘carrots’ for other investments
            – Suspect investors generally continue to buy and hold property – just less profitable, and/or go new-build
            – But still an impact - long-time landlords (with more equity) may buy off newer investors
            – A near term psychology/perception shift too; Government relentlessly chasing property
            – Electoral cycle; National could well campaign on reversing these changes

18 July
    © 2019CoreLogic, Inc. All Rights Reserved.                                                                                     4
Sales volumes have been solid,
but a slowdown is looming

Sales high again in February, driven by Auckland
But low listings could be a restraint, and some sales rushed to beat LVR changes

                                  NZ sales volumes                  Change in sales in three months to February
                                                                               compared to year ago

                                                     Source: CoreLogic

18 July
    © 2019CoreLogic, Inc. All Rights Reserved.                                                                    6
Total listings lifting, but still low
New weekly flows started slowly in 2021

            NZ stock of existing listings on the market                  NZ weekly flow of new for-sale listings

                                                     Source: CoreLogic

 18 July
     © 2019CoreLogic, Inc. All Rights Reserved.                                                                    7
Property values have soared, on
the back of tight supply/demand
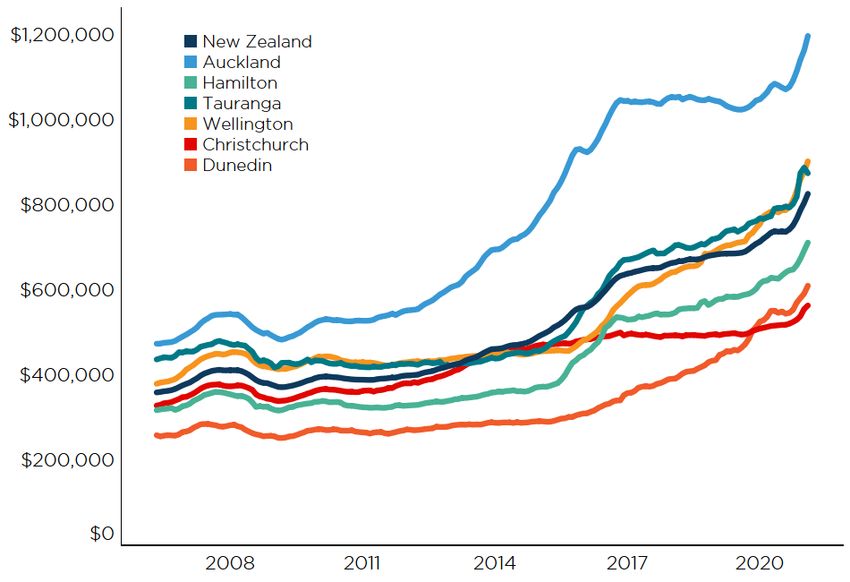
Property values growing quickly again
15% rise in year to Feb - strong demand hitting up against low listings
Change in national average property values Average property values – main centres
Source: CoreLogic
18 July
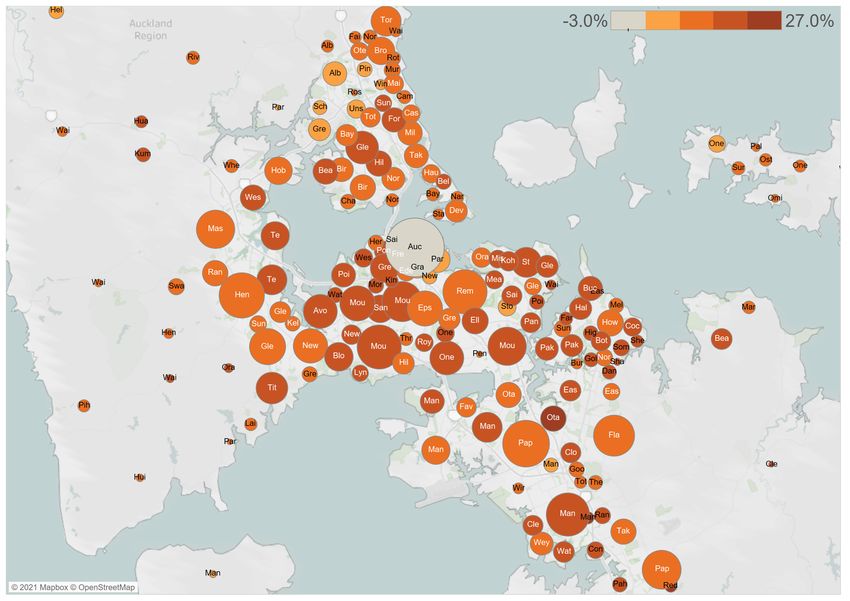
© 2019CoreLogic, Inc. All Rights Reserved. 9Broad-based upturn since lockdown
Suburb median value % change since March 2020
Auckland Wellington
18 July
© 2019CoreLogic, Inc. All Rights Reserved.
Source: CoreLogic 10Mortgaged investors active, but first home buyers waning?
Investors & FHBs not selling anything, movers sitting tight = listings issues
Buyer Classification Buyer Classification
New Zealand Auckland
Source: CoreLogic
18 July
© 2019CoreLogic, Inc. All Rights Reserved. 11Strong contributor is of course low interest rates
Investors ‘searching for yield’ – LVR removal played a role too (but no more)
Lending to investors Breakdown of existing mortgage debt
50%
1,600 18% 46%
45%
1,400 16%
Investor $ flows >70% LVR (LHS)
40% Owner occupiers
High LVR investors % of total lending (RHS) 14%
1,200
35% Investors
12%
1,000
30%
10%
800 25%
8%
600 19%
20%
6% 16%
400 15%
4%
10%
200 10%
2% 5%
5% 3%
0 0%
Jan 2019 Jul 2019 Jan 2020 Jul 2020 Jan 2021 0%
Floating Fixed < 1 year Fixed > 1 year
Source: RBNZ
18 July
© 2019CoreLogic, Inc. All Rights Reserved. 12Still many areas where housing ‘need’ has outpaced stock change
Hence we need high levels of dwelling consents to continue
Required extra housing minus stock change 2015-20
Source: CoreLogic
18 July
© 2019CoreLogic, Inc. All Rights Reserved. 13It’s got political quickly
Some of the economic ‘headwinds’ are losing intensity
Unemployment rate fell from 5.3% to 4.9% in Q4 2020

                              NZ Activity Index and GDP                                                     Stocks and flows of mortgage
                                                                                                               payment deferrals ($m)
10%
                                       Annual % change                                      25,000                                          Weekly new applications
 5%                                                                                                                                         Total stock
                                                                                            20,000                                          Deferral exits
 0%
                                                                                            15,000
 -5%
                              NZ Activity Index (advanced 2 months)                         10,000
-10%                          GDP
                                                                                             5,000
-15%

                                                                                                0
-20%

                                                                                            -5,000
-25%
                                                                                                Mar 2020   May 2020   Jul 2020   Sep 2020        Nov 2020       Jan 2021
    2012                   2014                    2016       2018    2020

                                                                             Source: RBNZ

  18 July
      © 2019CoreLogic, Inc. All Rights Reserved.                                                                                                                           15
But the ownership ‘divide’ has got political quickly ….
‘Comfortable’ for existing owners, very hard for those saving a deposit
NZ: value to income ratio and NZ: years to save a deposit and rent to
mortgage payment affordability income ratio
8 70% 10 35%
9
7 60%
8 30%
6
50% 7
5 6 25%
40%
4 5
30% 4 20%
3
Value to income ratio (LHS) 3 Years to save a deposit (LHS)
20%
2 Value to income average Deposit years average
2 Rent to income ratio (RHS) 15%
Share of income required for repayments (RHS) More affordable 10%
1 1 Rent to income average
Repayments average More affordable
0 0% 0 10%
2004 2006 2008 2010 2012 2014 2016 2018 2020 2004 2006 2008 2010 2012 2014 2016 2018 2020
Source: CoreLogic
18 July
© 2019CoreLogic, Inc. All Rights Reserved. 16…. hence the rules are tightening for investors
Interest-only loan restrictions could be next cab off the rank (May)
Interest only lending as % of Source: RBNZ % of new lending at debt to income ratio
stocks and flows greater than 5
50%
50%
45%
45% 42%
39% 40%
40%
35%
35%
30%
30%
25% First home buyers
25% 22%
20% Other owner occupiers
20%
15%
15% 13%
10%
10%
5%
5%
0%
0%
Jun 2017 Dec 2017 Jun 2018 Dec 2018 Jun 2019 Dec 2019 Jun 2020
Owner-occupier stock Owner-occupier flow Investor stock Investor flow
• Government emphasis is on equity – either to satisfy LVR requirements and/or reduce your interest
payments (so that deductibility is less of an issue anyway)
18 July
© 2019CoreLogic, Inc. All Rights Reserved. 17Could rents rise? Maybe ….
But some tenants doing it hard, and income is still an anchor
18 July
© 2019CoreLogic, Inc. All Rights Reserved. 18Near-term: ‘more of the same’ Second half of year: slowdown
2021 is already the ‘year of
                                                                  property politics’
                                                                  ▪ Near-term momentum still upwards (tight
                                                                    listings, low mortgage rates), but bear in mind
                                                                    ‘lost summer’ of tourism
                 Annual sales volumes (incl. forecast)
160,000                                                           ▪ Some sales have been ‘brought forward’ - and
140,000
                                                                    listings could restrain activity too
120,000
                                                                  ▪ So, with LVRs now also back in place, and
100,000
                                                                    potential psychology effects of Government
 80,000
                                                                    measures, second half of the year may be
 60,000
                                                                    slower for sales, and price growth to cool too
 40,000

 20,000                                                           ▪ Affordability is also a problem, and I-O lending
     0                                                              limits probably on the way
           1995
           1996
           1997
           1998
           1999
           2000
           2001
           2002
           2003
           2004
           2005
           2006
           2007
           2008
           2009
           2010
           2011
           2012
           2013
           2014
           2015
           2016
           2017
           2018
           2019
           2020
           2021
                                                                  ▪ ‘Real’ effects of Government measures (esp.
                                              Source: CoreLogic     interest deductibility) a slower-burner – might
                                                                    change buyer mix, rather than drop prices

     18 July
         © 2019CoreLogic, Inc. All Rights Reserved.                                                                    20
Let’s discuss Kelvin Davidson Senior Property Economist Kelvin.davidson@corelogic.co.nz @KDavidson_CL
You can also read