Impacts of climate change in Italy - Paola Faggian June 18th, 2018 - IAT
←
→
Page content transcription
If your browser does not render page correctly, please read the page content below
June 18th, 2018

Impacts of climate change in Italy

                           Paola Faggian
Ricerca sul Sistema Energetico
develops applied researches in the electro‐energetic sector
                                                                     www.rse‐web.it
In the Sustainable Development and Energy Sources Department (SFE) some activities
involve:

    o application of meteorological modeling to assess renewable energy
      capability;
    o forecast of the meteorological variables influencing short and long term
      management of the electrical system;
    o application of meteorological and chemical modeling for the assessment
      of the electricity system’s impact on the air quality;
    o climatic changes analysis to investigate their impacts on the electro‐
      energy system.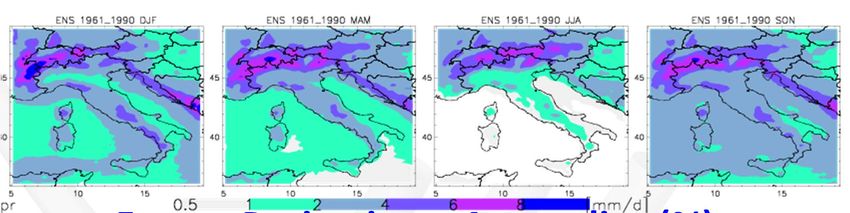
Outline
• Climate Changes (CC): what is happening?
• Monitoring Green‐House‐Gases (GHGs)
• Analyzing CC: Variables and Data‐sets
• Elaborating Future projections over Italy

References
Intergovernmental Panel of Climate Change (IPCC)
http://www.ipcc‐data.org/

Copernicus Climate Change Service (C3S)
https://climate.copernicus.eu/about‐c3s

EU Reports

Regional Climate Model (RCM) results (EU Projects)
PRUDENCE             2001‐2004
ENSEMBLES            2004‐2009
CIRCE                2007‐2010
ACQWA                2008‐2012
CORDEX (Euro‐CORDEX, Med‐CORDEX)
IPCC AR5 (2013)
Global Averages

                             European Environmental Agency
                                 EEA, 2012: 2002–2011
                                 + 0.77°C (T global)
                                 +1.3 °C (T Europe)
                                  EEA, 2015: 2005–2014
                                  + 0.82°C (T global)
                                  +1.5 °C (T Europe)
                                   EEA, 2017: 2007–2016
                                   + 0.9°C (T global)
                                   +1.6 °C (T Europe)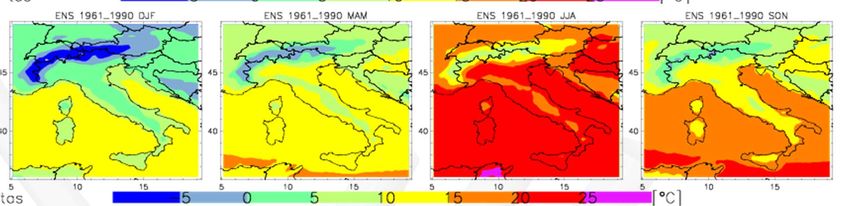
Monitoring GHGs : The Global Atmosphere Watch (GAW)
         …………………….

  WMO WDCGG DATA SUMMARY - WDCGG No. 40
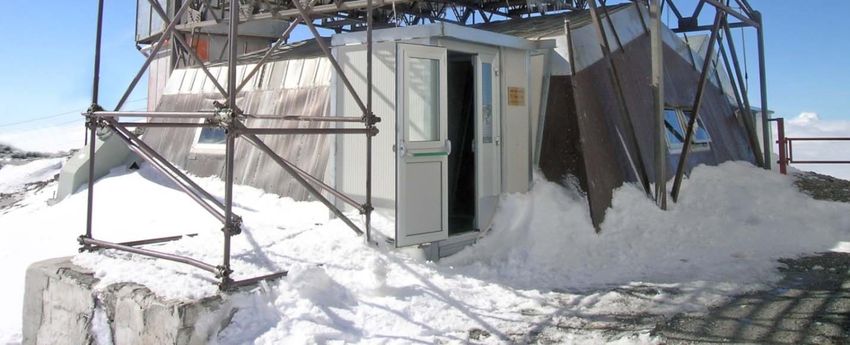
PRS
Plateau Rosa Station
OASI http://oasi.rse‐web.it/

                                                                            WMO        Greenhouse    Gas
                                                                            Bulletin, 2013. The State of
                                                                            Greenhouse Gases in the
                                                                            Atmosphere Based on Global
                                                                            Observations through 2012,
 Plateau Rosa station (WMO ID Code: PRS, 45.93°N, 7.71°E, 3480 m a.s.l.)    No. 9, 6 November 2013.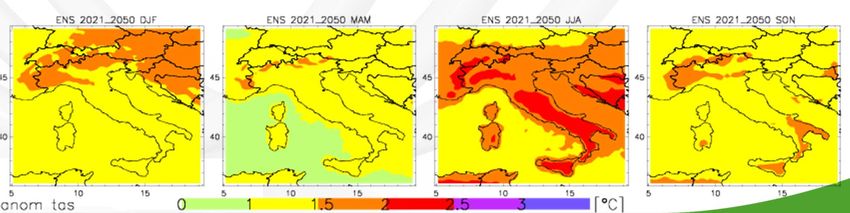
Monitoring Station Plateau Rosa
CO2 BaDS (Background Data Selection)

                                                OASI http://oasi.rse‐web.it/
GAW: The annual average increase for the past decade is about 2.1 ppm/year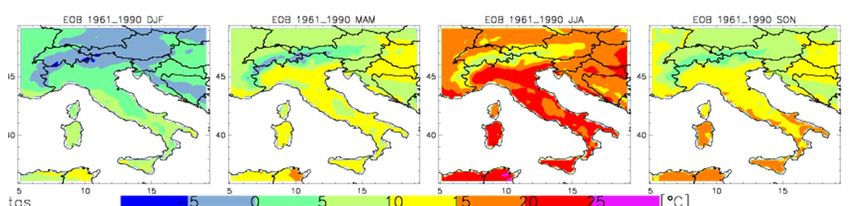
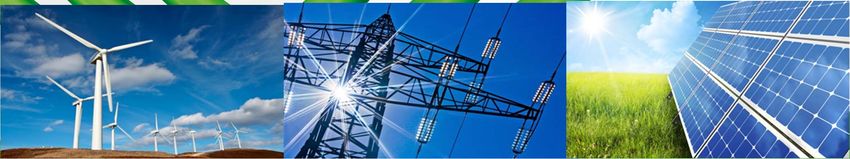
Resilience of large investments and critical infrastructures in Europe to climate change

>10 x

 6x
                                                   8.2

3x
                                         4.4

                                2.0
3.5bn €/y
                      0.5

Evolution in the 21 century of the climate hazard damages to critical infrastructures in EU28 + Switzerkand, Norway ,Iceland
Sharp decrease of return periods of multiple extreme weather events (e.g. a current 100‐year
heat wave or 20‐year flood may occur every 1 or 2 years under future climate conditions)
EEA, 2016: “The projected damage costs from climate change are highest in Southern Europe”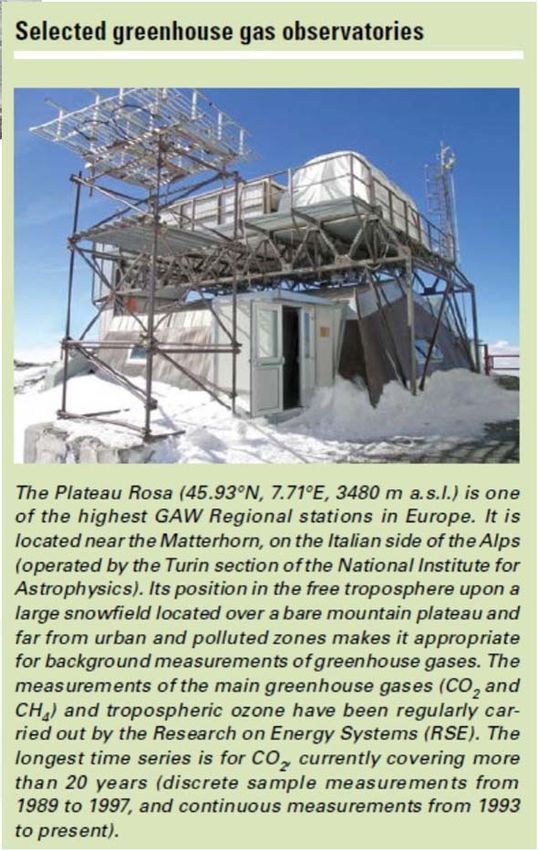
Energy Sector:
 infrastructure vulnerable to climate impacts
• Fossil power generation (loss of efficiency if temperature
  increases)
• Hydroelectric generation (loss of water supply if drought
  periods increase)
• Renewable power generation (loss of production in case of
  extreme weather events)
• Energy distribution system (reduced network distribution
  capacity if temperatures and storminess increase)
• Infrastructures (they could be damaged if a fire breaks out)
• Energy power demand (linked to weather variables, particularly
  to daily temperature)
• Analysing CC: Data‐sets
 Variables
 Air Surface Temperature
 Total precipitation
 Wind speed                        Model Data: GCMs, RCMs
Reference data (from obs)          CMIP3
                                   http://www‐pcmdi.llnl.gov
E‐OBS                              ~100 km, 1961÷2050 (SRES A2, A1B. B1)
http://eca.knmi.nl/dailydata       ENSEMBLES
0.25 x 0.25 deg, from 1961
                                   http://www.ensembles‐eu.org
                                   25 km, 1961÷2050 (SRES A1B)
MESAN (MESocale ANalysis system)
https://ecds.se/dataset)           Med‐CORDEX
5 km, 1979÷2013                    https://www.medcordex.eu/
                                   0.11 deg (~12km), 1961÷2050 (RCP4.5, RCP8.5)
SYNOP                              0.44 deg((~ 50km), 1961÷2100 (RCP4.5, RCP8.5)

                                   Euro‐CORDEX
                                   http://www.euro‐cordex.net/
                                   0.11 deg (~12km), 1961÷2100 (RCP8.5)
GCMs: CMIP3
(Faggian, 2007)
Italy
RCMs: ENSEMBLES A1B
IPCC, AR5Elaborationg Future projections over
Italy
REF: 1961‐1990 or 1971‐2000
FUT: 2021‐2050 , 2071‐2100
• Scenarios in REF period: V(REF)
• Scenarios in FUT periods: V(FUT)
• Anomalies: V(FUT) – V(REF)
• Anomalies (%): 100 * V(FUT) – V(REF) / V(REF)Winter Spring Summer Autumn
Reference Scenarios – mean temperature
E‐OBS
ENS
Future Projections: Anomalies T(FUT)‐T(REF)
ENSWinter Spring Summer Autumn
Reference Scenarios – total precipitation
E‐OBS
ENS
Future Projections: Anomalies (%)
100 ∙ P(FUT)‐P(REF))/ P(REF)
ENSEstimating fire danger over Italy in the next decades
Winter Spring Summer Autumn
Seasonal changes of the Seasonal Severity Rating (SSR, from the Forest Fire Weather
Index FWI), projected by 2021–2050 relative to 1971–2000 according RegCM4 (Med‐
CORDEX model) in RCP 8.5
(Faggian, 2018)ETCCDI indices (WMO,2009) defined by the World Meteorological Organization Expert Team on Climate Change Detection and Indices
Future projections over Italy
     F1=2021‐2050 , F2=2071‐2100
          Heat waves        Droughts    Floods
     SU                TR     CDD      R99pTOT         %
                                                      vs
                                                 REF=1971‐2000

F1

F2
CONCLUSIONS
• Climate change projections over the Mediterranean region
(with focus over Italy) point out a significant warming and
drying, especially in the warm season.
• By 2050 it is expected:
a) a mean warming of 1-1.5°C in winter , ~ 2°C in
summer
b) a warming over 2°C in extreme temperature values
c) an increases in droughts, floods and wind storms
• an exacerbation of the hazards , projected to become more
serious in the second part of the century
CLIMED http://climed.rse‐web.itThank you
Acknowledgement
This work has been partially financed by the Research Fund for the Italian Electrical
System under the Contract Agreement between RSE SpA and the Italian Ministry of
Economic Development ‐ General Directorate for Nuclear Energy, Renewable Energy
and Energy Efficiency, stipulated on July 29, 2009, in compliance with the Decree of
November 11, 2012.You can also read