Viewing Data with PCI Geomatica FreeView
←
→
Page content transcription
If your browser does not render page correctly, please read the page content below
Viewing Data with PCI Geomatica FreeView
FreeView from PCI Geomatica is a free data viewer which can be downloaded and used
to view NAIP imagery and other geospatial files. It will open the near infrared band
(Band 4), allowing the user to switch from a natural color display to color infrared, for
both Digital Ortho Quarter Quads (DOQQs) and JPEG2000 Compressed County Mosaics
(CCMs).

FreeView displays vector files (shapefiles) and will allow the user to query the attributes
for individual polygons. FreeView does not allow the user to save a project – it does what
its name implies – operates mostly as a viewer.

                                   Using FreeView
Load Data into the Viewer.

Data can be added to the viewer in several ways. One is to click the Open icon on the
main toolbar, or under the File dropdown menu.

Another method – necessary when adding imagery – is to use the Add Layer Wizard. This
option will require the user to make band assignments. In the first window of the Wizard,
the user selects the type of layer to add.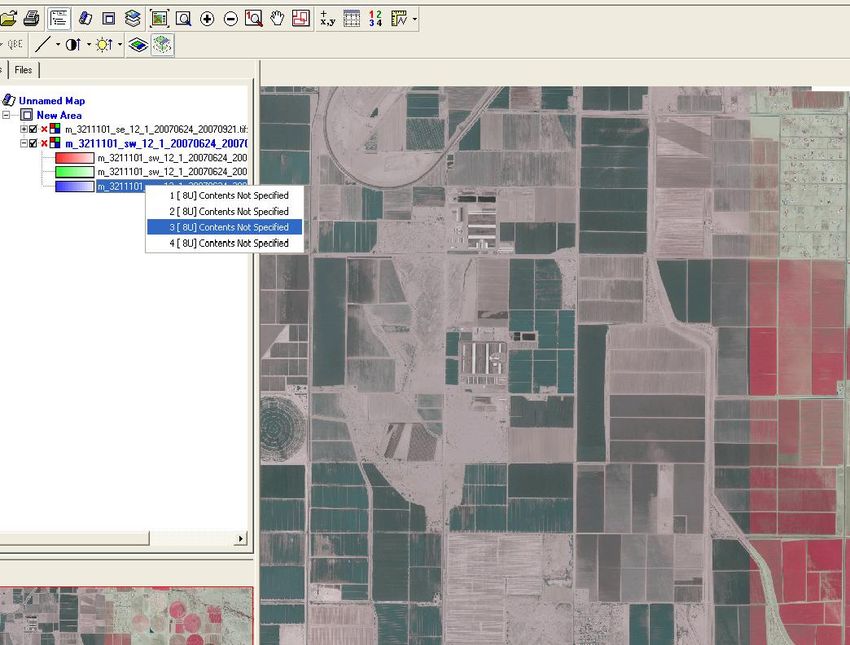
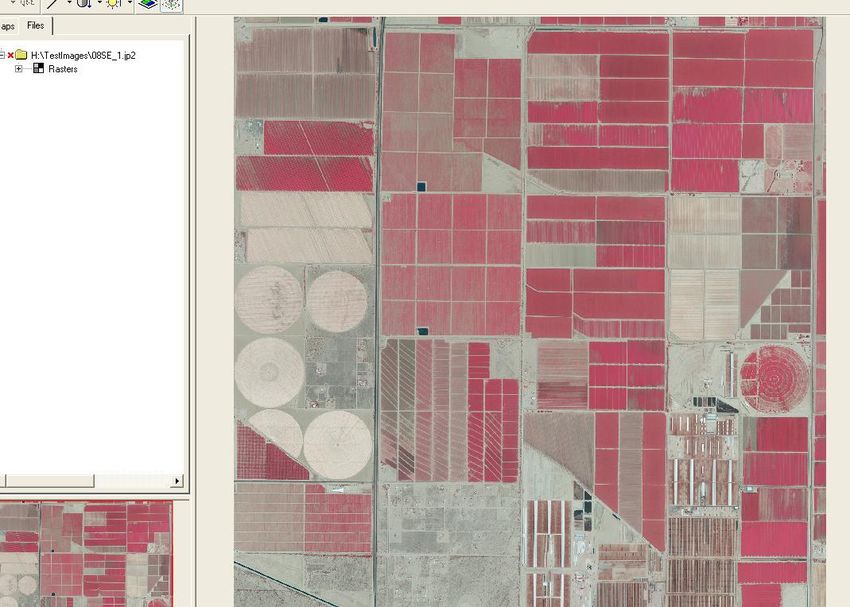
To add a shapefile, select Vector; to add a natural color or CIR image, select RGB.

Both the .shp and .sid files can be selected in this window.
The Wizard will allow the selection of more than one file, of different types, but they will
not display in the view window. Both names will appear under the Files tab, but they will
not be visible, and will not appear under the Maps tab.

Files will need to be added individually in order for them all to appear in the Map View.

A vector layer appearing under the Files tab can be opened under the Maps tab by right
clicking the file name below Vectors and selecting View.
When adding an image, the second screen of the Wizard requires band selection. In the
screen below, the bands were assigned for natural color, as Red: 1, Green:2 and Blue:3.

In the next graphic, the bands are set for a CIR image, with Red: 4, Green: 1, and Blue: 2.

To change the band assignments of an image already in the view, right click on the
individual band under the Maps tab, and change the assignment. In the graphic below, the
southwestern DOQQ in the view is being changed from CIR to natural color.
The procedure for loading a JPEG2000 image is exactly the same as for a DOQQ.
This JPEG2000 has been set up to view as a CIR image.
Removing an image is done by right clicking on the image name under either the Maps or
the Files tab, and selecting Remove. The files need to be removed individually.
Zoom in and out on the Display
There are several Zoom icons in FreeView. From left, they are:
Zoom to Overview (square with arrows at the corners moving outwards); this
zooms to the “whole page” view.
Zoom Interactive (magnifying glass); draws a rectangle around the area of interest
and zooms to it.
Zoom In (Plus sign); zooms in after clicking in the view
Zoom Out (Minus sign); zooms out after clicking on the view
Zoom to 1 to 1 Image Resolution (magnifying glass with “1”); Moves to a 1:1
resolution at the cursor location.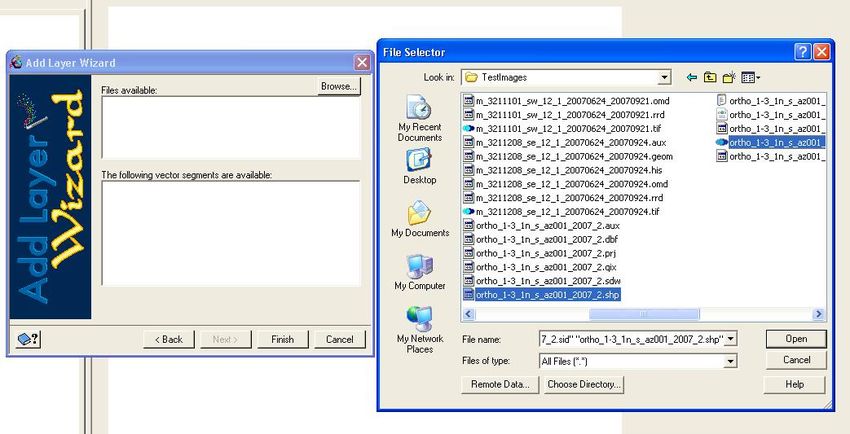
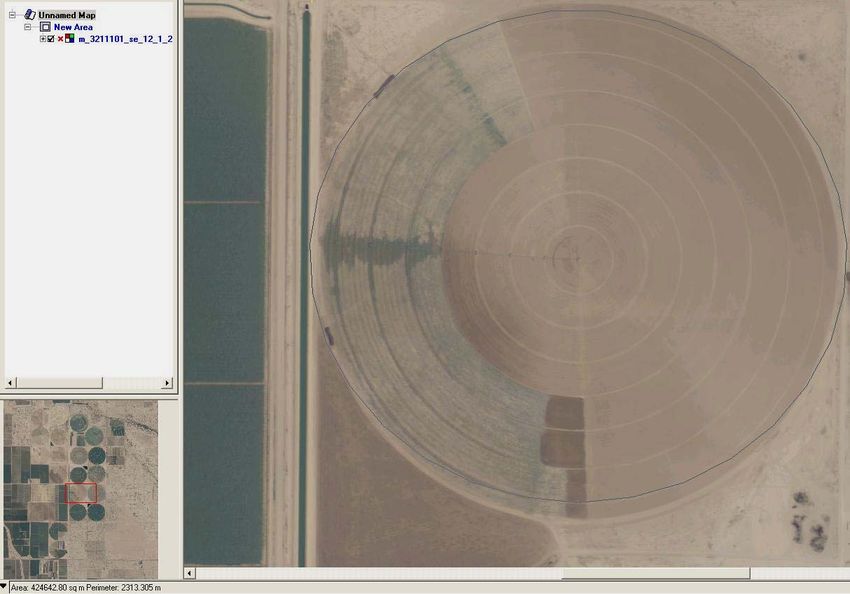
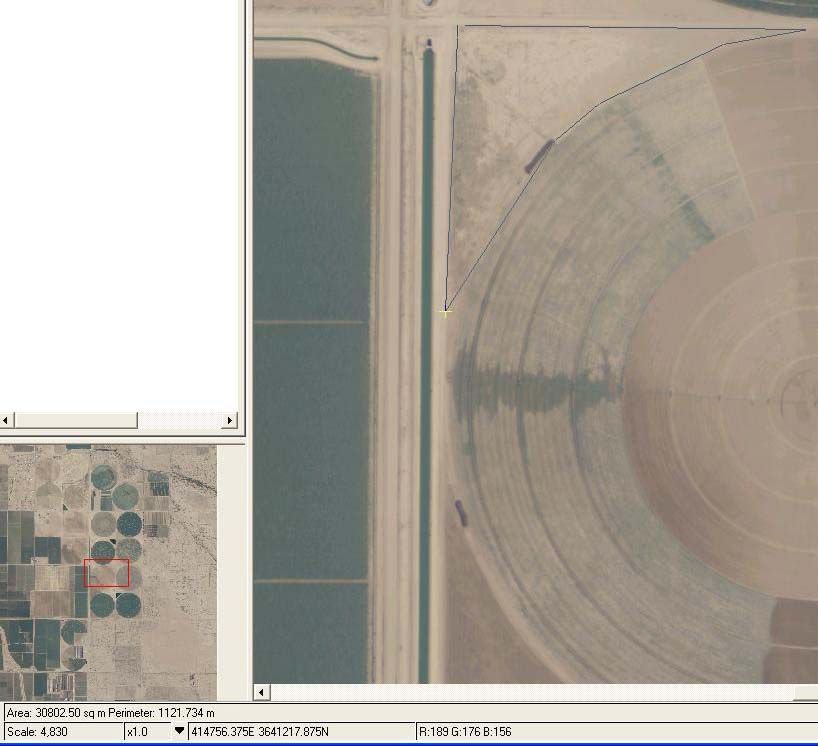
Measuring on the Map View

FreeView allows the user to measure lines and polygons, in differing units. The
measurement tool is at the far right of the toolbar.

Measuring an ellipse gives a result for the area and perimeter.
Measuring a polygon also displays area and perimeter.

Measuring a line gives an azimuth in addition to the length.
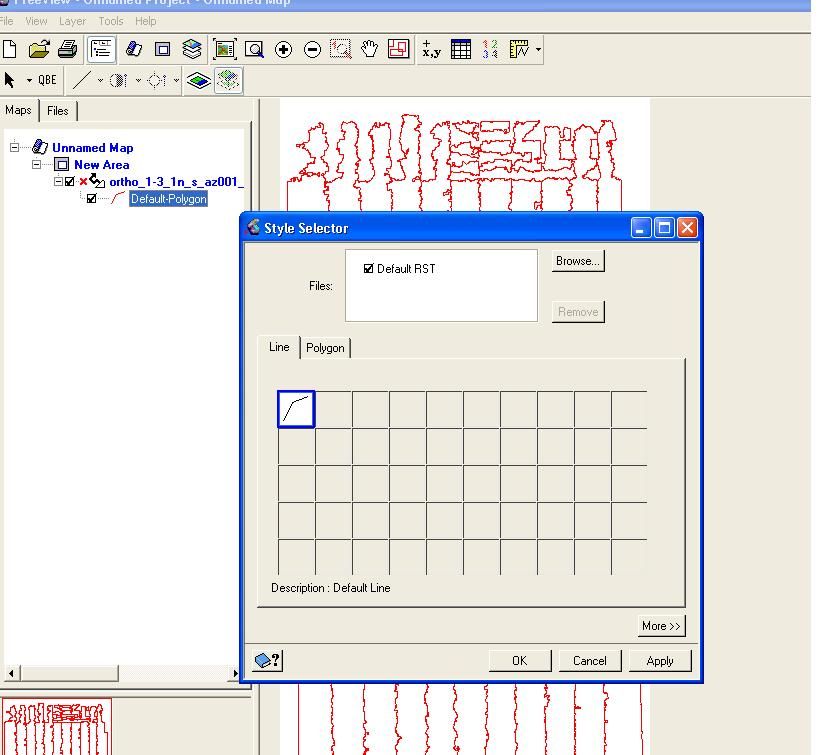
Changing a Vector Layer Display

There is no option to label features in the FreeView map display.

The color of a shapefile can be changed by right clicking on the file name. Select Color,
and choose a preset color.

Selecting More will open a color table, with the opportunity to create a custom color.

The line feature can be edited by right clicking the icon for Default Polygon under the file
name. This will open the Style Selector.
Clicking on More, and then on Advanced will open a dialog box with the option to create
different versions of the polygon. The polygon in the example below was created in three
parts:
The first step was selecting a dark brown color for the line, and making
the width greater than the default.
The second step involved clicking on the “+” sign to add a “part”, and
selecting “2”. For Primitive, the selection Polygon-Filled was chosen. A
fill color (yellow) was selected.
The third step, shown below, began with adding a third part. Primitive was
set to Line Dotted, a width was selected, and a light blue color was
selected. This line is barely visible above the brown line in the Preview
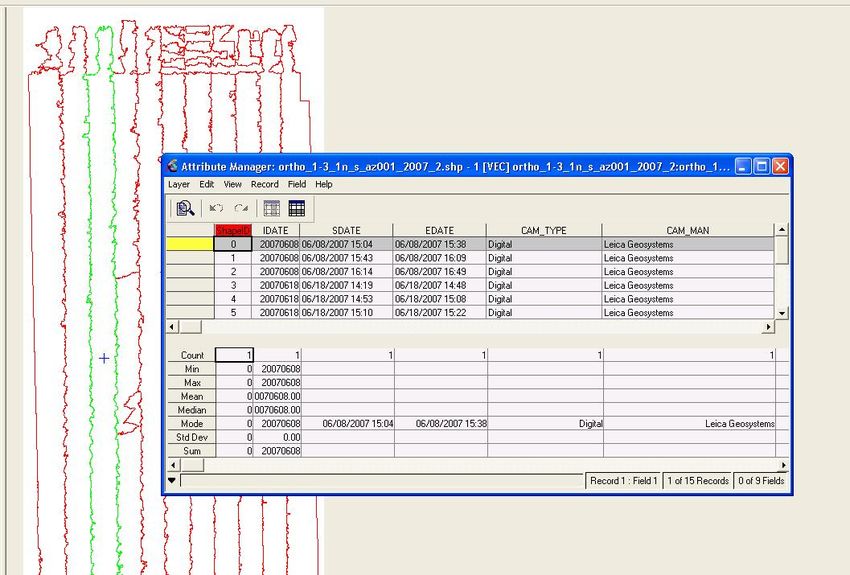
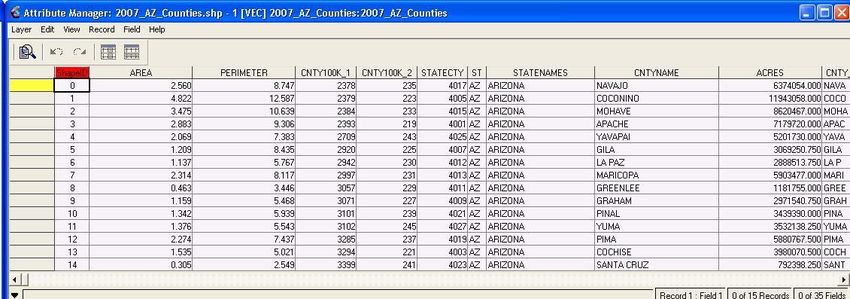
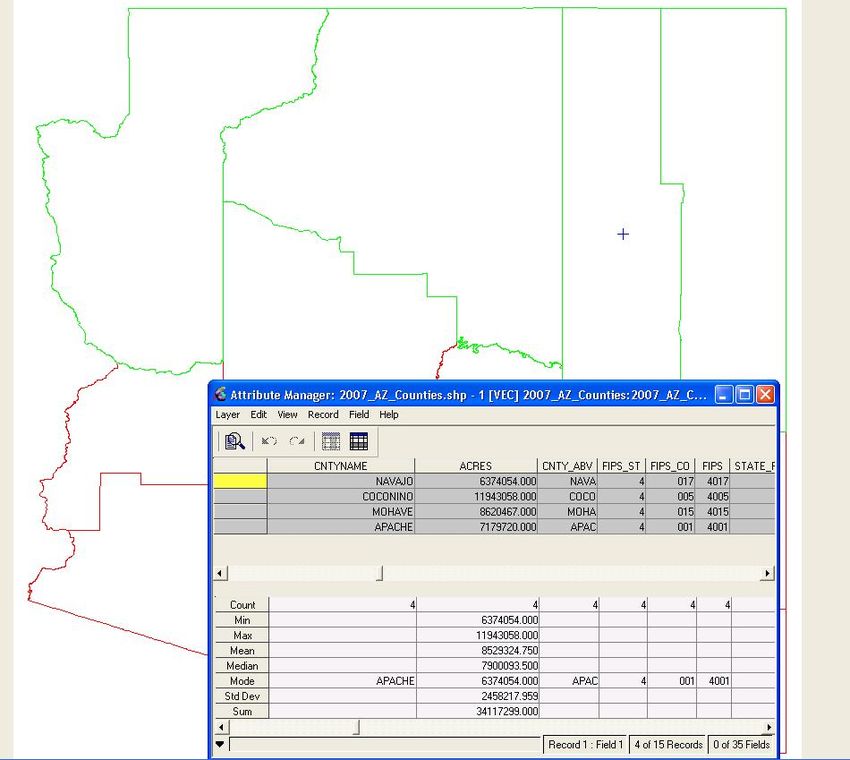
box at the right of the screen.Viewing a Vector Layer’s Attribute Table The Attribute Manager is opened by right clicking on the file name under either the Maps or Files tab.
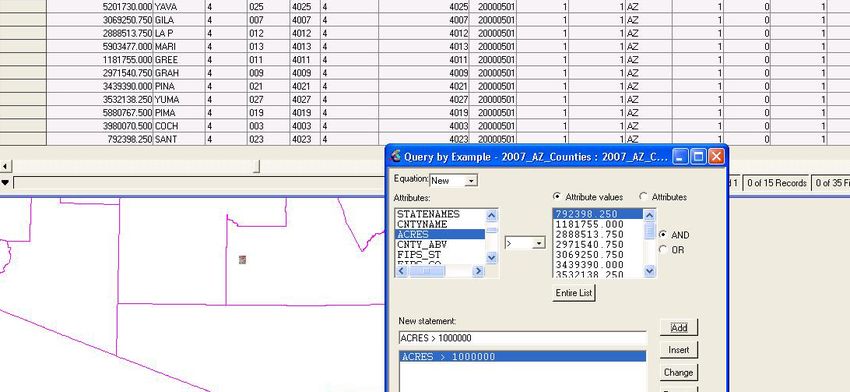
Clicking in the box next to a record, or onto a polygon in the display, will highlight the
record in the table and change its color in the display.

The attributes can be queried through a very simple SQL type query.
The example above shows a query for counties with an area larger than 1,000,000 acres.

In the example above, a query of counties larger than 6,000,000 acres highlighted four in
Arizona: Apache, Coconino, Mohave, and Navajo.
Displaying Data from Different Projections

FreeView will sometimes accommodate data in different projections within the same map
view. The order in which the data is imported will determine the success.

In the first experiment, the CCM and seamline shapefile, in the same projection, were
added to the view with no problem. When an attempt was made to add a shapefile of
Arizona counties, which is in a different projection, there was a warning that dealing with
the projection difference might be “time consuming.”

In spite of the warning, the county shapefile displayed correctly over the two original
files (the CCM and Seamline Shapefile).

When the county shapefile was added first, an attempt to add the CCM produced the
following warning:
The File Properties panel is not available in the free viewer version of the software.

The attempt to add the CCM to this view was unsuccessful. Because the county shapefile
was added first, it set the projection standard for the other files, and FreeView was unable
to project the CCM correctly.

Printing a Map

FreeView gives the options of creating either a .pdf or .tif which can then be printed.

                                                            For additional information contact:
                                                            USDA-FSA
                                                            Aerial Photography Field Office
                                                            2222 West 2300 South
                                                            Salt Lake City, UT 84119-2020
                                                            801-844-2934
                                                            www.apfo.usda.gov
You can also read