How to take a further step toward net zero carbon at your WWTP? - Speakers Nina Reppich
←
→
Page content transcription
If your browser does not render page correctly, please read the page content below
How to take a further step toward

net zero carbon at your WWTP?
                                              29.07.2021

                        Speakers

                               Nina Reppich

                               Maria Dittmann

                              Ulrich Knörle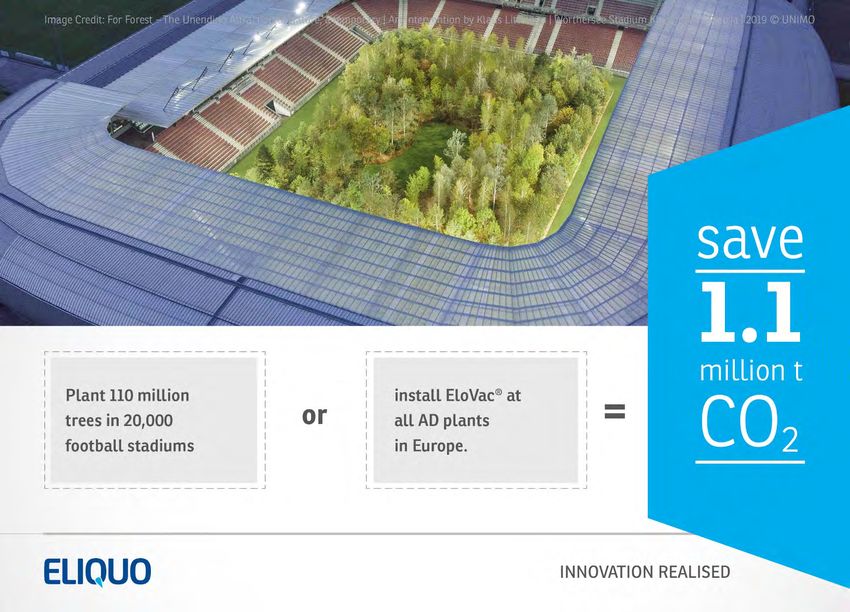
ABOUT US
 ELIQUO is a portfolio company of SKion Water GmbH

 Experts in plant engineering and innovative water and wastewater
 technologies and solutions for municipalities

 Our goal: to protect water as valuable resource and thus make an
 important contribution to protect nature
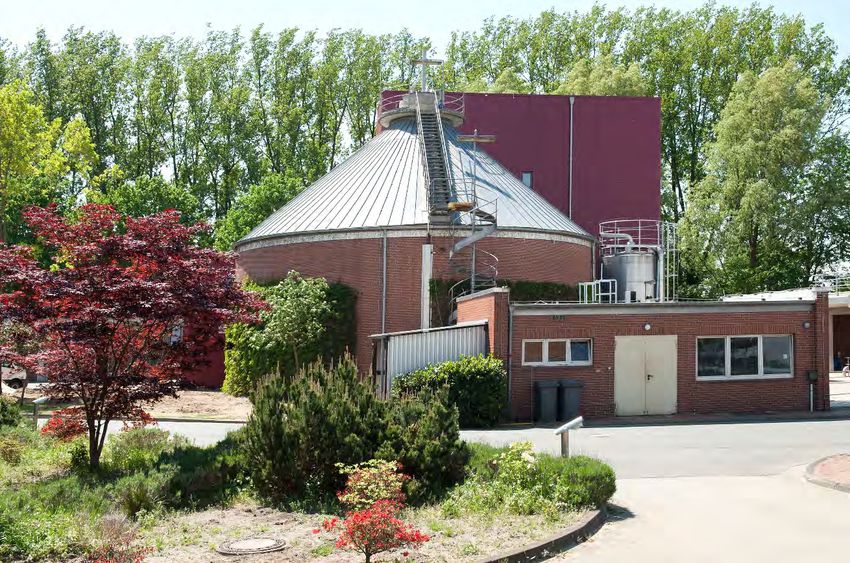
Clean water has a price, also for the environment

                                          Survey:
                                          Which factors at WWTPs are
                                          essential for reducing the carbon
                                          footprint?

                                            Electric Power
                                            Heat
                                            Transports
                                            Operating Media/Chemicals
                                            Direct greenhouse gas emissions

3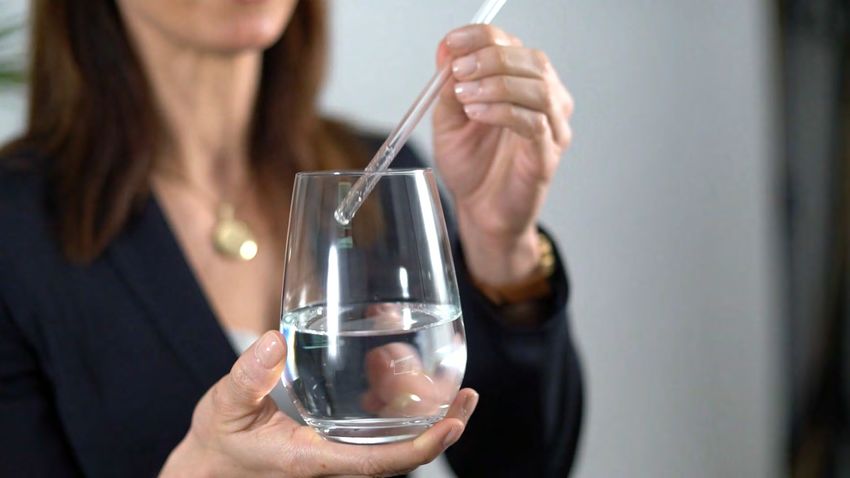
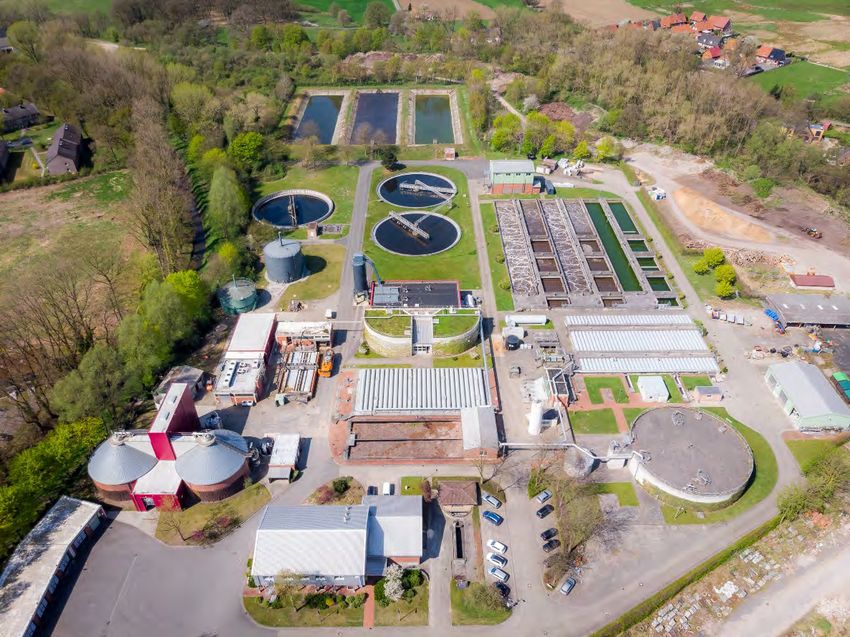
Direct emissions –
major share on WWTP‘s carbon footprint

         47 kg
                                                                                  Total amount of
                                                                                                                                                    77.7 kg CO77.7 kg CO2e
                                                                                  Direct Emissions                                       Total amount of
                                                                                                                                         emissions from       2e
                                                                                                                                                    pro EW undper PE per year
                                                                                                                                                                Jahr
       13.5 kg                                                                                                                                  a WWTP

         4.3 kg
                                                                                 Indirect Emissions
         6.9 kg                 Power

         1.5 kg                 Operating Materials
                                                                                 Further Indirect Emissions

           4 kg                 Sewage Sludge (Disposal)
         0.5 kg                 Sewage Sludge (Transport)

    Sankey diagram created by Iris Beuter, Master thesis student at Umwelttechnik BW based on the following studies:
    •  Daelman, M. R. J (2013) Methane and nitrous oxide emissions from municipal wastewater treatment - results from a long-term study (DOI: 10.2166/wst.2013.109)
    •  Law, Y. (2013) Fossil organic carbon and its fate in treatment plants (http://dx.doi.org/10.1016/j.watres.2013.06.002)
    •  Kosse, P. (2016) Climate change and greenhouse gas emissions within the context of urban waste water management
4
Methane emissions play a significant role
16
kg CO2e per PE and Year
14
47 kg 12
Total amount of 10
Total amount of
Direct Emissions
emissions 77.7 kg CO2e
13.5 kg CO2e per PE per yearfrom 8
per PE per year
13.5 kg from direct methane emissions
a WWTP
6
4.3 kg 4
Indirect Emissions 2
6.9 kg Power
12.9 kg CO 0
1.5 kg Further Indirect 2e per
PE per year
Emissions
Operating Materials
from total indirect emissions
4 kg Sewage Sludge (Disposal)
0.5 kg Sewage Sludge (Transport)
The share of methane emissions is higher than the total
indirect emissions of a wastewater treatment plant.
5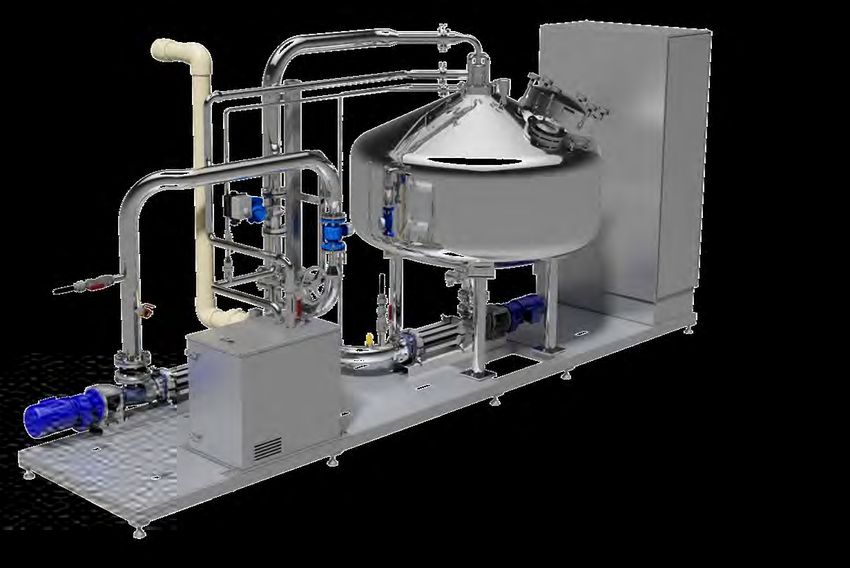
75% of the GHG emissions originate from CH4 in
sludge treatment
results from a study
conducted at 10 different
WWTPS
Both studies show
comparable results
concerning methane
emissions
Methan:
9.3 kg CO2e Consistent on all studies:
per PE and year direct methane emissions
play a major role and are
easy to avoid
6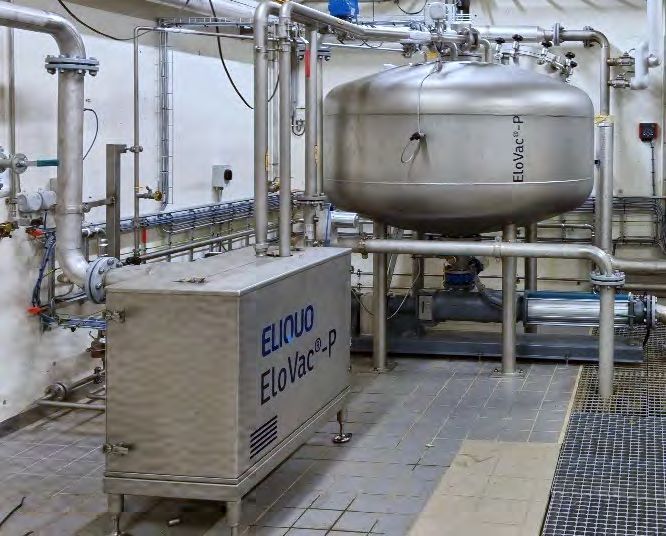
Avoiding methane emissions is key
for a CO2 neutral WWTP

7
Theory vs. Practice
WWTP Lingen – Specific gas volume captured by degassing
0,40
Specific Gas volume [m³N gas/m³ sludge]
0,35
0,30
y = -0,0013x + 0,6281 The gas volume captured
R² = 0,9805
by degassing is twice as
0,25 340 LN biogas/m³ sludge high as expected in theory!
49% CH4
0,20 0.15 m³N CH4/m³ sludge
0,15
0,10
0,05
0,00
220 230 240 250 260 270 280 290 300 310 320
Absolute pressure in degassing tank [hPa]
Total (dissolved gas + gas bubbles)
_ Dissolved gas (calc. acc. Henry's law)
8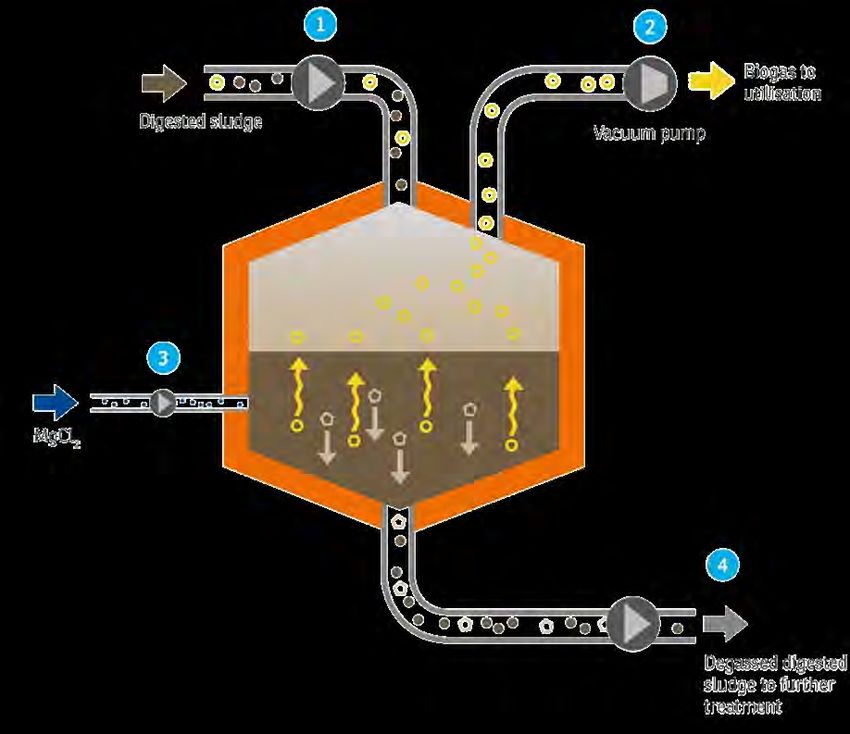
9
What is EloVac®-P
     Compact Plug & Play-Unit
     System for vacuum degassing
     of digested sludge
     Energy-positive
     Reduces greenhouse gas
     emissions
     Optional: integrated controlled
     phosphate precipitation
     Improves dewaterability of
     digested sludge
     Patent pending

     EloVac®: vacuum degassing
10   EloVac®-P: vacuum degassing with integrated phosphate precipitation
How does EloVac®-P work?
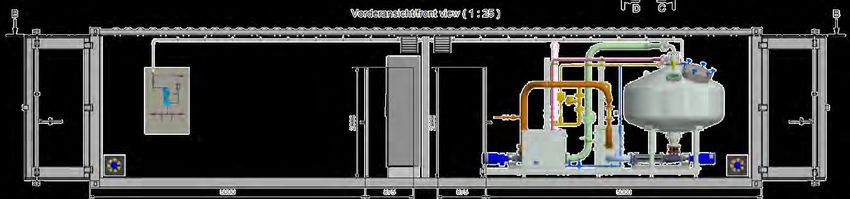
Implementation
Biogas to utilisation
Raw sludge
Optional: EloVac®-P
Centrate back to headworks
EloVac®-P
11Why Phosphate Precipitation?
Benefits in addition to the improvement of the carbon footprint by vacuum
benefits with phosphate precipitation:
P↓ Reduction of Phosphate return load by up to 95%
Improvement of dewaterability by up to 5%-points
Lower polymer consumption
Avoid struvite scaling issues
ROI of < 3 years depending on disposal and polymer costs
12Why Phosphate Precipitation?
TR(A) measurements* for the evaluation of the EloVac®-P plant in Lingen, GER
For example, we offer
laboratory tests to
investigate the effect of
EloVac®-P on a specific
sludge.
13
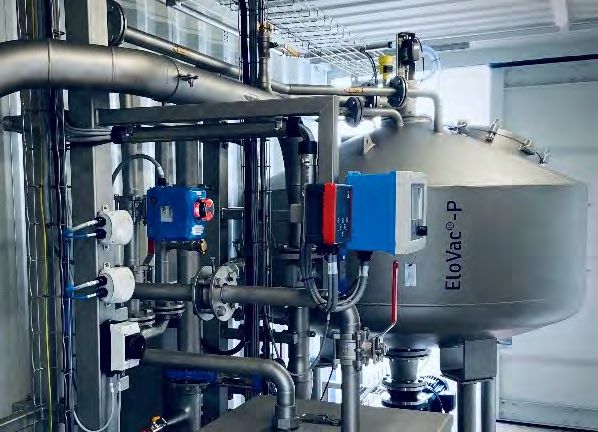
*) = TR(A) - www.KBKopp.deDemo plant for Europe
Capacity 15 m³/h digested
sludge (full scale treatment for
midsized WWTPs)
Available since 10/2020
So far experiences at 4 different
WWTPs and 3 further
employments by end of 2021
14EloVac®-P in Hannover Results of full scale demo test Background of the project Pigs (see picture on the right) are regularly used to clean the connecting pipeline (14 km length) between sewage treatment plants. Deposits in the pressure line cause the pig to move unevenly (by sticking and loosening) and cause abrasion on the surface of the pigs. Goal: mitigate scaling reduce abrasion on pigs 15
EloVac®-P in Hannover
                        4 months of continuous
                        operation

                        Improved volume,
                        difference of the pig
                        before and after use

                        improvements as shown
                        in the picture

                                      Source: KBKopp
16
EloVac® – successful technology
HIAS, Ottestad, Norway Provo, USA
Capacity max. 290 m³/d Capacity max. 500 m³/d digested sludge
commissioning 2020 commissioning 2021
Lingen, Germany
Saves 150 t CO2e per year Further Projects
160 m³/d digested sludge
Summer 2021:Northern Germany
2016: EloVac®
2019: EloVac®-P
Autumn 2021: South Korea
End of 2021: Denmark and USA
17 2022: South GermanyText hinzufügen
Your Questions?!

19
Interested to learn more?
Examples for further online seminars
                                                                           Avoidance of greenhouse
                       Compact solution for the
                                                                            gas emissions through
                       4th purification stage
                                                                            vacuum degassing of
                            with ozone
                                                                               sewage sludge

                                                                                  EloVac®-P
                                                  ELOZONIQ                                                 PYREG®

      ElIQUOs own                         ANAMMOX®
       Technology
                                                                                                     EloDry®
     ELIQUOs Partner                                                       LysoTherm®
      Technologien
                                                      Pearl®

                                                               Thermal pressure hydrolysis              Decentralized disposal
                         Solutions for reject water
                                                               to increase the efficiency of              concept through
                                 treatment
                                                                     sludge digestion                       sludge drying

20
Contact
Nina Reppich
Sr. Marketing & Communications Manager
+49 151 12 55 76 89
nina.reppich@eliquowater.com
Maria Dittmann
Product Manager
+49 151 58954415
Maria.Dittmann@eliquo-tech.com
Ulrich Knörle
Managing Director
+49 171 7480154
Ulrich.Knoerle@eliquo-tech.com www.eliquo-tech.com
21You can also read