Agricultural GHG Emissions projections ..and mitigation actions to 2030 - Presentation to Oireachtas Committee on Climate Action
←
→
Page content transcription
If your browser does not render page correctly, please read the page content below
Agricultural GHG Emissions projections
…..and mitigation actions to 2030

       Presentation to Oireachtas Committee on Climate Action

                            Dec 12th 2018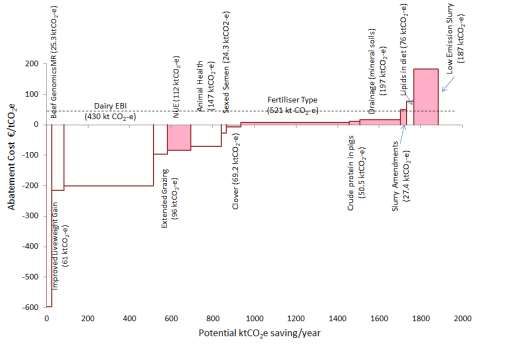
Overview
• Ireland’s GHG challenge - agriculture
• Scenarios for future emissions (without mitigation)
• Mitigation pathways
   – Agricultural GHG mitigation
   – Land Use Sequestration
   – Energy Efficiency and Fossil Fuel Displacement
      • Bioenergy and Biofuels
• Associated Costs
Background
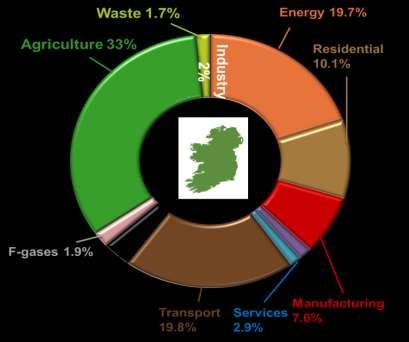
• Irish agriculture comprises
• 33% of Irish GHG emissions
• 45% of Irish non-ETS GHG
• GHG targets
• 20% emissions reduction by 2020
• 30% non-ETS reduction by 2030 (2030 Effort Sharing)
• with 10% allowable to flexible mechanisms
• LULUCF credits and transfers from ETS
• No subsector targets within non-ETS
• Non ETS Emissions projected to increase
• Transport and Agriculture
• Can mitigation action bring emissions onto a
downward path?Scenarios to 2030
• Impossible to know future level of activity with certainty
• Depends on
– international supply/demand -> commodity and farm prices
– policy (Mercosur, CAP Reform, Brexit)
• Look at 6 activity scenarios
• Based largely around how cow population could evolve
– in the dairy and beef herd
• Scenarios move along different paths from 2020 onwards
• Look at impact on:
– Total Cattle Population
– Other agricultural activities
– Nitrogen Use
– Determine associated GHG emissions (without mitigation)Total Cattle Population: Summary
8,000
Scenarios S1 to S6
S4
Total Cattle 000 head
S3
7,500 S2
S1
1.0M
S5
7,000
S6
6,500
1 million head difference between S4 and S6 in 2030
6,000
1990 1995 2000 2005 2010 2015 2020 2025 2030
History S1 S2 S3 S4 S5 S6
Source: FAPRI-Ireland ModelSummary: GHG emissions
NB: exclude mitigation actions
22 S4
S3
21 S2 2.3
S1
Mt
20 S5
Mt CO2 Eq
S6
19
18
17 10% cut
16 2.3 Mt difference between S4 and S6 in 2030
20% cut
15
1990 1995 2000 2005 2010 2015 2020 2025 2030
History S1 S2 S3 S4 S5 S6
Source: FAPRI-Ireland ModelSix Scenarios
Implications for GHG emissions in 2030
NB: excludes mitigation actions
2005 2016 2030 2030 vs 2005 2030 vs 2016
Mt CO2 eq % change % change
Historical 18.69 19.24
S1 20.45 9% 6%
S2 20.91 12% 9%
S3 21.31 14% 11%
S4 21.75 16% 13%
S5 19.92 7% 4%
S6 19.45 4% 1%
Evolution of GHG emissions cross the six scenarios
NB: excludes mitigation actionsThree Mitigation Pathways to 2030 1. Reduce Agricultural Methane and Nitrous Oxide – lower emissions from animals, animal waste and fertiliser 2. Sequester Carbon (LULUCF) – Via land use change and forestry 3. Energy efficiency & biofuels and bioenergy production – to reduce overall energy usage on farms – to displace fossil fuel emissions
1. MACC – Agricultural Abatement
                                                                       Mean annual values 2021-30
                                                              1.    Improved Beef Maternal Traits (CH4)                0.03 Mt
                                                              2.    Beef Genetics: live-weight gain (CH4)              0.06 Mt
                                                              3.    Dairy EBI (CH4)                                    0.43 Mt
                                                              4.    Extended grazing (CH4)                             0.07 Mt
                                                              5.    Nitrogen-use efficiency (N2O)                      0.1 Mt
                                                              6.    Improved animal health (CH4)                       0.1 Mt
                                                              7.    Sexed Semen (CH4)                                  0.02 Mt
                                                              8.    Inclusion of Clover in pasture (N2O)               0.07 Mt
                                                              9.    Change Fertiliser Type* (N2O)                      0.52 Mt
                                                              10.   Reduced crude protein in pigs* (N2O)               0.05 Mt
                                                              11.   Draining wet mineral soils (N2O)                   0.2 Mt
                                                              12.   Slurry amendments* (CH4)                           0.03 Mt
                                                              13.   Adding Fatty Acids to dairy diets (CH4)            0.03 Mt
                                                              14.   Low-emission slurry spreading* (N2O)               0.12 Mt
Marginal Abatement Cost Curve for agriculture for 2021-2030   * Double dividend as it also reduces ammonia emissions
Impacts on 2030 GHG targets
S1 Scenario with mitigation
24
22
20.5 Mt
20
MT CO2 Eq
-15%
18 -7%
2005 = 18.7 Mt
16
17.6 Mt
15.0 Mt
14 (-20% rel. to 2005)
12
1990 1995 2000 2005 2010 2015 2020 2025 2030
BAU with ag. mitigation 20% pro-rata reduction
102. MACC - Land-Use Sequestration
Mean annual values 2021-30
15. Grassland Management 0.26 Mt
16. Water table mgt of organic soils 0.44 Mt
17. Forestry 2.1 Mt
18. Tillage Mgt – Cover crops 0.1 Mt
19. Tillage Mgt – Straw incorp. 0.06 Mt3. MACC - Energy Efficiency, Bioenergy and Biofuels
20. Energy efficiency on farm 0.03 Mt
21. Wood Biomass* for energy 0.76 Mt
22. SRC & Miscanthus for Heat 0.18 Mt
23. SRC for Electricity 0.19 Mt
24. Anaerobic Digestion** 0.22 Mt
25. Biomethane 0.15 Mt
26. Oil Seed Rape for Biodiesel^ 0.18 Mt
27. Sugar beet for Bioethanol ^ 0.03 Mt
*thinnings and sawmill residues
**slurry and grass for CHP
^fails to meet 50% GHG offset sustainability thresholdSummary of Emissions and Mitigation
Historical emissions (Mt CO2-e yr-1) Projected Emissions
Mean
1990 2005 2016 2021-2030 2030
Emissions without Mitigation
Total Agriculture emissions (ex. Fuel) 19.51 18.69 19.24 20.28 20.45
Mitigation
Cost effective Agriculture mitigation 1.73 2.89
Cost effective LULUCF offsets* 2.80 3.50
Cost effective energy mitigation 0.99 1.31
Total Mitigation 5.52 7.70Associated Costs
GHG mitigation
• Most (>85%) mitigation < €50/t CO2e
– Agricultural Mitigation generally cheaper
– Land Use and Energy more expensive
• Farm level agricultural efficiencies
– e.g better breeding
– can potentially save €136m p.a.
• Technical measures
– cost €157m p.a. for Ag, Forestry and Land Use
• Bioenergy costs
– calculated at €58m pa
– but higher uncertainty about feasibility
14Conclusion • WARNING: Across the world there is a poor take up of GHG mitigation actions by the ag sector • Without mitigation, Ag GHG emissions are likely to increase – Mainly due to increased dairy production – Which would lead to a larger cattle population • Significant mitigation potential exists – But these solutions exist on paper only – Significant communication and action required – Particularly at farm level to realise these emissions reductions
Further Reading
• Gary J. Lanigan & Trevor Donnellan (eds.) An Analysis of Abatement
  Potential of Greenhouse Gas Emissions in Irish Agriculture 2021-2030.
  Teagasc, Oak Park, Carlow. June 2018

• Donnellan, T., Hanrahan, K and Lanigan G.J. Future Scenarios for Irish
  Agriculture: Implications for Greenhouse Gas and Ammonia Emissions.
  Teagasc, Athenry. June 2018
You can also read