2021 SUMMER OUTLOOK PRESENTED BY SENIOR METEOROLOGIST CHAD MERRILL AND METEOROLOGIST ANDREW ROSENTHAL - Earth Networks
←
→
Page content transcription
If your browser does not render page correctly, please read the page content below
2021 SUMMER OUTLOOK
PRESENTED BY SENIOR METEOROLOGIST CHAD MERRILL
AND METEOROLOGIST ANDREW ROSENTHAL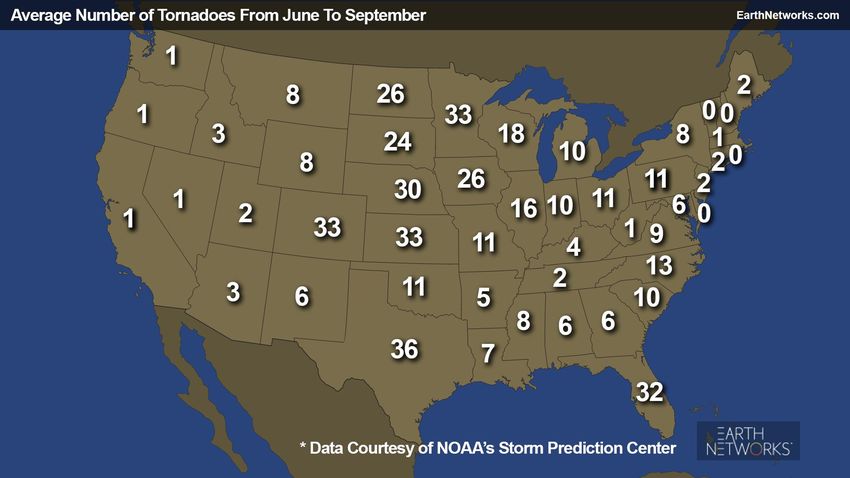
BEFORE WE GET STARTED…

Got questions?
During the webinar, use the “Ask Question” feature.
After the webinar, send questions to info@earthnetworks.com.

We can’t hear you.
You are in “listen only mode” and your microphone is muted.

On the go?
Download the “GoToWebinar” app on your smartphone or tablet to watch   Question Box
live.

 And yes, this webinar is being recorded and the recording will be
                          provided to you.

                                                                                2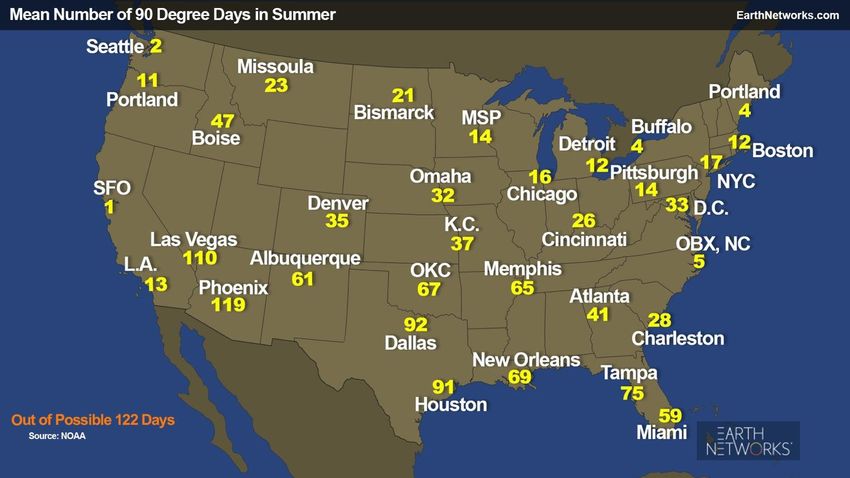
2021 SUMMER OUTLOOK METEOROLOGICAL TEAM

      CHAD             ANDREW         MATTHEW            DAN               JULIE
     MERRILL          ROSENTHAL       MEHALLOW           RUPP             GADDY
  Sr. Meteorologist   Meteorologist   Meteorologist   Meteorologist   Sr. Meteorologist

                                                                                          3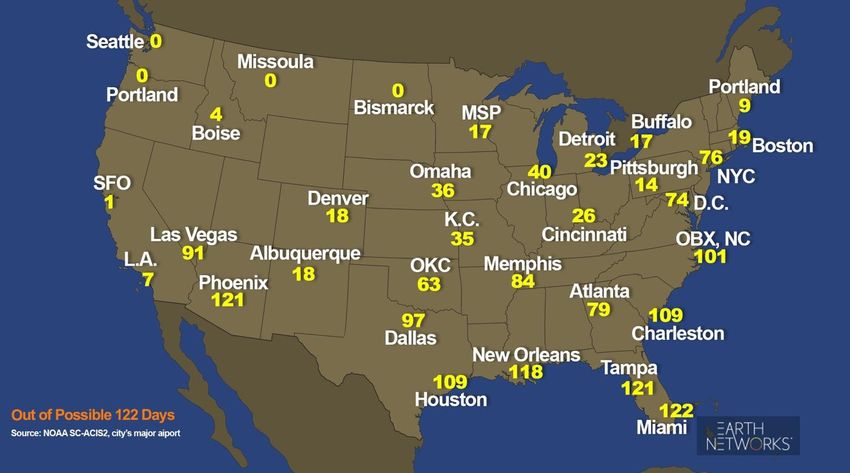
SUMMER 2020 RECAP

                    4
EARTH NETWORKS 2020 SUMMER TEMPERATURE OUTLOOK

                                                 5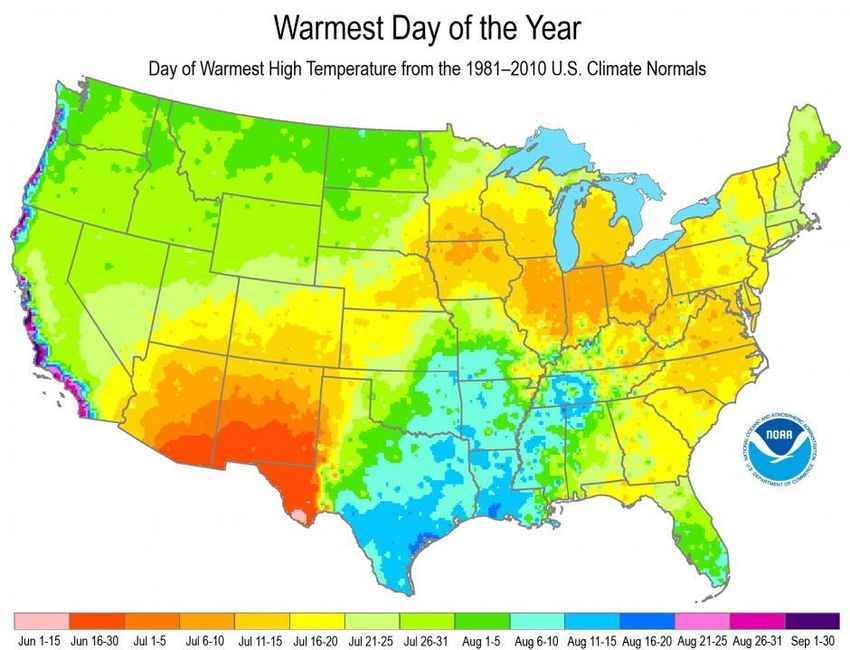
2020 SUMMER TEMPERATURE OUTLOOK VERIFICATION
   MEAN TEMPERATURE PERCENTILES | JUNE–AUGUST 2020 | RANKING PERIOD: 1895–2020

                                                                                 6
HOW OFTEN DID LOWS STAY ABOVE 70 DEGREES LAST SUMMER?

                                                        7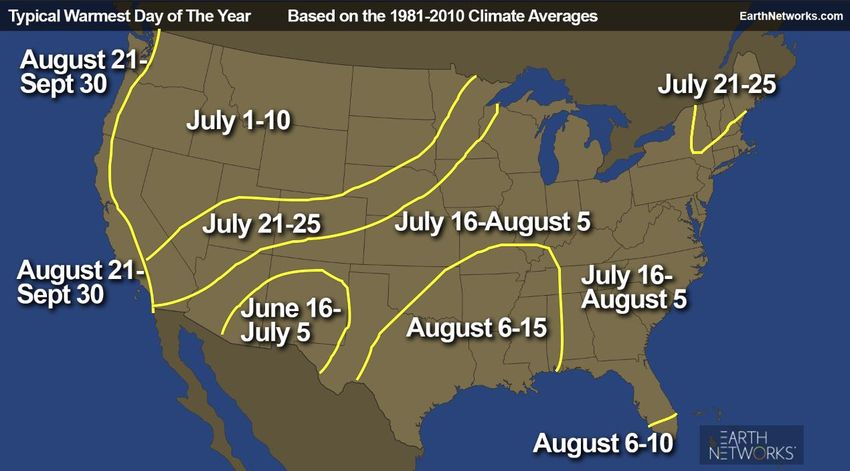
EARTH NETWORKS 2020 OUTLOOK SUMMER PRECIPITATION

                                                   8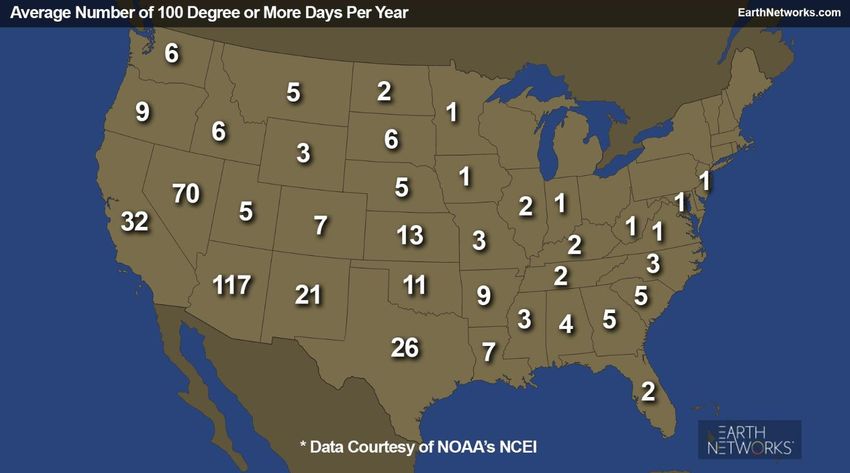
2020 SUMMER PRECIPITATION VERIFICATION
   TOTAL PRECIPITATION PERCENTILES | JUNE–AUGUST 2020 | RANKING PERIOD: 1895–2020

                                                                                    9
2020 TROPICAL LANDFALLS IN CONTINENTAL U.S.
                                                    RECORDS:

                                              • 30 Storms Across
                                                Atlantic Basin

                                              • 11 Landfalls in
                                                Continental U.S.

                                              • 4 Landfalls on
                                                Louisiana coast

                                                                   10
2021 WEATHER NORMALS UPDATE
11SUMMER CHANGES IN NORMALS
• All areas of the country
experienced warming
• Largest warming found
across Southwest
• Some warming across coastal
Northeast and Mid-Atlantic
• Least warming occurred
across Southeast and
Gulf Coast
12SUMMER CHANGES IN NORMALS
• Much drier across Rockies
into Texas
• West was also drier, wet
anomaly in the Colorado Basin
• This is a result of wet summers
in 2013, 2014, 2015 and 2017
• Gulf Coast to Northeast
have seen wet anomaly
in the last 10 years
13CHANGES IN NORMAL — DAY VS. NIGHT
Summer (JJA) Maximum Temperature Change Summer (JJA) Minimum Temperature Change
14U.S. SUMMER TEMPERATURE TRENDS
JUNE–SEPTEMBER
15SUMMER 2021 OUTLOOK
We are forecasting the overall
rainfall and temperature trends
expected for the months of:
JUNE, JULY, AUGUST
& SEPTEMBER
16HOW THESE FACTORS RANKED IN OUR SUMMER 2021 OUTLOOK
STRONGEST SIGNALS NOTED IN ORDER OF IMPORTANCE
• 40%: Recent Temperature & Rainfall Trends
• 40%: Current and forecast drought conditions
• 10%: Expected Similar ENSO Summers
(El Niño (Warm Phase), Neutral (Neither cold
or warm), La Niña (Cold Phase))
• 10%: Climate model outlook
17TEMPERATURE/RAINFALL TRENDS THE PAST 10 SUMMERS
Temperature Compared to Average Precipitation Compared to Average
*Warm signal evident across the entire US, most notably in the West and Midwest
*Wet signal in the Midwest, western Gulf Coast and East
*Dry signal from Texas into the Northwest
18U.S. SUMMER RAINFALL TRENDS
CHANGE IN 30-YEAR AMOUNTS (JUNE-SEPTEMBER)
STRONGEST SIGNALS NOTED IN ORDER OF IMPORTANCE
1981-2010 1991-2020 1981-2010 1991-2020
City % Change City % Change
Rainfall Avg. (in.) Rainfall Avg. (in.) Rainfall Avg. (in.) Rainfall Avg. (in.)
Los Angeles 0.37 0.22 41% Minneapolis 15.65 15.98 2%
Phoenix 2.71 2.43 10% New Orleans 25.12 26.42 11%
Salt Lake City 3.49 3.08 12% Birmingham 17.00 18.55 8%
Seattle 4.66 5.09 8% Washington, DC 14.14 15.70 10%
12 30 25.12 26.42
10 25
8 20 15.65 15.98 17.00 18.55
5.09 14.14 15.70
6 4.66 15
3.49 3.08 10
4 2.71 2.43
2 0.37 0.22
5
0 0
Los Angeles Phoenix Salt Lake City Seattle Minneapolis New Orleans Birmingham Washington, DC
1981-2010 Rainfall Average (inches) 1991-2020 Rainfall Average (inches)
19EASTERN U.S. RAINFALL TRENDS
June July
• On average, June
and July are the
wettest months.
• September is the
driest month but
August September shows the highest
variability due to
influence of an
Atlantic or Gulf
tropical system.
20A CLOSER LOOK AT THE DECADAL TEMPERATURE TRENDS
Morning lows trended warmer, particularly in the Southwest and I-95 corridor
Afternoon highs have trended warmer in the West, S. Plains and Midwest
Minimum Temperature Compared to Average Maximum Temperatures Compared to Average
21HOW COMMON ARE 90 DEGREE DAYS IN THE SUMMER?
22CURRENT DROUGHT CONDITIONS
• Much of the West in a
record drought
• Moderate to severe
drought stretches across
the northern Plains
• Moderate drought noted
from the Upper Midwest
and Great Lakes into
interior New England
• Only patchy dry spots in
the Ohio Valley, northern
Mid-Atlantic and Southeast
Atlantic Coast
Courtesy: The National
Drought Mitigation Center
23WESTERN U.S.: SIGNIFICANT DROUGHT DEVELOPED OVER THE LAST YEAR
Latest Drought Conditions
Western Drought Coverage
Compared to Last Year
NOW: 83% NOW: 46%
NOW: 22%
May 2020: 39% May 2020: 3% May 2020: 0%
Courtesy: The National Drought Extreme drought Exceptional drought
Drought Mitigation Center
24WESTERN U.S. EXCEPTIONAL DROUGHT COVERAGE AT ITS HIGHEST
COMPARED TO LAST 10 YEARS
West Percent Area
15
12-1-10 Current
Courtesy: The National
Drought Mitigation Center Just 1 Year Ago
Late July Soil Moisture Outlook
25DROUGHT FEEDBACK: LESS RAINFALL AND WARMER TEMPERATURES
Courtesy: Annals
of the New York
Academy of Sciences
26SOUTHWEST MONSOON SUMMER RAINFALL CLIMATOLOGY
• Afternoon showers and storms
are triggered by difference in air
temperature between the desert
and adjacent Gulf of California
and Pacific Ocean
• Most of the monsoon rain occurs
in July and August
• Monsoon season rain accounts
for 35-45% of Arizona and New
Mexico’s annual precipitation
Courtesy: The University of Arizona
27DROUGHT: PRECURSOR TO DRY SOUTHWEST MONSOON SEASON
• Over the last 10 summers, 2013, 2014,
2015 and 2017 had above-average rainfall
Figure 1 in Arizona. (Figure 1)
• In the May preceding each summer, only
2013 saw extreme to exceptional drought
coverage (0.27% of Arizona was in an
extreme or exceptional drought). (Figure 2)
• Extreme to exceptional drought as of early
May 2021 covers 31% of Arizona! (Figure 2)
Figure 2
• This is a good indication that drought will lead
to below-average summer monsoon rain.
Current
Courtesy: U.S. Drought Monitor
28SOIL MOISTURE/DROUGHT OUTLOOK
15
Late August Soil Moisture Outlook 4-8
Soil Moisture Outlook Drought Outlook: Valid Through August 31, 2021
• Drier than average soil will lead to persistent drought in the West
• Drought will expand into the northern Rockies and Texas this summer
• Drought development is not expected in the Great Lakes to interior New England
29ENSO: CYCLICAL WARMING AND COOLING CYCLE OF THE
EQUATORIAL PACIFIC
El Niño Neutral La Niña
Above Average Near Average Below Average
30WHICH PHASE IS EXPECTED THIS SUMMER?
The equatorial
Pacific sea surface
temperatures are
NEAR average.
Near Average (Neutral)
31FORECAST MODEL PROBABILITIES FOR ENSO
La Niña Neutral El Niño
80
70 Neutral
Neutral The equatorial
60
Pacific sea surface
50
temperatures are
40
expected to remain
30
NEAR average through
20
September.
10
0
May-June-July June-July-August July-August-September August-September-October
32BEST MATCHED PREVIOUS ENSO SUMMERS TO 2021
10-15
4-8
2-4
Overall Temperature Departure from Average Precipitation Departure from Average
33CLIMATE MODEL FORECASTS – TEMPERATURE/RAINFALL
10-15
4-8
2-4
CFS Model Temperature Departure CFS Model Rainfall Departure
Forecast for JJA 2021 Forecast for JJA 2021
34EARTH NETWORKS 2021 SUMMER RAINFALL OUTLOOK
REGIONAL HIGHLIGHTS
• Western drought will lead to an active
fire season
• Southwest monsoon season will
produce less rainfall than average
• Thunderstorms and tropical moisture
will likely contribute to above-average
rainfall in Southeast and Mid-Atlantic
• Abnormally dry conditions will persist
across interior New England
• Mixed signals for rainfall in Midwest,
Ohio Valley and eastern New England
35EARTH NETWORKS 2021 SUMMER TEMPERATURE OUTLOOK
REGIONAL HIGHLIGHTS
• Much of the U.S. will see warmer
than average temperatures
• High temperatures likely to be
warmer than average in the West
• Warmer nights will contribute to
above-average temperatures in the East
• Enhanced rainfall potential along
Central Gulf Coast leads to mixed
temperature signals
• No strong signals for warmth or
cooling in the Upper Great Lakes
36THANK YOU
QUESTIONS AND COMMENTS?
Contact us at info@earthnetworks.com or 301-250-4000HOW COMMON ARE 100-DEGREE DAYS?
38U.S. SUMMER MINIMUM & MAXIMUM TEMPERATURE TRENDS
Contiguous U.S. Minimum Temperature
June–September
10-15
4-8
2-4
Contiguous U.S. Maximum Temperature
June–September
39WHEN IS THE WARMEST DAY OF THE YEAR MOST LIKELY TO OCCUR?
40SUMMER TORNADO CLIMATOLOGY
41You can also read