Climate Outlook Review - Northern Australia October 2018 Authors: Prof Roger C Stone & Dr Chelsea Jarvis - Centre for Applied Climate Sciences - USQ
←
→
Page content transcription
If your browser does not render page correctly, please read the page content below
Centre for Applied Climate Sciences

Climate Outlook Review –
Northern Australia

October 2018

Authors: Prof Roger C Stone
& Dr Chelsea Jarvis

University of Southern Queensland | Document title             1
2

Overview

   Rainfall: Average to below average
   Day time temperatures: Above average
   Night time temperatures: Average to above average

   The Australian and international long-term dynamic climate
   models that focus on forecasting central Pacific sea surface
   temperatures are continuing to predict further development of
   an El Niño within the next few months (October to December).

   Consequently, most rainfall forecasts for northern Australia,
   especially north east Australia, currently indicate only low
   probability values of exceeding the respective long-term
   median rainfall right through to and including summer
   2018/19.

   The average Southern Oscillation Index (SOI) values for the
   month of September was close to negative 9.6 (‘Near Zero’).

   The statistically based SOI phase system agrees with the
   dynamical models in predicting below average rainfall.

   Both minimum and maximum temperatures are expected to be
   average to above average for the months of October to
   December. Due to clear nights, there is an increase chance of
   frost risk later into the season for areas that are frost prone.

   Due to the El Niño-like conditions, there is a higher than
   average chance of a late start to the monsoonal wet season

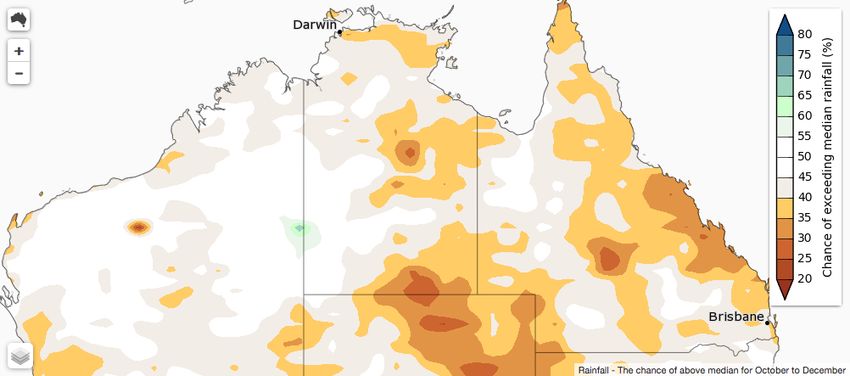
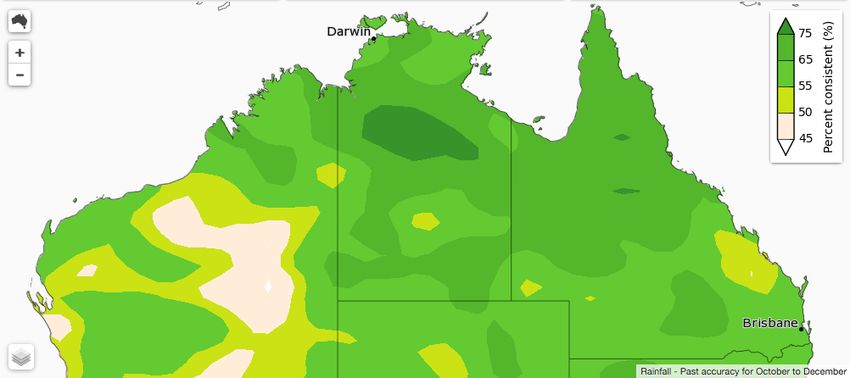
3

 Australian Bureau of Meteorology forecasts:

Figure 1: Bureau of Meteorology Forecast ‘Chance of exceeding median rainfall’
probability values for northern Australia for the overall period October to December 2018.
The majority of northern Australia is showing a less than 50% chance of exceeding median
rainfall.

Figure 2: Past accuracy of rainfall from October to December, indicating how accurate
past rainfall forecasts have been for these months.

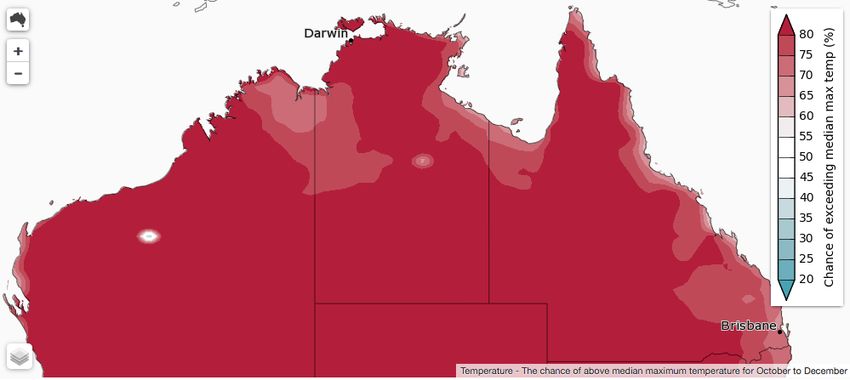
4

Figure 3: Bureau of Meteorology Forecast ‘Chance of exceeding median maximum
temperatures’ for northern Australia for the overall period October to December
2018. The majority of northern Australia is showing at least a 70% chance of
exceeding median maximum temperatures. This indicates that day time
temperatures are likely to be above median.

Figure 4: Bureau of Meteorology Forecast ‘Chance of exceeding median minimum
temperatures’ for northern Australia for the overall period October to December
2018. The majority of northern Australia is showing at least a 60% chance of
exceeding median maximum temperatures. This indicates that night time
temperatures are likely to be above median for much of the area outside of
the eastern coasts.
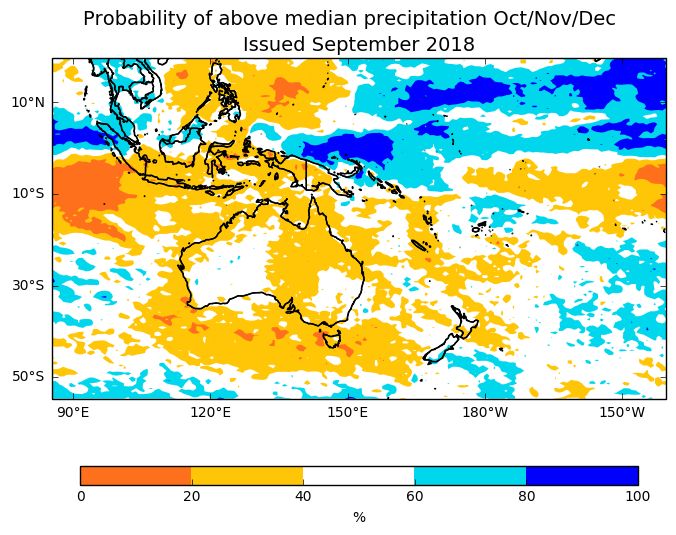
5

UKMO forecasts:

Figure 5: Probability of above median precipitation during the months of October,
November and December. For the majority of Australia, there is a 20-40% chance of
receiving above median rainfall, indicating that it is likely that rainfall will be median
or below median (60-80% chance).
6
The Southern Oscillation Index:
The Southern Oscillation Index (SOI) is an index based on the difference between surface
pressure in Darwin, Australia and Tahiti, which are related to ENSO phases.
The SOI consists of five different categories: Negative – when values are consistently below
negative 5, indicating an El Niño phase; Positive – when values are consistently above
positive 5, indicating a La Niña phase; Falling – often the transition period between a La
Niña and El Niño phase; Rising – often the transition period between an El Niño and La Niña
phase; and Near Zero, during which time there is not, at that period, an ENSO signal or
phase.
La Niña
SOI > 5
El Niño
SOI < -5
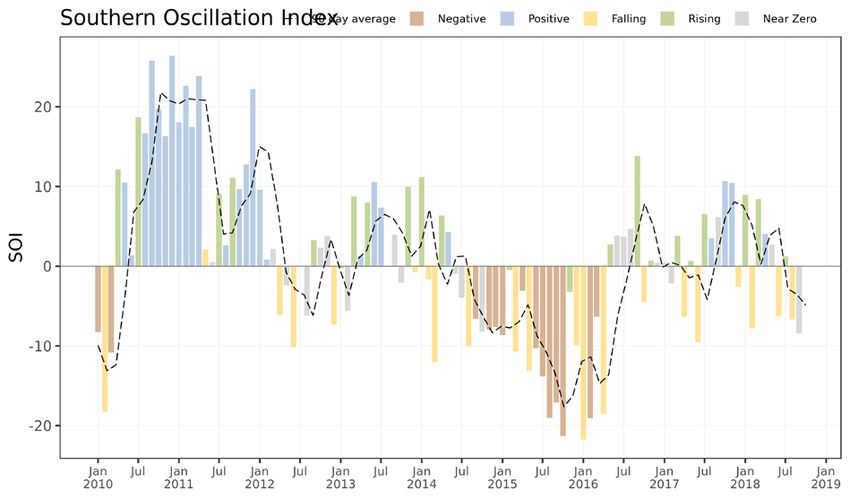
Figure 6: Monthly SOI values since January 2010 – the most recent phase is ‘near zero’
with the SOI oscillating around and below zero. The most recent 30-day average
value to 30 September was negative 9.6.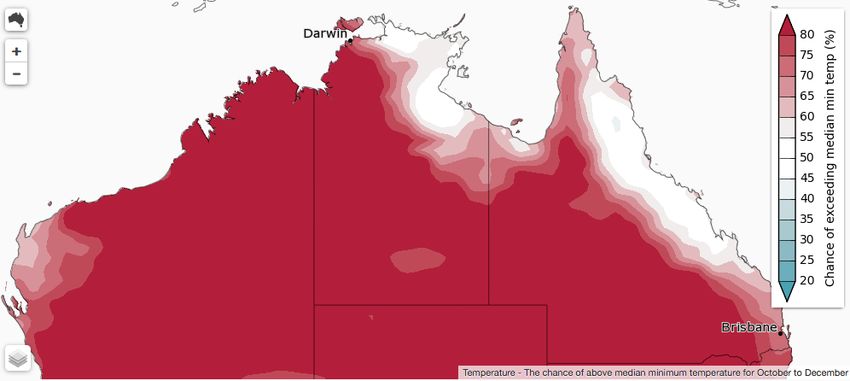
7

 Figure 7: ‘Probability of exceeding median rainfall’ values for northern Australia for
 the overall period October to December 2018 based on ‘near zero’ SOI values during
 August and September. The majority of northern Australia is showing a less than
 50% chance of exceeding median rainfall, with some inland areas having less than a
 30% chance.

Explaining the Differences Between Models:

BOM, UKMO, and SOI rainfall ‘Probabilities of exceeding median’ differ slightly. This
is due to the BOM and UKMO using dynamical models for predicting rainfall, while
the SOI is applied as a statistical system. Dynamical models use the current state
of the oceans and atmostpheres combined with our understanding of the physical
processes behind weather and climate to forecast the likelihood of future rainfall.
Each dynamical model is based on certain model calibrations, which differ from
model to model, providing slightly different outcomes. Statistial models use
historical climate data to determine when conditions were similar in the past and
what rainfall resulted from those past conditions.
While all of the models may be slightly different, it is important to focus on the
overall predicted outcomes. All three of the models presented here show that there
is an average to below average likelihood of receiving median rainfall.
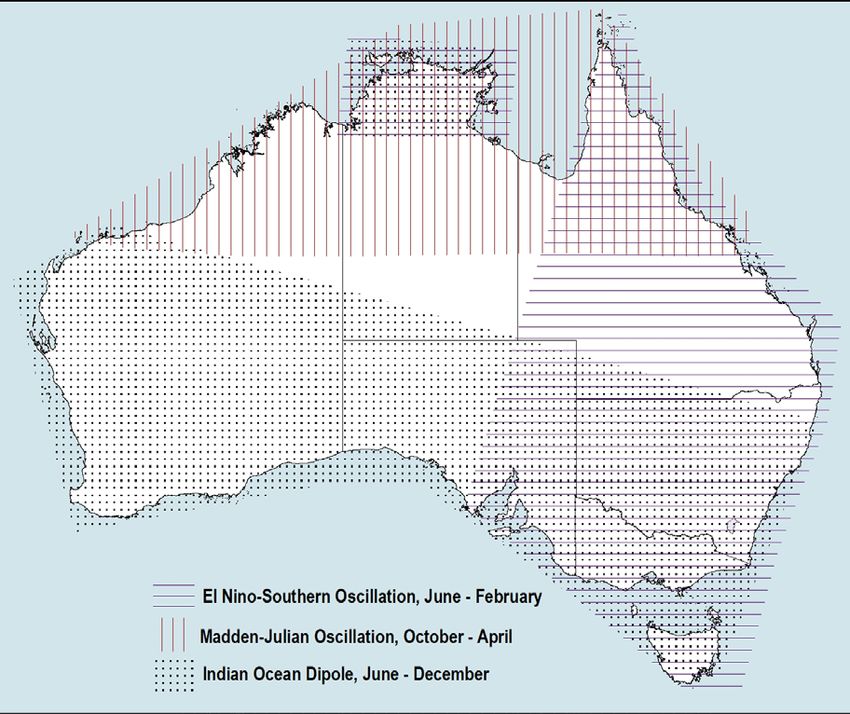
8

Areas affected by climate drivers and active months:

 Figure 8: Areas and times climate drivers are active

El Niño-Southern Oscillation (ENSO)

ENSO events generally begin in the Southern Hemisphere winter, peak during
summer, and then usually end during autumn. The El Niño phase is often
associated with warmer and drier conditions while La Niña phases are often
associated with cooler and wetter conditions. The main areas of Australia
impacted by ENSO phases are the eastern seaboard, north-eastern Australia and
south-eastern Australia. Currently, ENSO conditions are neutral, with some
models predicting an El Niño phase beginning sometime in October or November
while other models predict neutral conditions to prevail. Impacts of and El Niño
(dry and warm conditions) can occur even if conditions do not meet thresholds
for an official event and can occur in eastern Australia while El Niño is
developing.
9

Madden Julian Oscillation (MJO)

The MJO, also sometimes known as the 40-day wave, impacts weather in tropical
Australia (and occasionally in higher latitude areas) on a weekly to monthly
timescale. The MJO can either be active (line outside of the circle in Figure 9) or
weak/inactive (line inside the circle in Figure 9).

According to multiple forecasting systems (BoM, NOAA, USQ) and analyses, the
MJO has emerged in sector 8. When the line (the blue line, in this case) is
outside of the circle in sectors 1 and 8, there is an increased chance of clear
conditions (reduced rainfall). Recent past MJO events have been weak (have
remained within the circle at the centre of Figure 9) and outside of the area of
influence for Australia. When the line is outside of the circle in sectors 4 and 5,
there is a greater likelihood for rainfall for northern Australia. When the MJO is in
sectors 2,3, 6 or 7, there is minimal to no impact on Australia. Please also refer
to the interesting BoM website (below) for updated information on the MJO.

Figure 9: MJO phase diagram for August to 30 September. The green line shows values
for August and the blue line for September. The numbers indicate the day of the month.
10

Monsoon/Wet Season Onset (Included seasonally)

The wet season onset is predicted to be average to slightly late in timing. This is
due to the El Niño-like conditions developing in the equatorial Pacific Ocean.

 Figure 10: Chance of observing early onset of rainfall is below 45% for the majority
 of regions in northern Australia. This means there is above average chance
 (greater than 55%) of average or later than average onset.

Figure 11: Average wet season onset during SOI negative (El Niño) years.
11

For u

Click on the following links:
   •    For the MJO

   •    For weekly SSTs

   •    For easterly (and westerly) wind anomalies across the Pacific

   •    For sub-surface temperatures across the Pacific

   •    For ECMWF forecast products (note the web site for this output has
        changed)

   •    For ‘plume’ forecasts of SSTs in the central Pacific

   •    For a complete history of the SOI

   •    The Long Paddock

   •    Additional information on ENSO

                                 USQ Research
                      Centre for Applied Climate Sciences

                       Please email Prof Roger Stone at
                           Roger.stone@usq.edu.au
You can also read