Processing satellite images - Annexe A - OECD iLibrary
←
→
Page content transcription
If your browser does not render page correctly, please read the page content below
Annexe A   Processing satellite images

           Annexe A

           Processing satellite images

           The objective of this procedure is to replace the    of points corresponding to the centroids of
           manual digitisation of urban agglomerations          agglomerations of more than 10 000 inhabitants,
           carried out using Google Earth satellite images,     so as to retain only the agglomerations targeted
           which represent an incomparable source of very       by Africapolis. The outlines of the agglomera-
           high-resolution images for the entire African        tions are shown in Images A.1 (“f”) and A.2 (“f”).
           continent.                                           A final visual check is made to correct any classi-
                 The procedure for extracting/identifying       fication errors.
           urban areas/surfaces is sub-divided into two              The image processing sequence for wetlands
           sequences: one which corresponds to dry zones        follows the sequence outlined above with a few
           (approximately  800 mm of precipitation per year) (Graph       its environment makes it possible, in wetlands,
           A.1).                                                to use "high thresholding" on the grey-tinted
                 The images are initially (typical image size   image ("b", Image A.2). The overlapping of the two
           is 4 800 x 3 500 pixels) converted to grey-tinted    binary masks ("d", Image A.2) makes it possible
           images ("2a" and "3a", Figure A.1) and they are      to extract the urban areas by applying a selec-
           automatically georeferenced from the centre          tion based on both the texture and the spectral
           co-ordinates of the image and the co-ordinates       response of the surfaces (the grey levels). Some
           of the lower right-hand corner. The contrast         misclassified areas of Lagos Lake were elimi-
           between urban areas and their surroundings is        nated using this process (yellow portions in "d",
           enhanced using a method proposed by Mering et        Image A.2). Finally, a specific algorithm is applied
           al. (2010), which is based on the use of morpholo-   which gathers all of the pixels that belong to one
           gical filters. The combination of the “White Top     agglomeration and that are located within 200
           Hat” and “Black Top Hat” (“2b”) filters makes it     metres of one another. The application of this
           possible to extract the “salt and pepper” texture    algorithm is particularly important in wetlands
           which results from “the overlapping of light-        where populations are often widely dispersed
           ly-shaded buildings, of roads and of shadows         ("f", Image A.2).
           cast by dark-hued buildings” (Baro et al., 2014).
           Subsequently, a closure by reconstruction is
           made to smooth the images ("2c"). Finally, the
           application of "high thresholding" makes it
           possible to isolate urban areas in a binary mask
           ("2d" and "3c"). In a second phase, the images
           undergo further processing to remove portions
           of certain structures (from roads, rivers or
           beaches) which might be misconstrued as urban
           and which would therefore skew the estimation
           of urban areas ("2e" and “3e "). Next, “holes” in
           the images are filled and the final product is
           cross-referenced against a vectoral database

130                                                                         AFRICA'S URBANISATION DYNAMICS 2020 © OECD 2020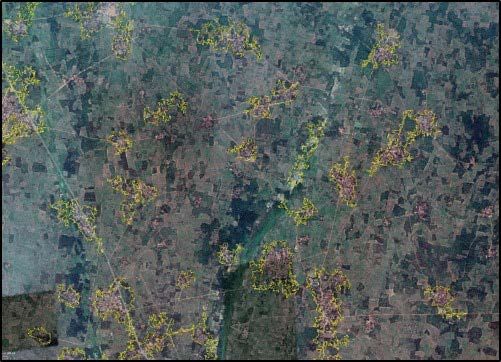
Processing satellite images   Annexe A

Figure A.1
Image processing sequences (simplified)

                  Dry zones                                            Wetlands

                       [ 2a ]
                 Grey tinted image                                                 White Top Hat        Black Top Hat
                                                        [ 3a ]
                                                  Grey tinted image
                    [ 2b ]                                                            Closure by reconstruction
        White Top Hat    Black Top Hat
                                                        [ 3b ]                                   [ 3c ]
                                                  High thresholding                        High thresholding
                       [ 2c ]
             Closure by reconstruction
                                                                          [ 3d ]
                                                                        Overlapping
                       [ 2d ]
                 High thresholding
                                                                             [ 3e ]
                                                                  Filling of holes (by size)

                         [ 2e ]
              Filling of holes (by size)
                                                                       Gathering from
                                                                      the rule of 200 m

       Deletion of poorly classified pixels
                                                                  Filling of holes (by size)

             Overlapping with the
        Geopolis agglomeration centroids                                  [ 3f ]
                                                                 Overlapping with the
                                                            Geopolis agglomeration centroids

                      [ 2f ]
                Output polygones                                      Output polygones

AFRICA'S URBANISATION DYNAMICS 2020 © OECD 2020                                                                               131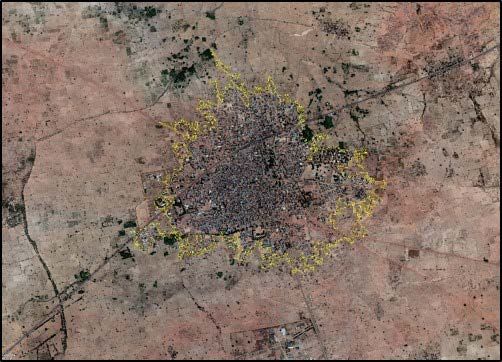
Annexe A Processing satellite images
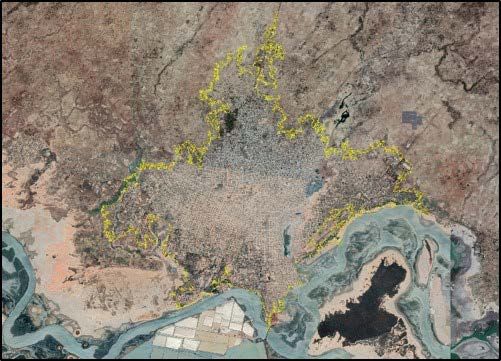
Image A.1
Image processing sequence (dry zone), Zinder (Niger)
a) b)
c) d)
e) f) Scale: 2 km
Notes: a) Original image in shades of grey; b) Application of morphological filters on the grey-tinted image. Sum of White Top Hat and Black Top Hat;
c) Closure by reconstruction of image “b”; d) Binary image obtained through the "high thresholding" of image "c"; e) Deletion of pixels that could be
misclassified; f) Final outline of the agglomeration after cross-referencing with the Geopolis database.
Source: Google Earth (accessed February 2018)
132 AFRICA'S URBANISATION DYNAMICS 2020 © OECD 2020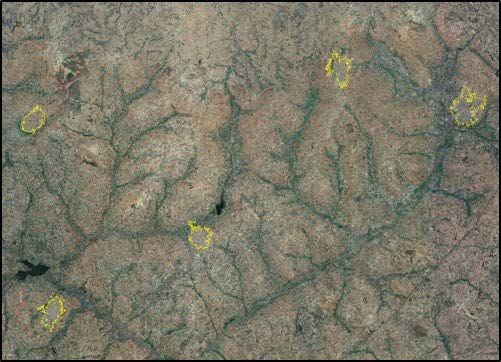
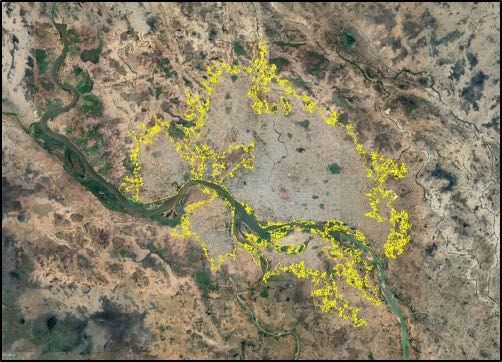
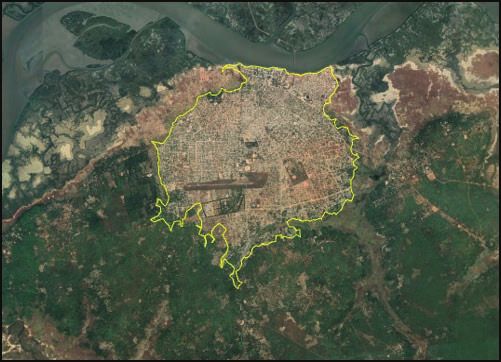
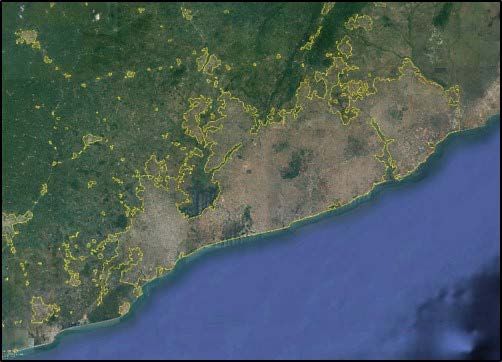
Processing satellite images      Annexe A

Image A.2
Image processing sequence (wetlands), Lagos (Nigeria)

a)                                                                              b)

c)                                                                              d)

e)                                                                              f)                                                          Scale: 12 km

Note: a) Original image in shades of grey; b) Binary mask obtained from the "high thresholding" of the grey-tinted image; c) Binary mask obtained from the
"high thresholding" of the image to which morphological filters have been applied; d) Overlapping of “b” and “c”. The red corresponds to the parts that are
perfectly overlapped, the yellow to portions only visible in image “b” and the blue to portions only visible in image “c”; e) Deletion of pixels that could be
misclassified; f) Final outline of the agglomeration after cross-referencing with the Geopolis database.
Source: Google Earth (accessed February 2018)

AFRICA'S URBANISATION DYNAMICS 2020 © OECD 2020                                                                                                                        133
Annexe A   Processing satellite images

           Image A.3
           Wet zone agglomerations

           a)                                                         Scale: 20 km         b)                                                          Scale: 20 km

           c)                                                         Scale: 10 km         d)                                                          Scale: 20 km

           e)                                                          Scale: 4 km         f)                                                           Scale: 4 km

           Note: a) Accra (Ghana), b) Kumassi (Ghana), c) Abidjan (Côte d’Ivoire), d) Onitsha (Nigeria), e) Ziguinchor (Senegal), f) Kenema (Sierra Leone).
           Source: Google Earth (accessed February 2018)

134                                                                                                            AFRICA'S URBANISATION DYNAMICS 2020 © OECD 2020
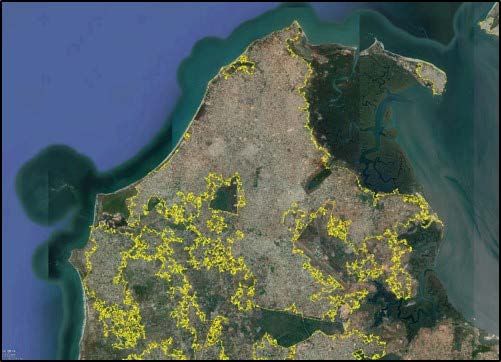
Processing satellite images   Annexe A

Image A.4
Dry zone agglomerations with exceptions

a)                                                        Scale: 10 km         b)                                                           Scale: 7 km

c)                                                          Scale: 2 km        d)                                                           Scale: 3 km

e)                                                       Scale: 1,5 km         f)                                                           Scale: 6 km

Note: a) N’Djamena (Chad), b) Banjul (Gambia), c) Tambawel (Nigeria), d) Kaolack (Senegal), e) cluster of small urban agglomerations (Togo), f) cluster of
small urban agglomerations (Nigeria).
Source: Google Earth (accessed February 2018)

AFRICA'S URBANISATION DYNAMICS 2020 © OECD 2020                                                                                                                    135
From:
                               Africa's Urbanisation Dynamics 2020
                               Africapolis, Mapping a New Urban Geography

                               Access the complete publication at:
                               https://doi.org/10.1787/b6bccb81-en

   Please cite this chapter as:

   OECD/Sahel and West Africa Club (2020), “Processing satellite images”, in Africa's Urbanisation Dynamics
   2020: Africapolis, Mapping a New Urban Geography, OECD Publishing, Paris.

   DOI: https://doi.org/10.1787/7e740a18-en

This work is published under the responsibility of the Secretary-General of the OECD. The opinions expressed and arguments
employed herein do not necessarily reflect the official views of OECD member countries.

This document, as well as any data and map included herein, are without prejudice to the status of or sovereignty over any
territory, to the delimitation of international frontiers and boundaries and to the name of any territory, city or area. Extracts from
publications may be subject to additional disclaimers, which are set out in the complete version of the publication, available at
the link provided.

The use of this work, whether digital or print, is governed by the Terms and Conditions to be found at
http://www.oecd.org/termsandconditions.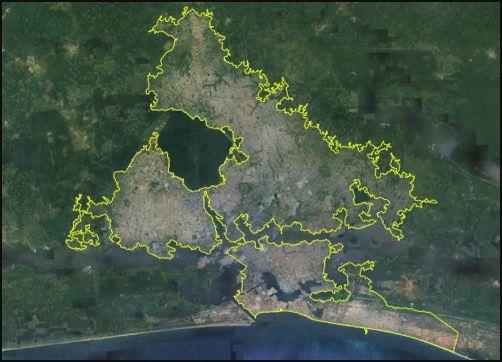
You can also read