Michigan State University - 2018 19 and 2019 20 Budget Development
←
→
Page content transcription
If your browser does not render page correctly, please read the page content below
Michigan State University
2018‐19 and 2019‐20 Budget Development

Budget Development Highlights
• Anticipate largest and most diverse incoming class in MSU history

• Propose two‐year budget for continuity

• Longer term enrollment and programmatic challenges and opportunities

• Restructure 2019‐20 undergraduate tuition and fee rates to block
  structure

• Investment income used to fund just‐in‐time, debt service, campus
  infrastructure and other programmatic requirements

• Budget outcomes by year
                                                                      2
Enrollment & Programmatic Challenges and
Opportunities
•   Maintain higher education’s value proposition for students and their
    families

•   Focus on exceptional programming accessible to Michigan students

•   Programmatically address K‐12’s inconsistent preparation of college‐
    bound students

•   Prepare for increased competition for Michigan/domestic non‐
    resident/international students – MSU’s incoming international class
    projected to decline

•   Address increasing demand for Business and Engineering (inclusive of
    broader STEM disciplines) programming through innovative new offerings
                                                                             3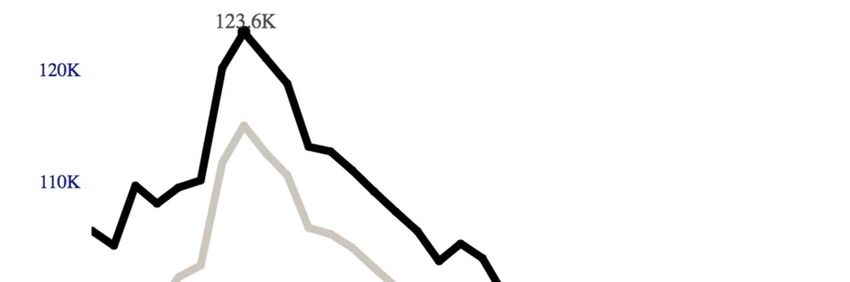
Enrollment & Programmatic Challenges and
Opportunities
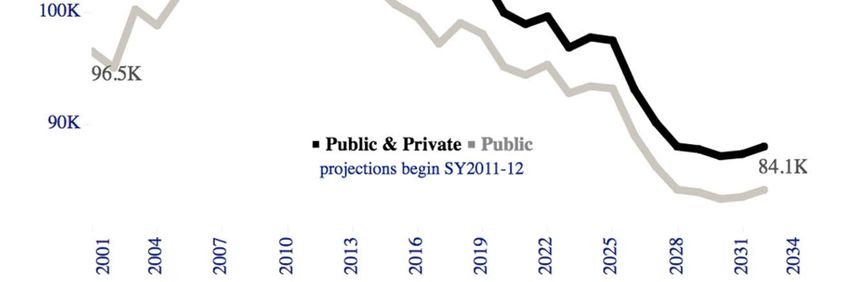
• Analysis from Deloitte projects a decrease in in‐state high
school graduates
124k
120k
• Projected 15%
reduction in the
110k
next 10 years
100k
• Approximately
97k
75% of MSU 90k
undergraduate Public High School Graduates
Public & Private High School 84k
Graduates
students are
2001
2004
2007
2010
2013
2016
2019
2022
2025
2028
2031
2034
Michigan residents
4Enrollment & Programmatic Challenges and
Opportunities
In addition to decreasing in‐state high school graduates, MSU’s five largest domestic, OOS
feeders – mostly in the Midwest and Northeast, will also see decreases in high school graduates
over the next 10 years.
Expected High School Graduate Decrease 2018-2028*
1 2 3 4 5
Illinois California New York New Jersey Ohio
12% 8% 1% 9% 12%
Decrease Decrease Decrease Decrease Decrease
From 2015-2017, Illinois, California, New York, New Jersey, and Ohio represent $65M or nearly 15% of MSU’s total net tuition revenue; a new
strategy for OOS is needed to address this potential loss
*Source: Knocking at the College Door: Projections for High School Graduates 2016
52018‐19 Tuition and Fees
No $360/year increase $540/year increase
increase appx $1 per day appx $1.50 per day
In state Freshman*
Out of state Freshman*
Students with Sophomore standing and above
or in their second year or beyond (regardless
of major or residency)
Junior and Senior Students (regardless of
residency)
Junior and Senior Engineering Students
(regardless of residency)
Junior and Senior Business Students
(regardless of residency)
* See FY19 and FY20 Budget Overview document, Attachment B1 for full detail.
Note: If an in state, First Time in Any College student comes to MSU with 28+ credits, tuition will remain at the 2017‐18 rate. This does not include transfer students. 6
**If an International or out of state First Time in Any College student comes to MSU with 28+ credits, tuition will increase by approximately $364/year. This does not include transfer studentsAverage Starting Salary
The average starting salaries for graduates from the College of Business and the College
of Engineering are 12% and 25% higher than that of the $53,000 average starting salary
for all MSU graduates.
$70,000
$66,495
$60,000 $59,503
$53,000
$50,000 Average for all
MSU graduates.
$40,000
$30,000
$20,000
$10,000
$0
College of Business College of Engineering
Source: Michigan State University, 2017 Destination Survey
7Resident Undergraduate 2018‐19 Academic
Year Rates
Tuition Tuition Change from 2017‐18
FY18 FY19 $ Change % Change
Core/Professional Colleges
Freshman $14,460 $14,460 $0 0.0%
Sophomore $14,460 $14,820 $360 2.5%
Junior $16,290 $16,650 $360 2.2%
Senior $16,290 $16,650 $360 2.2%
Business
Freshman $14,460 $14,460 $0 0.0%
Sophomore $14,460 $14,820 $360 2.5%
Junior $17,102 $17,642 $540 3.2%
Senior $17,102 $17,642 $540 3.2%
Engineering
Freshman $14,460 $14,460 $0 0.0%
Sophomore $14,460 $14,820 $360 2.5%
Junior $17,990 $18,530 $540 3.0%
Senior $17,990 $18,530 $540 3.0%
Rates for engineering and business juniors and seniors include programmatic fees of $670 and $226 per semester 8
respectively2019‐20 Undergraduate Tuition & Fees
• Tuition rate freeze for the 2019‐20 academic year
• Establish a block tuition structure for
undergraduate students taking between 12 and 18
credits
• Tuition rate based on 15 credits per semester
• Incentivizes students to pursue more credits per semester,
lowering time to degree and related indebtedness
92018‐19 Budget Outcomes
Appropriations
• 2018‐19 appropriation indicated at 1.8%
• Base upon performance funding adjustments in the State funding formula
• Legislative tuition restraint threshold established at 3.8%
• 2019‐20 appropriation assumed at 2.0%
• Consistent with RSQE forecast for Detroit CPI
• Anticipates continuation of State funding formula and tuition restraint
provisions
• Propose to Governor and state legislature that institutions who do not
increase base tuition in a given year should receive additional
performance funding in the same way that institutions who increase
tuition in excess of the restraint limit are ineligible for performance
funding
102018‐19 Budget Outcomes
Financial Aid
• Increase of approximately $6.4 million or 4.5 percent
Campus Safety
• 13 new Title IX and related positions – includes preventative and investigative
staff
• 10 new positions in Counseling & Psychiatric Services
• 4 new MSU Police officers
• 2 new Employee Assistance positions
• 2 new FOIA Office positions
• 2 new Office of Enterprise Risk Management, Ethics, and Compliance positions
112018-19 Budget Outcomes
Student Health Insurance
• To help support student health care, all students will
be required to have health insurance beginning
January 1, 2019
• For those with existing coverage, no change
anticipated
• Coverage included as part of need‐based financial
aid for eligible students without existing coverage
• Currently a requirement for all International students
122018‐19 Budget Outcomes
Salary proposals
• One year freeze on salaries for all top administrators
(Including VPs, deans and similar ranks)
• Faculty and academic staff raise increment at 1.5%
plus 0.5% Provost market
• Research assistant salary increase of 2%
• Student employee salary increase of 4%
• All other increases in accordance with union
contracts
132018‐19 Budget Outcomes
College and Department Budget Proposals
• 1.0 percent across the board cut for 2018‐19
• 1.0 percent reallocation used by the Provost to reallocate
for university wide priorities remains in place
Funded Campus Facilities
Examples include:
• Music Building (donor support and internal funding)
• STEM Building ($29.9M in state support approved June 6, plus
internal support)
• Water Plant (internal funding)
142018‐19 Budget Outcomes: Budgetary Increments
Operations, $2.0, 5.0%
Research Facilitation, $1.3, 3.4% Revenue‐Based Initiatives, $1.1, 2.8%
New Space Allocation, $1.2, 3.1%
Financial Framework ‐ Academic
Competitiveness, $2.5, 6.4% Salaries, $10.1, 25.8%
Supplies/Services, $2.8,
7.2%
Other Benefits, $3.4,
8.7%
Financial Aid,
$6.6, 16.9%
Financial Framework ‐
Technology, $3.5, 9.0%
Health Insurance, $4.6, 11.8%
Total budgetary growth includes the $39.0M in components noted above,
offset by utilities (‐$3.4M) and unit (‐$6.2M) reductions, resulting in a total budgetary change of $29.4M, of which $20M from tuition
Dollars in millions 152018‐19 and 2019‐20 Budget Summary
Budget Item 2018‐19 Current Proposal 2019‐20 Current Proposal
State Appropriations 1.8% 2.0% (assumption)
No increase for resident freshmen, No tuition increase for all undergraduate students
Tuition and Fees $360 per academic year for non‐resident freshmen
A new rate structure that includes per credit rates
Increases of $360 per academic year for resident and for students taking 11 credits or less, block rates
non‐resident Core/Professional sophomores ‐seniors for students taking 12‐18 credits, and a hybrid
block/per credit structure for students taking 19+
$540 per semester for resident and non‐resident junior credits
& senior Business and Engineering students
4.0% for most graduate students
4.0% for most graduate students
Total Tuition & Fee Revenue $1,002.8 $1,051.5
Financial Aid 4.5% 7.1%
Graduate Assistants 2.0% 2.0%
Faculty Salaries 1.5%+0.5%* 2.5%+0.5%*
Utilities ‐6.1% 0.0%
Health Care 5.0%** 5.0%**
Financial Framework
Competitiveness $2.5 $3.2
Technology $3.5 $6.5
Performance Efficiency Reallocation ‐1.0% ‐1.0%
Base Budget Reduction ‐1.0% 0.0%
Total Budget $1,391.5 $1,449.2
*Includes 1.5% merit and 0.5% Provost market
**Health care budget augmented by amounts previously committed to collective bargaining groups due to claims experience 16You can also read