Cryptocurrencies during COVID - Marcin Wątorek Cracow University of Technology Faculty of Computer Science and Telecommunications
←
→
Page content transcription
If your browser does not render page correctly, please read the page content below
Cryptocurrencies during COVID
 Marcin Wątorek
 Cracow University of Technology
 Faculty of Computer Science and Telecommunications
Short money history
• Barter - goods or services for other goods or services
• Symmetry breaking–> one universal commodity–> money
• universal features: durable, homogeneous, rare
• Commodity money: grain, salt, tobacco, beads, leather
• Coins: bronze, copper, iron, precious metal: gold and silver
• Paper money -> fiat currencies -> digital currency (credit cards, Paypal)- loss of
 intrinsic value
• Next stage - cryptocurrencies?
Cryptocurrency idea

• 2008 – Bitcoin - Satoshi Nakamoto
• transactions without central governing number of publications per year
 system
 MW
• confidence in the state/central banks Bitcoin(t)
 replaced by confidence in technology
• double spending problem
• information about transactions stored in a
 distributed public ledger ->

 Blockchain MW

P2P network Cryptography PoW
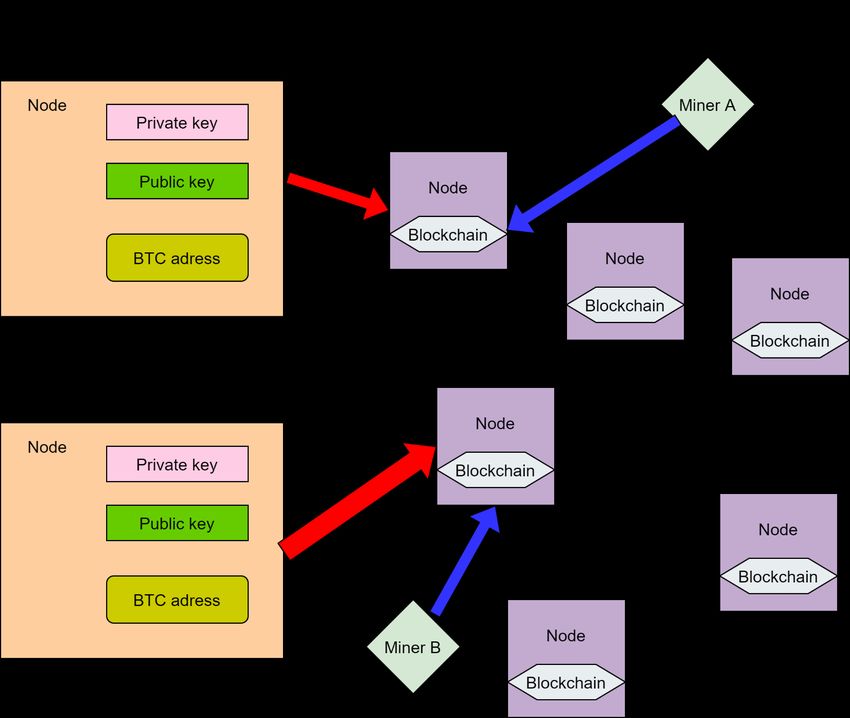
Assymetric
 cryptography
 How do cryptocurrencies work? Blockchain
 P2P network

 Security:
 Proof of Work

Miners validate transactions, then combine them into blocks and
receive a reward for adding a block to the chain (mining process).
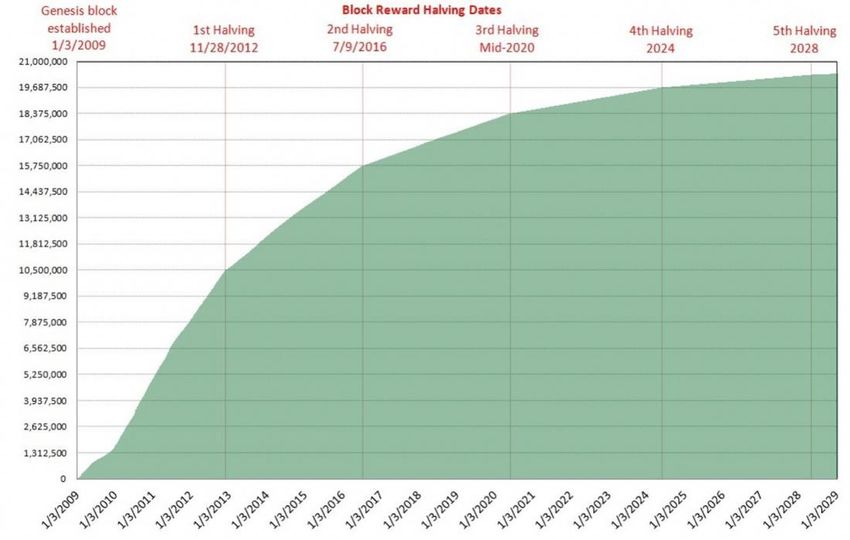
Bitcoin vs fiat currencies
Purchasing power index of the USD

 BTC supply

Monetary base in US [USD]

 BTC- fixed max supply – 21 000 000 - algorithm
 USD – unlimited supply – FED policy
 hedge against printing money and the depreciation of fiat currencies
Stylized facts observed on mature financial markets:
• „fat tails” in return distributions
 RΔt(t)
• volatility clustering
• long memory of the autocorrelation function
• nonlinear correlations Financial time series

• fractality and even multifractality Time
 RΔt(t)=log(P(t+ Δt))-log(P(t)) P(t) – price in t

 Random time series with normal distrbution

 RΔt(t)

 Time
Comparison of cryptocurrencies with currencies in Forex
There are no significant differences in the characteristics of exchange rates for currencies and cryptocurrencies

Cummulative distributions of normalized log-reurns
 Autorrelation function of the normalized
R(Δt)=log(P(t+ Δt))-log(P(t)) rΔt=(RΔt-μ)/σ absolute log-returns

 Autorrelation function of the normalized log-returns

 2017-2018

 2017-2018
Multifractal spectrum
 Nonlinear correlations
 MFCCA/MFDFA: Time series Xk= [x(t1), x(t2),…, x(tn)]
 2017-2018
 1. Detrending:
 No scaling in
 2. Covariance: previous years

 3. Fluctuation function:

 4. Scaling:

 q>0 large
 fluctuations

For single time series:

 Market maturation
Slope of F(q,s) – q Hurst
scaling exponent- h(q) fluctuations exponent ≈ 0.5
Bitcoin price changes in US dollar from 2019 Return distributions Multifractal spectra

 Aug 2019

 R(Δt)=log(P(t+ Δt))-log(P(t)) High volatility Mar 2020
 clusters

 Bifractal-like shape of the spectrum related to
 exteme volatility
 Δt=1 min
 Symmetric spectrum during normal periods
 Date
Cross-correlations between cryptocurrencies and traditional assets in 2018
 Pearson correlation coefficient
 Noise level ( , )
 Average
 Cij=
 ( )
 fluctuations
 Time scale dependence

 Large
 fluctuations Fluctuation size dependence

 Cryptocurrencies not correlated with traditional assets
 Can be used as a hedge?
What happened on financial markets in 2020?
 (1) The first identified case of Covid-19
 in the United States (Jan 21, 2020)
 (2) Global market panic (March 2020)
 (3) The 2nd wave of the US pandemic
 (June-Jul 2020)
 (4) The pandemic slowdown in US, all
 time highs on S&P500 and NQ (Aug 2020)

 Time series of bitcoin (BTC), ethereum (ETH)
 and 20 conventional assets: fiat currencies:
 Australian dollar (AUD), euro (EUR), British
 pound (GBP), New Zealand dollar (NZD),
 Canadian dollar (CAD), Swiss franc (CHF),
 Chinese offshore yuan (CNH), Japanese yen
 (JPY), Mexican peso (MXN), Norwegian krone
 (NOK), Polish zloty (PLN), Turkish lira (TRY),
 and South African rand (ZAR), stock market
 indices: Dow Jones Industrial Average (DJIA),
 NASDAQ100, S&P500, and commodities:
 gold (XAU), crude oil (CL), silver (XAG), and
 copper (HG), all expressed in US dollar.
Cross-correlations between BTC and traditional assets in 1 month rolling window
 Statistically significant cross-
 correlation started in Jan 2020
 (1) Negative ρ(q=4, s=360)
 between BTC and S&P500,
 positive with JPY, CHF, and gold.
 BTC hedge for risky assets?

 (2) Positive correlations
 between BTC and all assets
 except JPY during global panic
 in March 2020.

 (3) Positive correlations between
 BTC and all assets except JPY
 during the 2nd wave of the US
 pandemic (June-Jul 2020).
 (4) BTC positively correlated with
 all assets, even EUR, CHF and JPY
 during Covid-19 pandemic
 slowdown and bull market on all
 assets expressed in USD.
Central banks policy - true factor behind emergence of correlation between cryptocurrencies and traditional assets?

 Bitcoin(t)

 Are cryptocurrencies fulfilling their intended role as a hedge against printing money and the depreciation of fiat currencies?
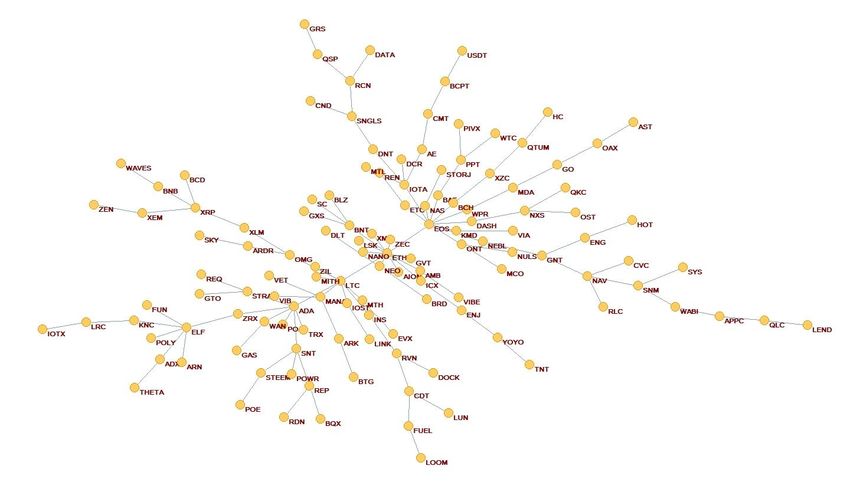
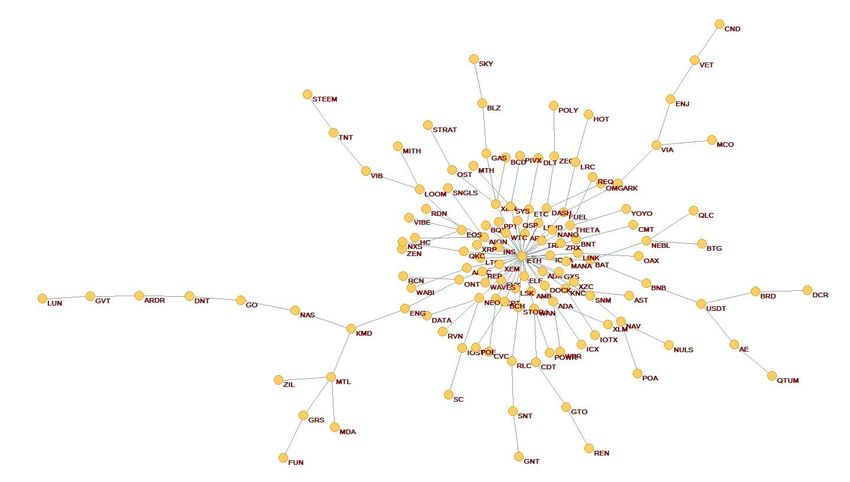
Network representation of the cryptocurrency market
Exchange rates of a form X/BTC, where X stands for one of 128 cryptocurrencies traded on the Binance exchange
Minimal spanning tree from ρ(q,s) correlation matrix metric from the correlation coefficient:
MST structure represents the strongest connections between
cryptocurrencies

Centralized MST Decentralized MST

 Jan 2019 Jan 2019

Central node -> Ethereum

 Ethereum

 ρ(q=1,s=10 min) ρ(q=1,s=360 min)
Changes in MST structure in 30-day rolling window
ρ(q=1,s=10 min) Jan 2020 ρ(q=1,s=10 min) March 2020
 Extreme
 Average volatility
 volatility

 Ethereum

 Tether dollar
 1 USDT~1 USD

 Centralized MST structure during extreme volatility
Conclusions
• Return distributions, autocorrelation function, Hurst exponent for
 cryptocurrencies are now similar to those observed in mature financial markets
• Global market panic in March 2020 affected cryptocurrencies return
 distributions and caused bifractal-like singularity spectra but this was no
 different the behavior of traditional markets
• Centralized cryptocurrency market network structure and much stronger cross-
 correlations between the nodes were observed during turbulent periods,
 especially the sudden dropdowns
• Events connected with Covid-19 triggered the emergence of cross-correlations
 between the major cryptocurrencies and the traditional markets
• Cross-correlations occurred not only during the sharp market fall, but also
 during a recovery phase in the summer 2020
• It seems that the cryptocurrency market have ceased to be an island detached
 from the traditional markets and become a connected part of the world’s
 financial markets
You can also read