Big Data on Vessel Traffic for Nowcasting Trade Flows in Real-Time

Page created by Troy Dominguez
 
CONTINUE READING
Big Data on Vessel Traffic for Nowcasting Trade Flows in Real-Time
Big Data on Vessel Traffic for
                  Nowcasting Trade Flows in Real-Time

                                      Serkan Arslanalp        Marco Marini
                                               Patrizia Tumbarello

                                                 Statistics Department
                                           International Monetary Fund (IMF)

                 New Techniques and Technologies for Statistics 2019
                             Brussels — March 12, 2019

The views expressed in this presentation are those of the authors and do not necessarily represent the views of the IMF, its Executive Board, or IMF management.
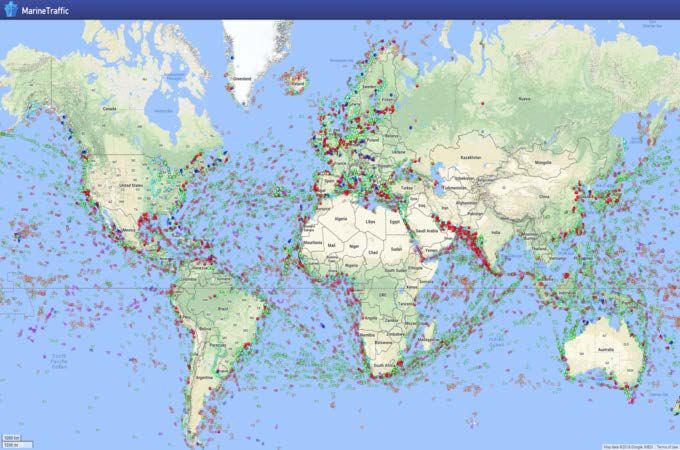
Big Data on Vessel Traffic for Nowcasting Trade Flows in Real-Time
Outline

Motivation
Key Questions and Findings
Data and Methodology
Validation Study
  • Maritime statistics
  • Trade statistics
  • Direction of trade statistics
Relevance for Policy

                                              2
Big Data on Vessel Traffic for Nowcasting Trade Flows in Real-Time
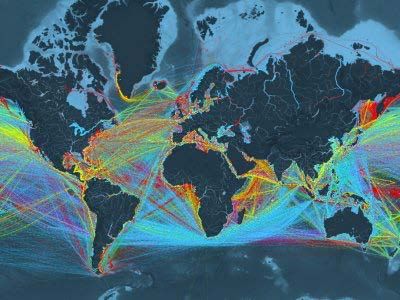
Motivation: Explore Innovative Sources to Complement Official Statistics

 This work is aligned with:
   IMF’s Overarching Strategy on Data and Statistics (2018)
   IMF’s Staff Discussion Note on Big Data (2017) to provide innovative,
     real-time, and granular insights

 Benefits of Big Data on Vessel Traffic:
   Possible improvements of timeliness and periodicity of official trade data
   Provide additional granularity on trade flows
 Challenges:
   No internationally accepted methodology        Validation study using Malta as
    benchmark
   Access to data  Multiple data providers (e.g., MarineTraffic.com)
                                                                                      3
Big Data on Vessel Traffic for Nowcasting Trade Flows in Real-Time
Key Questions and Findings

 Can Vessel Traffic Data track Official Maritime Statistics?
   Yes. Vessel traffic data appear to show higher coverage of ships than official port statistics
    for Malta

 Can Vessel Traffic Data be used to Nowcast Official Trade Statistics?
   Yes. Good correlation with movements of official trade data for Malta

 Can Vessel Traffic Data Offer a Breakdown of Trade Statistics by Partner Country?
   Partly. Vessel traffic data are affected by shifts in maritime routes and transit trade

                                                                                                     4
Big Data on Vessel Traffic for Nowcasting Trade Flows in Real-Time
Data and Methodology

                       5
Automatic Identification System (AIS) Data for Real-Time Tracking of Ships

 Automatic Identification System (AIS)
  allows for real-time tracking of
  commercial vessels

 An “air traffic control system” for ships

 Introduced in 2004 after the International
  Maritime Organization (IMO) made it a
  requirement for major commercial vessels
  for safety reasons

 Real-time data tracked by several data
  providers and made available online
                                                                              6
Visualizing Vessel Traffic Data

◼ For a visualization of the data, play this video
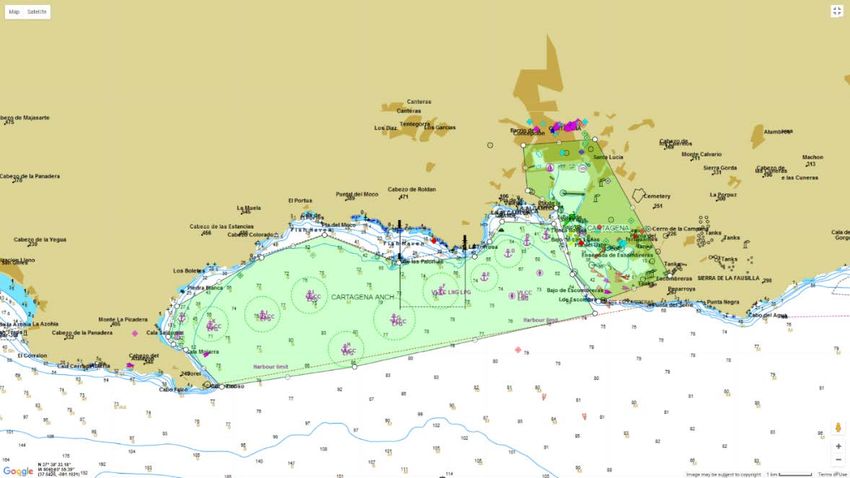
                                                                  7
Port Calls: Fusion of Vessel Positions and Port Boundaries

                                                     Defining Port and Anchorage Boundaries:
                                                     Port of Cartagena, Spain

 AIS messages, when aggregated, contain
  billions of ship positions and other voyage-
  related information in real-time

 Port call data are generated combining
  positional data and geofenced areas. Port
  calls focus only on vessel activity near a port,
  particularly on incoming and outgoing vessels

 Defining port and anchorage boundaries
  requires careful work. More than 7,000
  ports being monitored by MarineTraffic
                                                                                               8
Key Contribution of the Paper: Filter to Identify Ships Involved in Trade Activity

                                                                                   Filtering Genuine Cargo Shipments Based on Duration of Stay at Port
                                                                                   (Number of ships by duration of stay in Marsaxlokk and Valletta. Period: 2015-2018)
                                                                                       6000
                                                                                                       18.1%

                                                                                       4500                      15.2%
 Focus on:                                                                                                                  13.1%

                                                                     Number of Ships
                                                                                                                                        11.9%
 Container and general cargo ships                                                    3000   9.0%                                                 8.6%
 Stays at port between 5-60 hours                                                                                                                                                                                              7.9%
                                                                                                                                                              5.7%
                                                                                       1500
                                                                                                                                                                         3.5%
                                                                                                                                                                                    2.5%
                                                                                                                                                                                               2.0%
                                                                                                                                                                                                          1.4% 1.2%
                                                                                          0

                                                                                              0-4.99

                                                                                                        5-9.99

                                                                                                                  10-14.99

                                                                                                                             15-19.99

                                                                                                                                        20-24.99

                                                                                                                                                   25-29.99

                                                                                                                                                              30-34.99

                                                                                                                                                                         35-39.99

                                                                                                                                                                                    40-44.99

                                                                                                                                                                                               45-49.99

                                                                                                                                                                                                          50-54.99

                                                                                                                                                                                                                     55-59.99

                                                                                                                                                                                                                                >60
 Filtering (exclusion) rules:
                                                                                          Duration of stay at port (hours)
 Ships in transit
 Anchorage and bunkering tankers                       Sources: MarineTraffic, Staff estimates.

 Missing data pairs (e.g. ships arrived but not departed)
 Stays in port that do not reflect trade activity (i.e. drifting or repair/maintenance)                                                                                                                                          9
Three Indicators of Cargo Activity

 Cargo number indicator:    number of cargo ships (filtered)
 Cargo size indicator:      sum of gross tonnage of cargo ships (filtered)

                                            Both Indicators are Comparable with
                                                Official Maritime Statistics

                                                                                  10
Three Indicators of Cargo Activity (continued)

 Cargo load indicator:

       is the deadweight tonnage of ship i arrived in port on a given week t
       is the reported draught of the ship upon arrival
       is the reported draught upon departure
       is the maximum draught reported by the ship in the sample

   Draught

                                                   Proxy Indicator of Trade Volumes in Goods
                                                         (Sum of Imports and Exports)

                                                                                               11
Validation Study

                   12
Why Malta as Benchmark?

                                                   Countries with Largest Shares of Seaborne Imports in the EU
                                                   (Extra-EU Imports by Mode of Transport, percent of total extra-EU imports)
                                                   Period: 2016.

                                                    Denmark                     56.1

 Small open economy                              Netherlands                    61.0

                                                     Slovenia                    61.2

                                                     Lithuania                   61.2
 Most international trade is seaborne
                                                      Finland                     64.5

                                                         Italy                       65.6

 High-quality official statistics available on         Malta                        69.8

  Eurostat portal can serve as benchmark                Spain                           73.4

                                                      Greece                                76.0

                                                     Portugal                            78.7

                                                                               Sea          Air    Road    Rail

                                                     Source: Eurostat.

                                                                                                                                13
Our Cargo Number Indicator Broadly Tracks Official Maritime Statistics,
                              Highlighting a Larger Coverage of Ships

                                                                         Malta: Cargo Number Indicator Good Proxy of Official Port
Malta: Cargo Number Indicator (weekly)
Number of Ships arrived using AIS-based port calls. Period: 2015-2018.
                                                                         Statistics Cargo number indicator vs. Official number of ships arrived in Marsaxlokk
                                                                         and Valletta. Period: 2015-2018, quarterly.
140                                                                      1600
130                                                                      1500

120                                                                      1400

110                                                                      1300

100                                                                      1200

 90                                                                      1100

 80                                                                      1000

 70                                                                       900

 60               Original                                                800                                            Official    AIS Port Calls
 50               5-term Moving Average                                   700

 40                                                                       600
  2015-1 2015-27 2016-1 2016-27 2017-1 2017-27 2018-1 2018-27                   2015Q1 2015Q3 2016Q1 2016Q3 2017Q1 2017Q3 2018Q1 2018Q3

 Sources: MarineTraffic, Staff estimates.                                   Sources: Eurostat, MarineTraffic, Staff estimates.

                                                                                                                                                                14
High Correlation with Official Trade Volumes

 Malta: Cargo Load Indicator (weekly)                                                 Malta: Cargo Load Indicator Highly Correlated with Official Trade
 Deadweight tonnage adjusted for draught in AIS-based port calls. Index 2016=100.     Volume (correlation 0.65)
 Period: 2015-2018.                                                                   Cargo load indicator versus official trade volume index, 2016=100. Period: 2015-18
180                                                                                 140

160                                                                                 130

140                                                                                 120

120                                                                                 110

100                                                                                 100

 80                                                                                  90

 60                                                                                  80

 40                                         Original                                 70                                                            Official          AIS
                                            5-term Moving Average
 20                                                                                  60
  2015-1 2015-27 2016-1 2016-27 2017-1 2017-27 2018-1 2018-27                          Jan-15 Jun-15 Nov-15 Apr-16 Sep-16 Feb-17 Jul-17 Dec-17 May-18 Oct-18
     Source: MarineTraffic, Staff estimates.                                              Sources: Eurostat, MarineTraffic, Staff estimates.

                                                                                                                                                                           15
AIS Data Provides Breakdown by Partner Country that is Affected
                                  by Maritime Routes and Transit Trade

  Malta: Imports by Country of Origin (Customs Data)                                           Malta: Imports by Country of Last Port (AIS)
  Share by Partner Country based on Direction of Trade Statistics. Period: 2015-2018.          Share by Partner Country based on Cargo Load Indicator. Period: 2015-2018.
100%                                                                                    100%
90%                                                                                     90%
80%                                                                                     80%
70%                                                                                     70%
60%                                                                                     60%
50%                                                                                     50%
40%                                                                                     40%
30%                                                                                     30%
20%                                                                                     20%
10%                                                                                     10%
 0%                                                                                      0%
                2015             2016           2017               2018                             2015               2016                 2017            2018
          Italy    Germany       United Kingdom   France      Spain    Rest                            Italy     Egypt   Spain       France    Turkey   Rest
       Sources: IMF Direction of Trade Statistics.                                             Sources: MarineTraffic, Staff estimates.

                                                                                                                                                                            16
Relevance for Policy

 International trade has an important share of GDP in many countries. Tracking a
  country’s trade in real-time may offer prompt and informative insights on economic activity

 The methodology can be extended to other countries, particularly those with a significant
  share of trade carried by ships

 On a global scale, vessel traffic data offers great potential for the monitoring of world
  trade flows on a real-time basis, which would be an invaluable input for multilateral
  surveillance.

 Our results do not question the accuracy of official trade statistics but offer ways to
  enhance their timeliness, periodicity, and granularity
                                                                                                17
Application to Small States: Long Lags in Timeliness/Periodicity of Official Trade Data

           Timeliness of Merchandise Trade Data                                   Periodicity of Merchandise Trade Data
                 (in percent of all small states)                                       (in percent of all small states)

40%                                                                       50%

30%                                                                       38%

20%
                                                                          25%

10%
                                                                          13%

0%
       1-2 months       3-5 months       6-11 months      12 or more      0%
                                                            months                    Monthly              Quarterly   Annual

Source: Authors’ calculations.                                            Source: Authors’ calculations.
Note: Sample includes all small state members of the IMF (43 in total).
Small states have population of less than 1.5 million people.

                                                                                                                                18
Big Data on Vessel Traffic for
Nowcasting Trade Flows in Real-Time

            Thank you!
            For further information:
    Serkan Arslanalp (sarslanalp@imf.org)
       Marco Marini (mmarini@imf.org)
  Patrizia Tumbarello (ptumbarello@imf.org)
You can also read