Big Data and health - Center for Economic Studies (CES)
←
→
Page content transcription
If your browser does not render page correctly, please read the page content below
Big Data and health

                   Melanie Lührmann   Royal Holloway, University of London and IFS

                   September 16, 2020

c Royal Holloway
Big data in economics
Data innovations relevant for economic analysis in recent years
• increasing availability of administrative data, and linkages
between administrative and survey data
• emergence of (social) network, mobility and other “online” data
• huge cost reduction and increase in smaller-scale online surveys
c Royal HollowayAdministrative data in health
1. Germany:
• claims data from health insurers (Farbmacher et al 2020)
• administrative hospital claims data (Reif et al. 2018)
2. UK:
• hospital episode statistics: contain information on diagnosis,
hospital spells, treatments,...
• UK Biobank: an online survey of ca. 500,000 individuals between
2006 and 2010, linked with administrative hospitalisation data,
birth and death records, and soon GP data
3. US:
• Medicare claims data: 20% subsample (also contains data on plan
choice in Medicare Part D)
4. Mortality data from death records, sometimes linked to census
data (e.g. UK Celsius panel)
c Royal HollowayAdministrative data: pros and cons
+ typically large samples → this is particularly attractive to study
relatively rare events such as severe health shocks (heart attack,
stroke, cancer, mortality etc.)
+ typically representative (large) subsamples of the population or
population data
- typically small set of individual socio-economic characteristics
- no (direct) information on perceptions, preferences, attitudes,
expectations, subjective well-being
+ sometimes long time series available → particularly important for
the study of life cycle health or long-run impacts of interventions
c Royal Holloway(Social) network and “online” data
• particularly important now to study Covid-19 spread and impacts
• mobility data from mobile phone companies, google,....
• social network data from twitter, fb, ...
• knowledge and information spread data from google trends
c Royal HollowayExample: Google trends data, Covid vs. Brexit, UK, 2018
to today
Figure: Google trends data, Covid vs. Brexit, UK, 2018 to today
c Royal HollowayExample: Kuchler et al. (2020)
• use aggregated data from Facebook
• Social Connectedness Index: probability that Facebook users in a
pair of regions are Facebook friends with each other (Bailey et al.,
2018)
• show that COVID-19 was more likely to spread between regions
with stronger social network connections
• Areas with more social ties to two early COVID-19 hotspots
(Westchester County, NY, in the U.S. and Lodi province in Italy)
generally had more confirmed COVID-19 cases at the end of
March
• in the U.S., a county’s social proximity to recent COVID-19 cases
predicts future outbreaks over and above physical proximity
c Royal HollowayExample: Kuchler et al. (2020)
Figure: Social connectedness and cases per 10k popoulation, Westchester
c Royal Holloway(Social) network and “online” data: pros and cons
+ typically large samples
- typically selective in terms of platform use and general online
usage
- typically linkable to geographic areas, but small set of individual
socio-economic characteristics or none, so requires linkage to
other data
- direct information on choices (i.e. location, information
consumption and communication)
+ available in high frequency
+ also available retrospectively after large shocks (unanticipated by
researchers)
c Royal HollowayResearcher-administered online surveys: pros and cons
+ cheap
+ tailored to the researchers’ interest
+ allows fast response surveys (depends only on resources and speed
of researchers)
+ sample size on demand
- intransparency about representativeness of company-provided
online samples
- difficult to check reliability of answers compared to
interviewer-conducted surveys (measurement error)
• typically selective (depend on sample recruitment process,
incentives to participate, tastes?)
- typically small set of individual socio-economic characteristics as
billable per question → creates datasets with limited reusability
for other researchers, so at macro level not so cost-efficient?
c Royal HollowayResearcher-administered online surveys: sample
representativeness
The representativeness of online samples depends on the selectivity
of
• internet participation
• platform participation
• survey participation
• survey-firm provided incentives
• attrition and item non-response
• ...
c Royal HollowayResearcher-administered online surveys: sample
representativeness
Can we fix this through weighting?
• Couper et al. (2007) argue that simple “calibration weighting”
(by age, gender education) is unlikely to appropriately account for
the selection in online survey responses
• large panel studies such as GSOEP, PSID or Understanding
Society can account for non-response selection by developing
probabilistic weights (through learning about initial non-response
and subsequent survey attrition over time)
• they also allow direct observation of non-response and analysis of
selectivity
• for more on inverse probabilistic (IP) weighting, see Wooldridge
(2002)
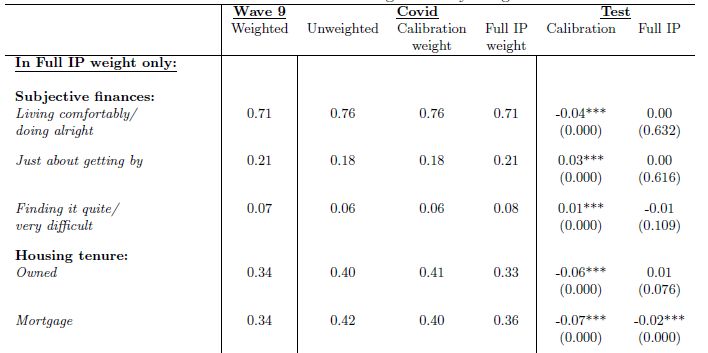
c Royal HollowayExample: Crossley et al. (2020) - Impacts of COVID-19 or: the power of weights c Royal Holloway
Crossley et al. (2020)

    • null is rejected for calibration weights for all variables
    • under full IP weighting, the null is rejected only for the
      percentage owning a home with a mortgage.
    • using calibration weights, one would
            • overestimate the fraction of individuals reporting that they were
              living comfortably by 4 percentage points
            • overestimate the fraction managing to save some of their income
              by 8 percentage points (not shown)
            • underestimate the fraction of individuals living in social housing by
              9 percentage points (not shown)
    • Hence: sampling matters and weighting is non-trivial in online
      surveys
    • in experiments that focus more on internal validity, this is less of
      a concern (as they randomise within the potentially
      non-representative sample)
c Royal Holloway
Particulars in health economics
• power is often a major concern as prevalence rates for many
conditions are low until later stages of the life cycle (where
selective mortality concerns kick in)
• exceptions: studies of risky lifestyles, nutrition, bodyweight and
self-rated health
• hence: large reliance on administrative data
• renewed interest in contagious diseases due to Covid-19 and
widespread anti-vaccination movements are likely to result in
rising interest in network data
• additional type of new(ish) data:
genetic data and biomarkers
→ typically elicited in the context of large surveys (ELSA,
SHARE, UK Biobank, HRS...)
c Royal HollowayYou can also read