H2020 ClairCity project: Assessment of air quality impacts for Bristol City Council
←
→
Page content transcription
If your browser does not render page correctly, please read the page content below
H2020 ClairCity project:
    Assessment of air quality
  impacts for Bristol City Council
 V. Rodrigues, K. Oliveira, S. Coelho, J. Ferreira, A. P. Fernandes, S. Rafael, C. Borrego, C.
Faria, K. Vanherle, P. Papics, O. Ivanova, T. Husby, I. Diafas, P. Nielsen, A. Kewo, C. Trozzi,
 E. Piscitello, S. Knudsen, J. Barnes, S. Slingerland, H. Bolscher, E. Hayes, and M. Lopes

                                   vera.rodrigues@ua.pt
                                University of Aveiro, Portugal

                                           www.claircity.eu

          This project has received funding from the European Union’s Horizon 2020
          research and innovation programme under grant agreement No. 689289
ClairCity objectives
• Putting citizens behaviour and practices
  at the heart of the debate
• Develop a suite of innovative toolkits
  for enhanced quantification,
  engagement and impact evaluation
• Integrate citizens behaviours in city
  policies now and in the future
• Raise awareness of environment
  changes and their solutions
The ClairCity approach
• Six distinct case studies
   • Bristol: pilot case study
   • City with a traffic problem: high NO2 concentrations
   • Potential problem related with PM2.5 concentrations

                                                 Not every
                                                 city is the
                                                  same…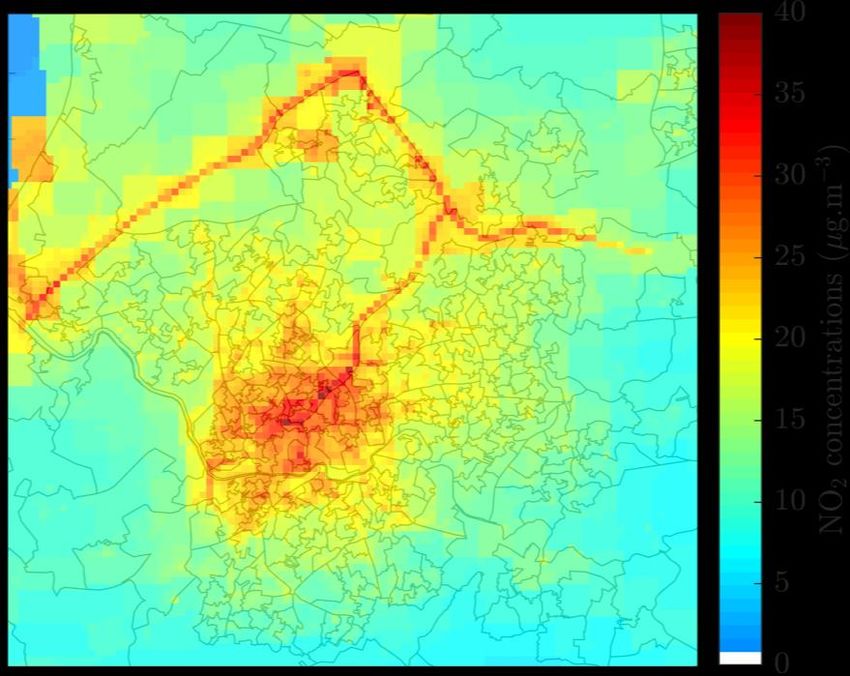
The ClairCity approach
      Benchmarking       Quantification of         Assessment of
        behaviour           baseline                   Policy

               DELPHI
              survey &
             workshops

                                  Stakeholders Dialogue
  Skylines                        Workshop for scenarios
   game                                generation
                   MLW

    Quantification of       Scenarios
                                                  Policy Package
       Impacts              Evidence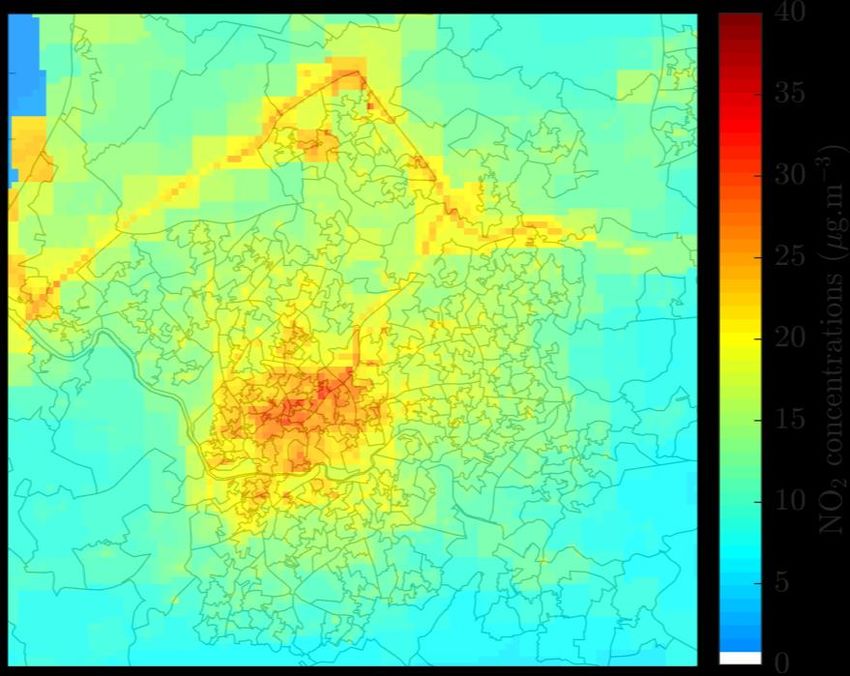
Air quality at urban scale
                                   • Road traffic
  URBAIR                             • Industrial
  modelling                         • Residential
  approach                         • Commercial
                                • Power generation

Topography, sources
   location and                     Emissions        Meteorological data
    dimension

 Geographical                     Emissions           Meteorology
   module                          module               module
                                  Dispersion
                                   module                       URBAIR

  ‘Priority Air Pollutants’   concentration fields
                               NO2, PM10, PM2.5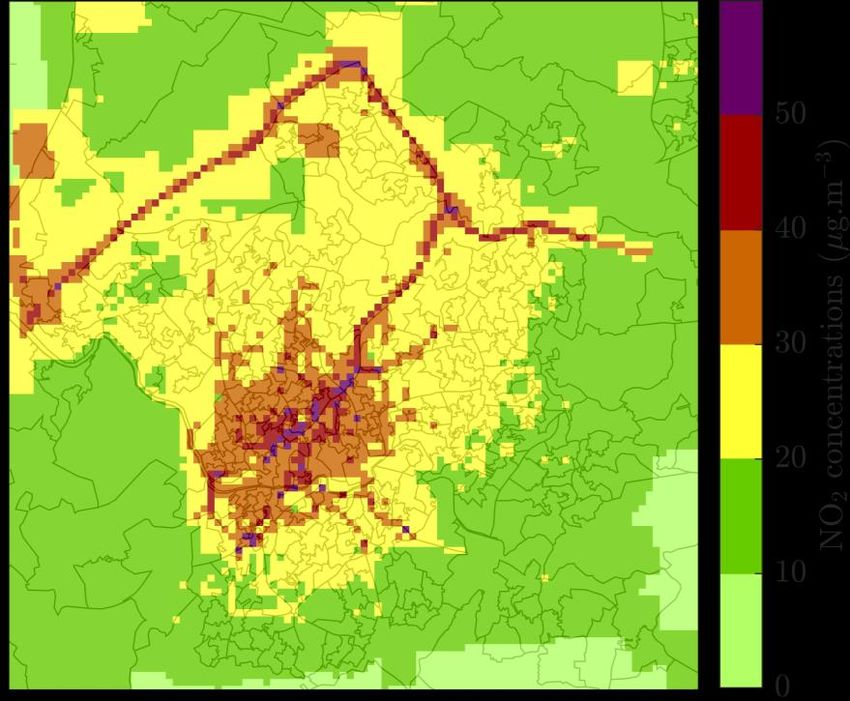
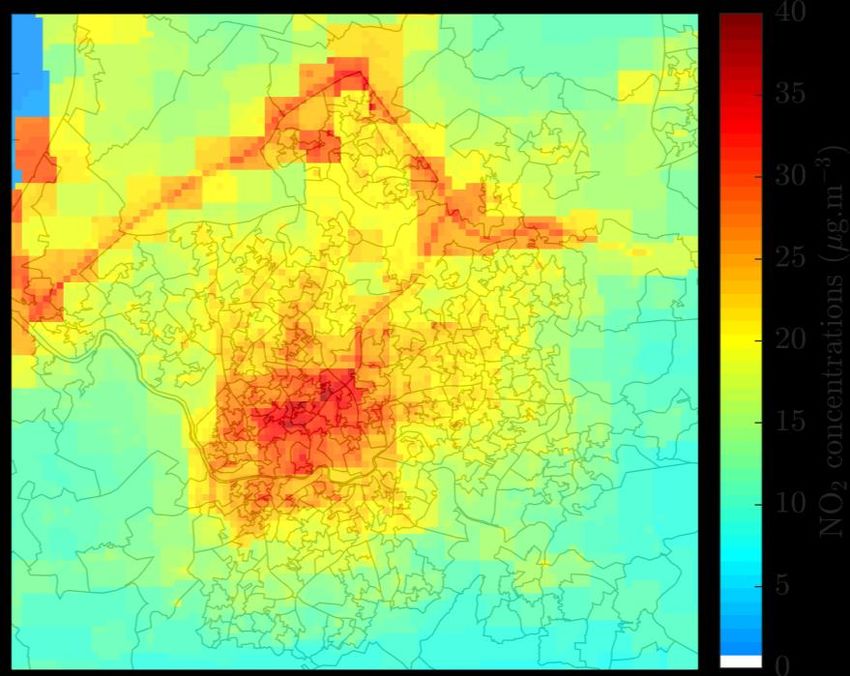
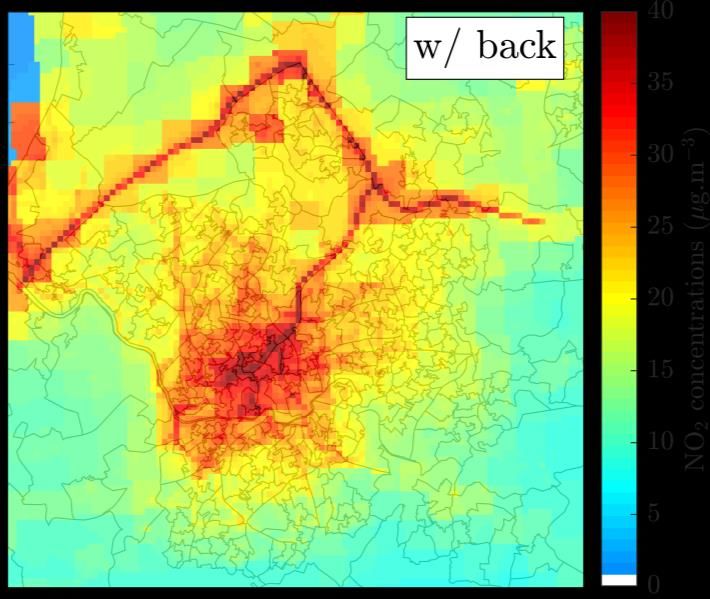
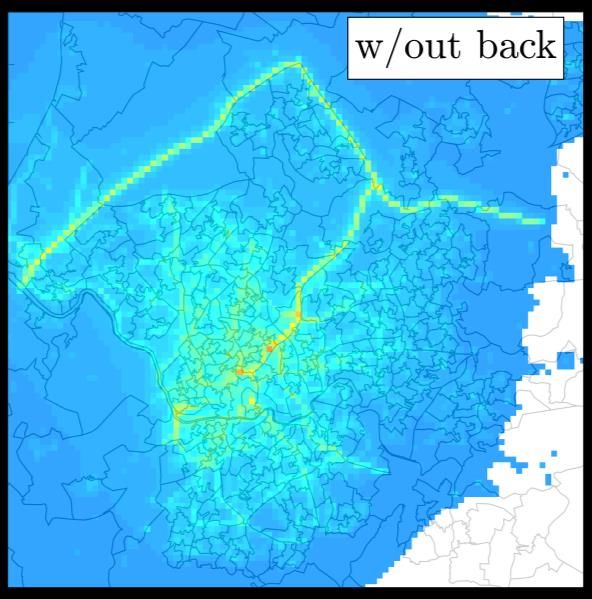
Air quality
  maps
 NO2 concentrations
NO2 concentrations
• URBAIR model outputs
• Different categories were simulated separately
• Underestimation of the simulated concentrations
Background concentrations
• NO2 concentrations
• Transboundary contribution and other remaining sources
• Concentration maps from UK’s Department for Environment Food &
  Rural Affairs (DEFRA)
• Contributions from aircraft, rail, other and rural sectors
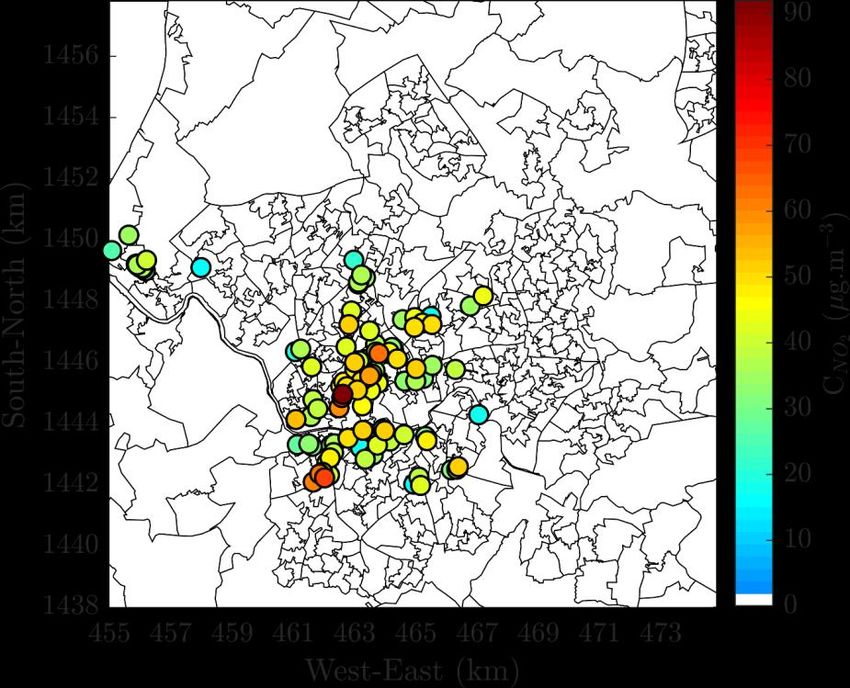
Model
adjustment
 NO2 concentrations
Diffusion tubes
measurements                                                min = 16.6 µg.m-3
                                                            max = 91.2 µg.m-3
• A total of 107 tubes:                                     mean = 42.1 µg.m-3
• 96 roadside, 4 kerbside and 7 background tubes

  Location of the diffusion tubes with   Annual mean NO2 concentrations
  information about the site type        measured by each diffusion tube in 2015
min = 22.5 µg.m-3
Continuous measurements max = 44.2 µg.m-3
mean = 36.0 µg.m-3
• 2 roadside, 1 kerbside and 1 background sites
• St Paul’s urban background station from the AURN network
Location of the continuous sites with Annual mean NO2 concentrations
information about the site type measured by equipment in 2015Air quality for the baseline year
adjustment
• NO2 concentrations factor of 1.6
• 231 cells exceeding the EU legal limit valueAir quality maps PM concentrations
Air quality for the baseline year
adjustment factor:
• Particulate matter concentrations PM10 = 0.9
PM2.5 = 0.8
• Cells exceeding the WHO guidelines:
• 16 for PM10 concentrations
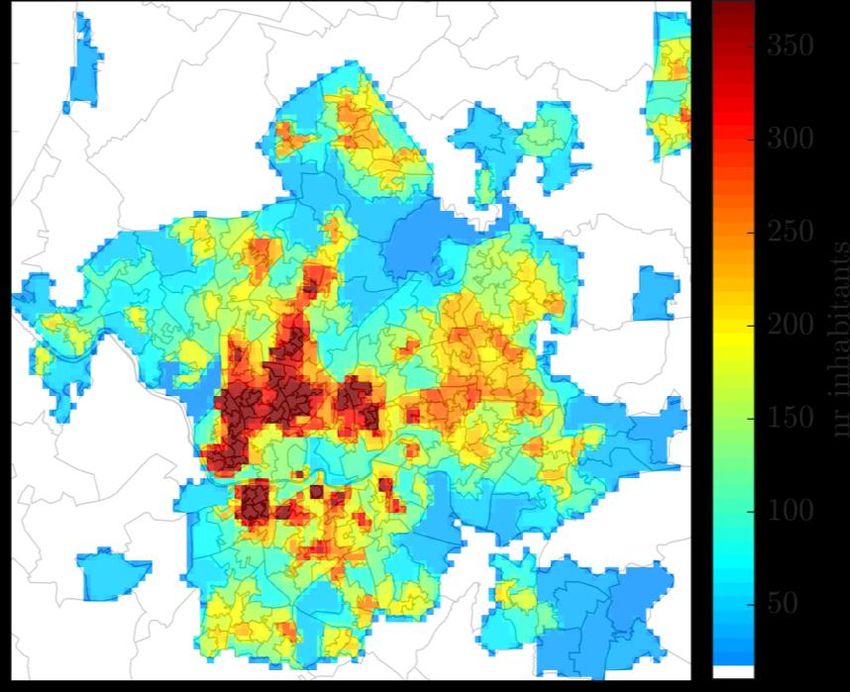
• 655 for PM2.5 concentrationsPopulation exposure Bristol
Population exposure in Bristol
• 5% of Bristol population was potentially exposed to
  harmful levels of NO2 concentrations in 2015
Population exposure in Bristol
• Population potentially exposed to PM10 and PM2.5
  concentrations above the WHO recommendations
Business-as-usual (BAU): assess how
               emissions change in the future,
               without policy changes but taking
BAU scenario   into account behavioral,
               technological changes and effects of
               existing policy, for 3 years (2025,
               2035, 2050)
BAU impacts on NO2
• Overall reduction of the maximum concentration in 16%, in 2050
when compared with 2025
• Exceedances to the EU limit value in 2025 (only 5 cells)
2025 2050Citizen-led and Targeted scenarios that identify
‘enabling’ policies so that greener
Citizen-targeted choices/behaviour become the
scenarios social norm for everyoneUnified Policy Scenario • Ban polluting cars • Cheaper public transport • Cleaner buses • Walking and cycling • Charge polluting vehicles entering the city • Reduce private car road space • Improve energy efficiency in housing • Promote electrical vehicles • Increase solar and wind • Property developers to consider air quality and climate change • Spread economic opportunities across the city
UPS impacts on NO2
• UPS scenario leads to compliance with legal NO2 limit values in
  2025, whereas BAU scenario does not
• Maximum concentration: reduction of 11% and 17% in the UPS,
  compared to the BAU

            2025                                  2050
What have we learnt with
ClairCity?
• Popular and effective (or not?)
measures
• “Promoting public transport”:
• quite popular
• moderate effect…
• “Reduce access to private cars”:
• very effective for Nox
• if access restriction level is set
ambitious enough (e.g. no
diesel)What have we learnt with
ClairCity?
• Popular and effective measures
• “residential fuel switch”:
• effective for PM
• importance currently
underestimated by most citizens
• “stimulate walking/cycling”:
• can be effective!
• cultural shift needed!
• more a “desire” then a true policy
measure
• Also important to note: already in the
BAU situation will improve a lotClairCity
Our future
with clean air
www.claircity.eu
@ClairCity
This project has received funding from the European Union’s Horizon 2020 research and innovation
programme under grant agreement No. 689289.You can also read